
Abstract
This article presents the In-service Aircraft of a Global Observing System (IAGOS) developed for operations on commercial long-range Airbus aircraft (A330/A340) for monitoring the atmospheric composition. IAGOS is the continuation of the former Measurement of OZone and water vapour on Airbus In-service airCraft (MOZAIC) programme (1994–2014) with five aircraft operated by European airlines over 20 yr. MOZAIC has provided unique scientific database used worldwide by the scientific community. In continuation of MOZAIC, IAGOS aims to equip a fleet up to 20 aircraft around the world and for operations over decades. IAGOS started in July 2011 with the first instruments installed aboard a Lufthansa A340-300, and a total of six aircraft are already in operation. We present the technical aircraft system concept, with basic instruments for O3, CO, water vapour and clouds; and optional instruments for measuring either NOy, NOx, aerosols or CO2/CH4. In this article, we focus on the O3 and CO instrumentation while other measurements are or will be described in specific papers. O3 and CO are measured by optimised but well-known methods such as UV absorption and IR correlation, respectively. We describe the data processing/validation and the data quality control for O3 and CO. Using the first two overlapping years of MOZAIC/IAGOS, we conclude that IAGOS can be considered as the continuation of MOZAIC with the same data quality of O3 and CO measurements.
1. Introduction
Global climate change represents the most serious environmental issue facing mankind today, with implications for the global political stability and the global economy. Reliable predictions of the future climate using models are central and fundamental requirements for determining future mitigation strategies. The use of commercial aircraft allows the collection of highly relevant observations on a scale and in numbers impossible to achieve using research aircraft, and where other measurement methods (e.g. satellites) have technical limitations. Commercial aircraft are considered an ideal platform to record vertical profiles from 0 to 12 km in the troposphere over regions never or poorly sampled by other programmes (e.g. surface or radio soundings network). They also allow to extensively sample the region of the atmosphere between 9 and 12 km corresponding to the critical upper troposphere–lower stratosphere (UTLS) region at mid-latitudes, where most of the long-range aircraft are flying, at high horizontal and vertical resolution.
Few projects have used commercial aircraft, there were historical programmes such as the Global Atmospheric Sampling Program in the 1970s (GASP; Falconer and Pratt, Citation1979), the Measurements of Nitrogen Oxides and Ozone Along Air Routes programme (NOXAR; Brunner et al., Citation2001) in the 1990s, and still until now, the Comprehensive Observation Network for Trace gases by Airliner project (CONTRAIL; Machida et al., Citation2008) that is operated since 1993 with carbon dioxide (CO2), carbon monoxide (CO) and other trace gas measurements on several Boeing aircraft from Japan Airlines. In this context, the In-service Aircraft of a Global Observing System (IAGOS; www.iagos.org) is a new research infrastructure conducting long-term in situ observations, on a global scale and from aircraft of international airlines, of gas atmospheric composition such as ozone (O3), CO, CO2, nitrogen oxides (NO y and NO x ), water vapour and methane (CH4), with additional aerosols and cloud particle measurements (CitationPetzold et al., 2015). The IAGOS consortium combines research institutes, universities, national weather services, airline operators and aviation industry. Participating airlines from different continents ensure a global coverage of the network. Scientifically and technologically, IAGOS builds on the experience gained within the former research projects MOZAIC (Measurement of OZone and water vapour on Airbus In-service airCraft; Marenco et al., Citation1998 and www.iagos.fr/mozaic) and CARIBIC (Civil Aircraft for the Regular Investigation of the Atmosphere Based on an Instrument Container; Brenninkmeijer et al., Citation2007 and www.caribic-atmospheric.com).
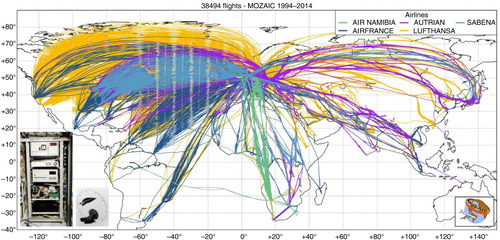
Briefly, MOZAIC was initiated in 1993 by European scientists, aircraft manufacturers and airlines to better understand the natural chemical atmospheric composition variability (O3 and water vapour as key species for climate and air quality issues) and how it is changing under the influence of human activities, with a particular interest in the aircraft impacts. MOZAIC consisted in automatic and regular measurements, by five long-range passenger airliners, of O3 and water vapour since 1994 and CO (as one of the main O3 precursors and pollution tracer) since end of 2001. Additional NOy measurements (nitrogen reservoir to further understand the O3 budget) was made on one aircraft for 5 yr (2001–2005). A large database of measurements (38 494 flights over 1994–2014, see map in ) allows studies of chemical and physical processes in the atmosphere (Nédélec et al., 2005), validations of global chemistry transport models (Stohl et al., 2003) and satellite retrievals along with studies on climatologies and trends (Thouret et al., 1998b).
Fig. 1 Map showing the spatial coverage of 38494 MOZAIC flights between 1994 and 2014. Airline names are shown on the top right corner, and the MOZAIC system and Inlet are seen on the bottom left corner.
About 10 yr ago, back in 2004–2005, the historical MOZAIC consortium has started the transition from a ‘three successive phases’ research programme into a research infrastructure preparatory phase with objectives of (1) making a long-term deployment on a 20 aircraft fleet (>20 yr) and (2) making near real-time transmission of data. Therefore, new developments for O3 and CO core measurements have then started to propose a combined instrument smaller and lighter to allow more room for additional optional packages (measuring greenhouse gases, nitrogen oxides and aerosols). In the frame of MOZAIC, two different analysers were used to measure O3 and CO. Design and performances of the O3 instrument (UV analyser) are described in Thouret et al. (1998a). Design and performances of the CO instrument (IR analyser) are described in Nédélec et al. (Citation2003). Routine IAGOS measurements started in mid-2011 with the first A340 from Lufthansa equipped with the first set of newly developed high-tech instruments for atmospheric gas measurements (O3, CO, water vapour) and cloud particles. Five other aircraft have been equipped so far, operated by Air France, China Airlines, Cathay Pacific, Iberia and Lufthansa (two aircraft).
The objective of this article is to present the methodology and performances of this new O3–CO instrumentation within the so-called Package1. The other associated instruments such as the water vapour sensor and the cloud droplet detector are described elsewhere (Helten et al., Citation1998; Beswick et al., Citation2014; Neis et al., Citation2014). IAGOS aims to achieve a level of data quality that other measurement methods are unable to attain deploying all over the world identical systems with regular quality assessment procedures, including calibration against reference instruments based on Global Atmospheric Watch (GAW) standard procedures. Therefore, we aim to demonstrate that the longest time series of O3 (and CO) recorded since 1994 (and 2001) can be considered as uninterrupted using equivalent devices with the same maintenance/calibration procedures and under the responsibility of the same group. Indeed, this makes MOZAIC–IAGOS a unique in situ data set for O3 trend assessments over already two decades.
2. The IAGOS technical concept
With 20 yr of successful operation, the MOZAIC project clearly proved the pertinence of using commercial aircraft for global atmospheric composition monitoring on a routine basis. Therefore, European partners involved such as the Centre National de la Recherche Scientifique (CNRS, France) and Forschungszentrum Jülich (FZJ, Germany) with additional funds from the Sixth Research Framework Programme (FP6) agreed in 2003 to set up the ‘In-service Aircraft for a Global Observing System – Design Study’ (IAGOS-DS) as a development project for new improved and optimised airborne system packages. Finally, the IAGOS technical concept design was achieved in 2009.
The knowledge gained through MOZAIC initiated the designs of a new European Aviation Safety Agency (EASA) certified instrumentation that has to be specifically mounted on in-service aircraft as new aircraft time-optimised production processes make installations almost impossible within a final assembly line. The choice was made to continue with Airbus A340 and A330 as aircraft carrier for the IAGOS system for several reasons. First, their potential for installing scientific equipment were very well known by the European research team since they served the MOZAIC project for two decades. Secondly, their number representation is large among airlines. Indeed, although Airbus A340, characterised by their outstanding long-range distance capabilities, are no longer commercialised by Airbus since 2010, more than 300 aircraft are still flying worldwide. Moreover, about 1500 Airbus A330 that fulfil the ETOPS (Extended-range Twin-engine Operational Performance Standards) certification have been ordered. And finally, Airbus initiated in 2015 the design of a new A330 generation (A330neo). The latter ensures that the A330 will remain in operation over the next 20 or 30 yr and will be suitable to carry the IAGOS instruments for long-term operation.
2.1. IAGOS aircraft instruments
To install and to maintain a scientific instrumentation aboard, commercial aircraft on a long-term basis present challenging issues to solve. First, all the systems involved must fulfil the aeronautic certification rules for aircraft safety. Second, all system operations must be fully automatic with minimal maintenance. Third, the measuring instruments must continuously provide high data quality during operation periods of several months.
Also, the choice of the measured parameters is a compromise between scientific interest, technical possibilities and aircraft operation constraints. Therefore, it was decided to split the overall instrumentation into two packages according to each individual device complexity and operational lifetimes. These packages are briefly described below.
The Package1, developed by CNRS, is the IAGOS central system. It can last 6 months in operation before replacement and it includes the O3 instrument, the carbon monoxide (CO) instrument, the data acquisition system and the interface that collects aircraft parameters such as position, speed and ambient meteorological data (see ). Associated components to Package1 are the MOZAIC water vapour sensor from FZJ (Helten et al., Citation1998; Neis et al., Citation2014) and the University of Manchester Backscatter Cloud Particle probe (BCP; Beswick et al., Citation2014). After landing, all data are transmitted to the IAGOS receiver station (see Section 3.5). More details on Package1 are provided in Section 3.
Table 1. Parameters provided by the A340/A330 aircraft system
The Package2 are optional instruments that can be installed in addition to Package1. The IAGOS project counts four different Package2 types so far. The Package 2 concept focuses on instruments for measuring specific species and properties such as nitrogen-containing compounds (NO x , NO y ), greenhouses gases (CO2, CH4) or aerosol particle properties. Details on instruments and possible configurations are given by Petzold et al. (2015). All these instruments are very complex to operate routinely, and their needs of gas calibrations shorten their lifetime before replacement compared with the Package1.
2.2. IAGOS system design/architecture
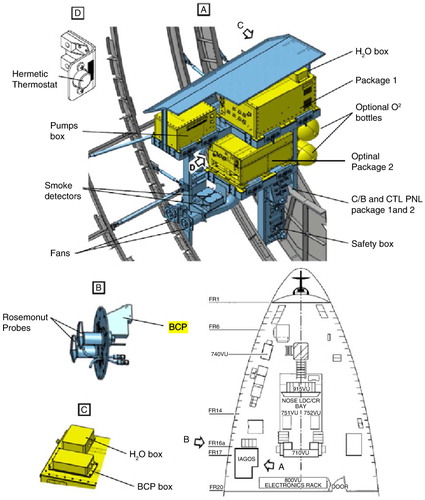
The experience gained during MOZAIC demonstrates that scientific instrumentation can be installed, certified and operated in the avionics compartment of an Airbus aircraft. The system is located on the left side below the cockpit (see ), which presents several advantages. First, the space is reserved by Airbus for an optional Ground Refresh Unit (GRU) that is generally not installed by airlines. Second, there is an inlet plate structural provision for the GRU on the fuselage. The latter allowed to install (and later remove) the IAGOS inlets without altering the aircraft structure. This is the major issue for airlines to accept the system aboard. Third, the position is close to the electrical systems, and navigation parameter systems are included. And finally, it is close to the aircraft nose, which presents a thin aerodynamic boundary layer and therefore minimising inlet sizes.
Fig. 2 Scheme of the IAGOS system mounted on an Airbus aircraft (Package1+Optional Package2).
Detailed design and EASA certification of the IAGOS system installation was done by the aeronautic company Sabena Technics Bordeaux, which has all capabilities to make modifications of Airbus aircraft (both A340 and A330). The IAGOS rack is installed in the GRU reserved area either space free or with the device priory removed before installation (it happened only for one China Airlines A340 so far). As Package2 options are designed for reactive gases and particles, it is always located in the rack lower part to shorten tubing lengths from the inlet plate. Package2 compressed gas cylinders, such as O2 for the nitrogen oxides measurements or calibration gases for the greenhouse gases measurements, are fixed on the rack right side. The Package1 and its connected pump box for air pressurisation are located on the upper shelf. Great efforts were made to obtain a minimal instrumental total payload. The Package1 basic installation weighs about 100 kg and optional Package2 weighs about 60 kg including gas cylinders.
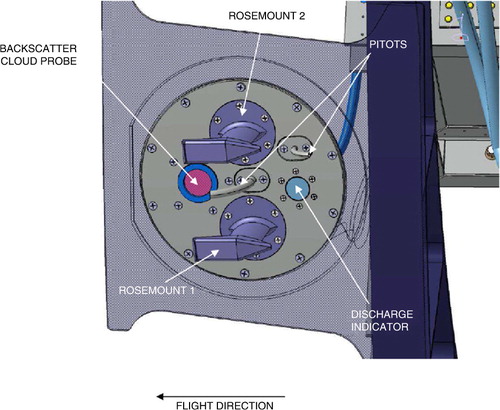
A specific inlet plate (see ) was designed and certified to be installed on the fuselage. It contains the following elements: a twining Rosemount temperature sensor and humidity sensor (H2O) (Helten et al., Citation1998), a forward Pitot Teflon-coated tube (1/4 inch and 6.35 mm) as air inlet for the Package1, a BCP optical block window for cloud detections (Beswick et al., Citation2014), a second Rosemount sensor for the Package2 options, a backward Pitot tube for Package2 air exhaust and a discharge indicator for the Package2 gas supply bottles.
Fig. 3 Scheme of the IAGOS inlet plate fixed to aircraft fuselage.
The IAGOS system starts as soon as the aircraft is powered with no action requested from the airline crew. Power and maintenance panel (comprising circuit breakers), indicators and push-buttons guarantee the system to be safely power supplied and give controls for testing and maintenance operations. A safety box (comprising a set of relays) controls the functioning of each system part that depends on aircraft state configurations (e.g. weight on wheel, engine running, cargo door opened and locked, landing gear up, etc.). The whole IAGOS system is protected from overheating using a thermostat (, D) that stops the system if the avionic compartment temperature is over 45 °C. Cooling fans extract air from Package1, Package2 and the pumps box. IAGOS-specific smoke detectors monitor any smoke or fumes. A dedicated push-button is located on the aircraft cockpit overhead panel and allows powering off the entire system at any time.
2.3. System installation on aircraft
The IAGOS system installation is performed on in-service aircraft during layovers (at least 3 weeks) scheduled for inspections or modifications (e.g. cabin seats, passenger entertainment systems, etc.). Two weeks are needed to mount the whole system with another week dedicated to the functional tests and the certification by the airworthiness authorities. Indeed, even if the equipment have qualified according to aeronautic rules, all aircraft systems have to be checked to make sure that they are not affected by adverse electromagnetic impacts caused by the IAGOS instruments. After completion and approval, the EASA provides a Supplemental Type Certificate (STC) only valid for each individual aircraft. For non-European aircraft, the EASA STC has also to be approved by the local airworthiness authorities before aircraft release into service. At the date of March 2015, six Airbus A340 or A330 have been equipped with the IAGOS system (see ).
Table 2. Aircraft currently equipped with the IAGOS instruments
Aircraft are then operated by airlines similar to IAGOS non-equipped aircraft without any additional restrictions. Only superficial check-up are periodically requested for aircraft airworthiness such as inlet plate visual inspection or relay functional tests. Instrument replacements (Package1, pump box, H2O and BCP) are performed by airlines maintenance staff during scheduled layovers approximately every 6 months or before in case of functional failures detected after reception data analysis.
3. IAGOS central instrument ‘Package1’
The Package1 was developed by CNRS and was based upon the MOZAIC experience for O3 and CO routine measurements aboard commercial Airbus aircraft. The objective was to use the same proven technology but optimised in terms of performance, capability, weight, volume and aeronautic standard compliance. Several prototypes have been built and tested both in laboratory and on research aircraft between 2002 and 2007. One of these prototypes is still routinely operated by the French Airborne Environment Research Service (www.safire.fr) on aircraft Falcon20 and ATR42 since 2010.
The detailed Package1 conception, its pump box, its realisation and its qualification for flight acceptance have been subcontracted to an engineering industrial company in Toulouse (LGM Ingenierie). The instruments (Package1, pump box and associated devices H2O and BCP) have been qualified to aeronautic certification procedure DO-160 (tests for vibrations, electromagnetic interferences (EMI), power supply protections, lightning, overheating, etc.). A Package1 description is provided below.
3.1. General Package1 layouts
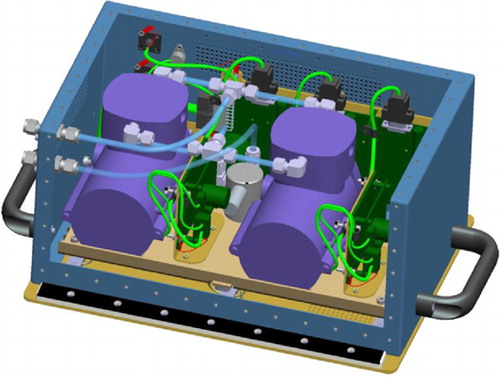
Package1 elements are mounted on two shelves stacked on top of each other and fixed with vertical panels (see b). The block shelves are mounted on shock absorbers inside the cabinet, which is maintained with quick change locks in the IAGOS rack shelf. The external EMI-filtered board connectors (see a) are mounted inside the rear panel. The different main elements are listed and briefly described in . They can also be seen in c and d.
Fig. 4 Package1 picture and schemes. Without H2O and BCP boxes, Package1 weighs 35 kg and the dimensions are 630×450×314 mm. The main elements are listed and described in . (a) Photo of Package1. BCP box and H2O box are fixed on top. The GSM antenna for data transmissions is seen on the connectors face bottom left side. (b) Scheme of Package1 inside. (c) Scheme of the upper shelf viewed from the top. (d) Scheme of the lower shelf viewed from the top.
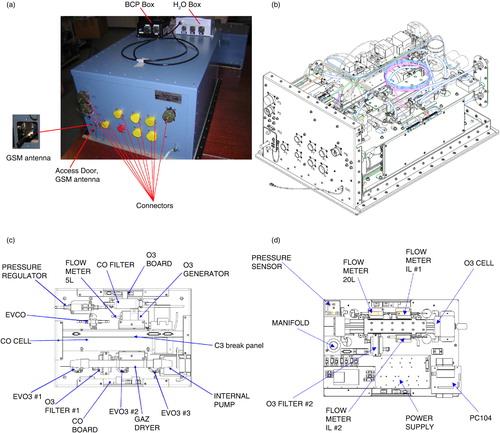
Table 3. List and description of Package1 subassemblies
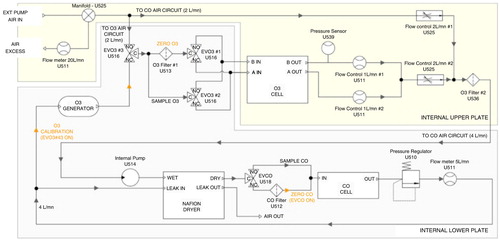
The Package1 flow diagram is presented in . The pump box (see Section 3.2) pressurises air from outside the aircraft to in-cabin pressure level at the manifold. The excess air also exhausts at in-cabin pressure and is monitored by a flowmeter at 20 L min−1 to ensure that the internal pump provides a sufficient flow to the instruments. For weight and volume optimisation, only one internal pump is used for both O3 and CO measurements at 4 L min−1 for normal functioning. The latter is not Teflon coated but is located downstream the O3 air flow path to prevent O3 destruction. Using adjusted length of 1/8 inch Teflon tubes, a part of the air flow (2 L min−1) goes first in the O3 path and then recombine at 4 L min−1 into the CO path where it is pressurised to 2 bar. After the pressure regulator, air is sent to the Nafion gas drier as purge gas and is exhausted to the aircraft cabin. For O3 calibration verifications, the EVO3 #3 is commuted to pass the air flow through the O3 generator prior to the O3 measurement path. This step is done to make routinely an O3 internal calibration check-up.
Fig. 5 Package1 air flow diagram within the upper and lower plates.
3.2. The IAGOS pump box
The Airbus aircraft maximum altitude during a flight is 41 000 feet (12.5 km) where the ambient pressure is 178 hPa. Therefore, to make the measurements, the ambient air has to be driven inside the aircraft and pressurised at in-cabin standard pressure (about 740 hPa) in high altitude. It is done thanks to the pump box (see ) in a similar way as in the previous MOZAIC systems (Thouret et al., 1998a).
Fig. 6 IAGOS pump box – the box contains two pumps in parallel (see text), the electronic control cards and a Teflon solenoid valve. All tubing are Teflon-coated with a 1/4 inch diameter.
The pump box contains two pumps either two Thomas 118ZC20/24 or two Thomas 415ZC36/24. These models deliver an air flow of 30 L min−1 at 1013 hPa and 5 L min−1 at 180 hPa. It is sufficient to provide the Package1 with 4 L min−1 at maximum altitude. All pump internal parts in contact with sampled air are Teflon coated to avoid O3 destruction. As in the MOZAIC system, laboratory tests showed no O3 losses within the pumps (Thouret et al., 1998a).
Since one pump is enough to make the measurements, the system daily alternates between the two devices to extend their lifetimes. The pump is started when the aircraft moves position and a Teflon body solenoid valve is commuted to sample cabin air with a particulate filter to prevent polluted airport air to contaminate the inlet lines and the instruments. The valve is commuted to external air during take-off as soon as the aircraft speed is above 25 m s−1.
The pump box is connected to the inlet pitot tube (see inlet plate in ) and to the Package1 via two stainless steel Teflon-coated hoses (Rotarex Sagana, Serie FX01, internal diameter 6 mm) with a length of, respectively, 1500 and 500 mm. Both hoses are replaced every 2 yr to verify that there is no O3 losses due to hose contamination.
3.3. O3 measurements
The IAGOS O3 instrument () is a standard Model 49 bloc (Thermo Scientific). The latter was also used in the MOZAIC systems (Nédélec et al., Citation2003), and its main components such as measuring cells, UV source and UV detectors have showed a very good robustest and precision with a 6–12 months lifetime.
The measured O3 air flow scheme is presented in . To prevent O3 destruction all tubing up to the O3 cells are made with Teflon. Air is at cabin pressure and instrument components are located upstream of the internal pump. O3 measurements are performed by UV absorption at 254 nm. Two cells are used, one for ambient air containing O3 and the another one with zero O3 air (removed by a MnO2 filter). The cells are switched every 4 s: 3 s for the air flush and 1 s for the measurements. The pressure is measured in the O3 cells to automatically correct the measurements for cabin pressure variations.
The compact O3 processing board developed for the Package1 provides concentrations every 4 s using the Beer–Lambert law:1 K is the molecular absorption coefficient (308 cm−1 at 0°C and 1 bar), L is the cell length (38 cm), C is the O3 concentration in ppmv, I is the UV radiation measured in air containing O3 and I0 is the UV radiation in air with no O3. As the Airbus A330/A340 aircraft maximum cruise speed is nearly 250 ms−1, the Package1 O3 analyser samples at a horizontal resolution of about 1 km during cruise and a vertical resolution of about 50 m during ascents and descents. O3 measurement's total uncertainty is ±2 ppbv±2%. As the same technology used in the MOZAIC systems is used, it combines the Thermo Model 49 uncertainty (±2 ppbv±1%) and the Calibration Thermo Model 49PS uncertainty (±1%).
Before and after each Package1 operation period (nominally 6 months), a O3 laboratory flight calibration is performed by the CNRS. Package1 is O3 calibrated by comparison with a Thermo Scientific Model 49PS reference instrument and for several concentration levels to also check the instrument linearity within 1%. These levels are: 0, 50, 100, 200, 300, 500 and 800 ppbv. The reference instrument is sent twice a year to the French Laboratoire National d'Essais (LNE) for comparison with a National Institute of Standards and Technology (NIST) instrument. The O3 cell pressure sensor is also controlled via a reference device.
The Package1 is equipped with an internal O3 generator for instrument calibration verifications, which produces concentration levels of 0, 100 and 500 ppbv. This is done on ground and during cruise every 2 h. As the precision of this in-flight calibration (15–20%) is much lower than that of the laboratory calibration precision (2%), it is mainly used as a diagnostic of possible calibration instrument drifts.
3.4. CO measurements
The CO instrument () is a standard Model 48 Trace Level (Thermo Scientific) bloc similar to the one found in the MOZAIC system (Nédélec et al., Citation2003). It was also proved to be very reliable during MOZAIC and suitable for routine operation over at least 6–12 months. However, the native concentration lower detection threshold given by Thermo Scientific is only 40 ppbv averaged over 30 s. Therefore, we environed the CO cell with all the modifications done for MOZAIC to improve the CO analyser performances. These are a regulated optimised IR detector, the cell pressurisation, air drying and frequent zeroing. All these modifications and validations are fully described in Nédélec et al. (Citation2003).
Schematic for Package1 CO measurements is shown in . CO line and components are located downstream the internal pump. To increase the signal/noise ratio, the CO measurement cell is pressurised to 2 bar by the pressure regulator. The pressure differential also allow air to dry through Nafion tubes.
The CO measurements are performed by IR correlation at 4.67 mm with an optimised IR detector cooled to −30 °C using Peltier elements. O3 and water vapour are filtered prior to the measurements preventing any interference with the CO absorption signal. Periodic concentrations zeroing are made by passing air into a Sofnocat filter. It is done continuously on ground, then 10 min after take-off and finally every 20 min or if the Package1 internal temperature varies more than 1°C. This is to ensure that important temperature variations do not alter the instrument zero concentration level.
The compact CO processing board developed for the Package1 calculates concentrations averaged over 30 s using the Beer–Lambert law:2 T is the gas light transmittance to the detector, x is the cell length, C is the CO concentration in ppm, I is the IR light intensity after absorption by the CO and I0 is the IR light intensity at zero CO concentration.
As the same technology used in the previous MOZAIC systems is used, the specifications achieved for a 30-s integration time (instrument response time to flush the absorption cell) are as follows: measurement precision is ±5 ppbv CO (signal noise)± 5% (sum of NIST CO traceable bottle 500 ppm: ±2%, dilution system: ±2%, pressure regulator: ±1%). The minimum detection limit is 10 ppbv. As the Airbus A330/A340 aircraft maximum cruise speed is nearly 250 ms−1, the Package1 CO analyser samples at a horizontal resolution of about 7.5 km during cruise and a vertical resolution of about 450 m during ascents and descents. The measurement date is centred within the 30 s of integration time interval.
Similar to the O3 instrument, a laboratory CO calibration is performed by the CNRS before and after each flight operation period. The Package1 CO calibration uses NIST referenced CO cylinders (CO in N2, 500 ppmv) and a dilution system. Calibration is done for several CO levels to also check the linearity of the instrument within 2%. These levels are 0, 250, 500, 750, 1000 and 1500 ppbv. The dilution system is yearly controlled by the French LNE for flowmeters calibration.
3.5. Package1 operation
The Package1 operates fully automatically in aircraft. All functions are controlled by the PC104 block using a dedicated software. The PC104 Arinc-429 reception card is connected to the aircraft computer for acquisition only (bus Arinc-429 ADR3 and EFIS3, see parameters list in ) and the data storage is done every 4 s. The Package1 is started when power is available in the aircraft, at least 2 h before take-off, which is a sufficient time for the O3 UV lamp to start (about 20 min) and for the instrument to be almost stabilised in temperature. Indeed, it is needed for IR CO measurements, which are very sensitive to the instrument's internal temperature. Pressurisation pumps from the pump box are started before take-off when the aircraft moves from its parking position and are stopped after landing. As one pump in normally sufficient for providing the requested flow in altitude (up to 12.5 km), only one pump is used (alternate every day) to increase pump lifetimes. Data acquisition starts during take-off (ground speed >25 m s−1) and stops after landing (ground speed <25 m s−1). Using ‘Landing gear up and locked’ and ‘Engine 2 oil pressure’ analogue aircraft signals, the BCP is started about 1 min after take-off and stopped when landing gear is descended prior to landing. BCP data are recorded via a CPU serial port RS232 and are stored every 4 s. H2O sensor measurements (Rosemount RH and Air Temperature) are analogue voltages stored every 4 s.
3.5.1. Data transmission
Concerning the data transmission, when the aircraft is on ground and uses ‘Weight on wheels’ and when the Forward cargo door opened’, the aircraft analogue signals the Global System for Mobile (GSM) and the Package1 flight data (about 1 Mb for each flight) are transmitted via General Packet Radio Service (GPRS) to the CNRS receiver station. It can take several minutes depending on the airport network quality. When the Package2 is installed (only on Lufthansa aircraft for now), Package2 data are sent first to the Package1 via an Ethernet connection and then transmitted. Due to the possible short duration of the cargo door opening or possible bad GSM network quality, the data transmission is not successfully achieved after each flight (estimation of 30–40% up to now). An evolution of the Package1 is planned for 2015 with a 3G modem, which will ensure a much better transmission rate.
3.5.2. Maintenance
Since commercial aircraft have to spend a maximum of time in flight, maintenance actions are constrained by scheduled layovers. Maintenance optimisation is an important part of the IAGOS team task and success. The Package1 and the pump box have planend to operate 6 months on-board. This period can be either reduced if a failure occurs in the instrument or can be extended up to 12 months if the instrument works perfectly or if no spare parts are available. To receive a release to service certificate (EASA Form 1), all maintenance tasks must be performed and documented in compliance with predefined procedures set out in the contract between CNRS and the Maintenance Organization responsible for continuous equipment airworthiness. In addition to the Component Maintenance Manual (CMM), which describes all maintenance actions and planning, specific maintenance actions can be performed in case of failure or malfunctioning of any components.
Before going back to operation, the Package1 and pump box are compared in Laboratory with a complete MOZAIC system used as the reference. This MOZAIC rack we use (see photo in ) has been removed from aircraft and remounted in laboratory. O3 and CO comparisons are done during several days before IAGOS instruments are released to service.
4. Data quality control for O3 and CO
Started in 2011 and planned to operate for decades, the IAGOS programme as a direct continuation of the MOZAIC programme provides high-quality atmospheric data measured aboard commercial Airbus aircraft. The IAGOS instruments for O3 and CO measurements have been realised with the same technology as MOZAIC and special cares are given to ensure the same data quality control.
4.1. Functional parameters check and flight data visualisation
First, all Package1 and pump box functional parameters (see ) are recorded during flights. These are sent along with O3 and CO raw data to the CNRS receiver station after each flight. Then, the data files are automatically scanned by the reception software and a technical report file is generated. The latter summarises instrument status during flight and provides a list of errors if parameters were not in the expected ranges (e.g. if internal pump air flow is below 4 L min−1, O3 cells flow, CO signal noise, etc.). It is very important to make sure that the instruments are working properly to guarantee the same performances as MOZAIC (see summary in ) and to anticipate any maintenance.
Table 4. Measured parameters stored during flights by the Package1
Table 5. Summary of the IAGOS O3 and CO instrument characteristics
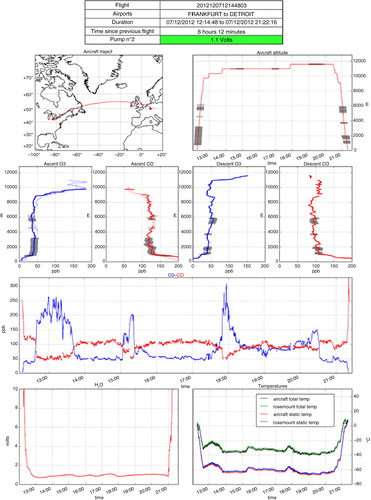
For each flight, a quick-look is automatically generated to visualise the flight data. An example is shown in . These quick-look pictures display the raw data (without any filters or corrections) to immediately identify any dysfunctioning that directly impact the O3 and CO measurements. As a critical parameter, the internal pump flow (here in Volts) is shown in green for good functioning and in red if the flow is insufficient. Rosemount humidity (here also in Volts and it will calculated later by the FZJ) and temperature measurements are also checked along with the independent aircraft temperature sensor. On ascent profiles, the flight data are shown along with the profiles of the previous flight if it landed maximum 8 h before. The latter gives an idea upon the measurements quality consistency. The quick-look is always sent to the PIs and co-PIs to continuously verify the good functioning of the measurements on a daily basis. It allows to rapidly note any failure and to provide to the airline technical staff the necessary fixing instruction (e.g. system check, instrument replacement). Here, we insist on the fact that the IAGOS team succeed in establishing an efficient communication network between the scientists team and the airlines. Indeed, as MOZAIC over 20 yr, the IAGOS system installation has never caused any delays in the flight schedules.
Fig. 7 Quick-look example. On top, flight information and external pump flow check (here displayed in Volts). Graphs of the flight route, flight altitudes, O3 and CO vertical profiles and time series with clouds detected by the BCP shaded in grey. On the profiles, the thin dash lines represent the profile of the previous flight. On bottom, time series of H2O sensor voltage, and the total and static temperatures measured by the aircraft and by H2O sensor in its Rosemount housing (raw data not calibrated).
4.2. Data validation
The data validation by the PI (Philippe Nedelec, CNRS Laboratoire d'Aérologie) represents the pass from the L0 raw data to the L1 validated final data (the data processing is fully described in a IAGOS overview paper, Petzold et al., 2015). At the beginning of the IAGOS programme and regarding the large number of data received every day, several attempts were done to automatically filter data points resulting from instrument failures or not resulting from a natural physical processes outside the aircraft. Fully automatic data processing actually reveal to be too complex and almost impossible to achieve efficiently. This is mainly due to the large diversity of issues that can occur to the measurement chain, from sampling inlets to the data reception at CNRS, and the lack of experience on long-term operation with the IAGOS system. Actually, automatic data processing (filtering noisy data) has resulted in losing valid and interesting data. Therefore, it was chosen to manually valid each flight because of our concern in providing users with the best quality data and not losing any data with possible valuable scientific interest. For that, a dedicated graphical–user interface software has been developed to archive the data according to their level of validation and to easily visualise any system parameter either from the flight itself or from the whole package operation period (6 months time series). The latter allow some actions to correct or remove data that are not valid.
4.3. Flight intercomparisons
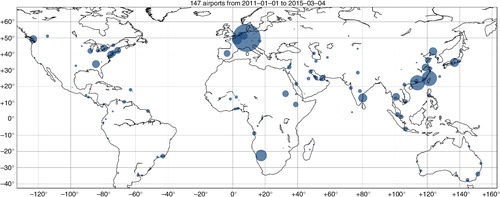
IAGOS is currently mounted on six aircraft flying about two or four times a day worldwide. shows a world map with all the airports that have been visited at least one time by a MOZAIC/IAGOS aircraft. Since the beginning of IAGOS, in July 2011, 147 airports have seen a MOZAIC/IAGOS aircraft land and take-off, sometimes several times a day. It has frequently happened that several of the MOZAIC and IAGOS aircraft have land or take-off at the same airport within a time window narrow enough to perform relevant instrument intercomparisons. These flight intercomparisons are automatically generated within the database as soon as at least two flights landed or took off at the same airport in <3 h and are particularly useful to detect any drifts in an instrument functioning. It is also a good way to compare the MOZAIC system performances to the IAGOS system for O3 and CO measurements during operation.
Fig. 8 The combined MOZAIC and IAGOS fleet have landed in more than 147 different airports around the world since July 2011. Symbol sizes are proportional to the total number of landings and takeoffs for a location. Monthly map of flights are available on the IAGOS website (www.iagos.fr/web).
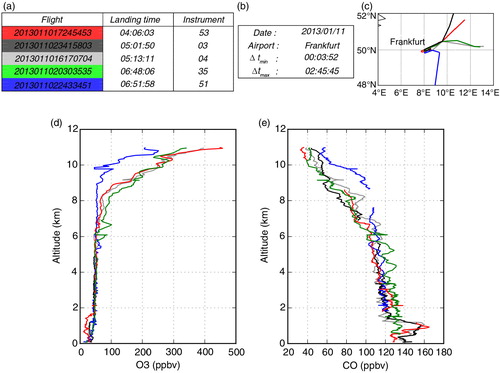
shows a flight profile intercomparison over Franckfurt on January 10, 2013. Since July 2011, 988 profile intercomparisons are currently available in the database but the example presented in this study was chosen because three different MOZAIC systems are compared with two different IAGOS systems. It also represent data that have been validated by the PI. The intercomparison figures always display tables summarising the flight schedules (see a and b). The flights are always named with the departure time and with the last two digits being the instrument number. Here, 53, 35 and 51 are the MOZAIC instruments and 03 and 04 are the IAGOS instruments. Also, b shows the minimum and maximum landing time difference between flights, and c shows the flight descent approach routes to the airport. As it can be seen in d and e, O3 and CO concentration profiles show very similar values in the lower free troposphere between about 2 and 6 km. It should be noted that measurement uncertainties (see ) were not added to the plot for more clarity. Below 2 km, in the planetary boundary layer (PBL), mixing processes and local pollution impact the profiles greatly and make instrument comparisons less straightforward. It is well emphasised in . The aircraft with the instrument 53, 03 and 04 landed the earliest at night when urban nitrogen oxide concentrations build up into the PBL and cause the O3 destruction. Peaks of pollutions are well shown on CO concentrations (see red, black and grey curves). These peaks are not seen on the two last profiles (green and blue curves). Indeed, the aircraft mounted with the instrument 35 landed 1 h 35 min after the aircraft with the instrument 04 and the wind direction changed by 30° at about 1000 m. The aircraft with the instrument 51 landed 7 min after 35 and approached the airport from the south. It may explain why the influence of Franckfurt plumes is less seen on the two profiles. Upper in the troposphere, above 6 km, instrument 51 shows more CO and less O3 compared with the other instruments. It can be explained regarding the aircraft routes in c, the stratospheric influence being more important in the north.
Fig. 9 Examples of flight profile intercomparison automatically made available within the IAGOS database as soon as at least two flights land or take-off within a 3-h time window at the same airport. 53, 35 and 51 are the MOZAIC instruments, and 03 and 04 are the IAGOS instruments. Colours found in the profile plots correspond to the flight in the table on top. (a) Flight landing times at Frankfurt, (b) quick information, (c) routes around Frankfurt, (d) O3 profile and (e) CO profile.
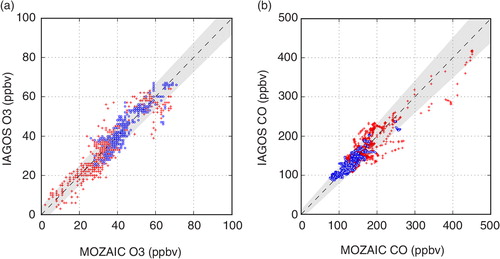
compiles all available profile intercomparisons between the MOZAIC and IAGOS systems between July 2011 and December 2012. Measurements made after have not been validated yet. It represents scatter plots of 32 and 55 intercomparisons with only PI validated data (L1) for O3 and CO measurements, respectively. Dashed line is the 1:1 line and shaded area represents the total uncertainties for both MOZAIC and IAGOS instruments (see ). Most of the data points are within uncertainty (93% for O3 and 81% for CO) and most of the dispersion is due to high CO values and low O3 values confined in the layer below 1000 m, where local source of pollution can vary greatly in space and time with CO emissions and the O3 destruction. For altitudes >1000 m, the root mean square deviations between the MOZAIC and the IAGOS measurements are 4 and 12 ppb for O3 and CO, respectively. Taking in accountthe comments made for about natural variability close to the surface and the upper part of the atmosphere, it can be concluded that the performances of the IAGOS instruments compared with the MOZAIC instruments are excellent.
Fig. 10 Flight intercomparison scatterplots between the MOZAIC and the IAGOS instruments for O3 and CO concentrations measured during ascent and descent profiles. Scatterplots compile 32 and 55 validated (L1) intercomparison profiles, respectively, for (a) O3 and (b) CO recorded between July 2011 and December 2012. Dashed line is the 1:1 line and the grey shading represents the total instrument uncertainties. Red crosses and blue dots are the data measured below and above 1000 m, respectively.
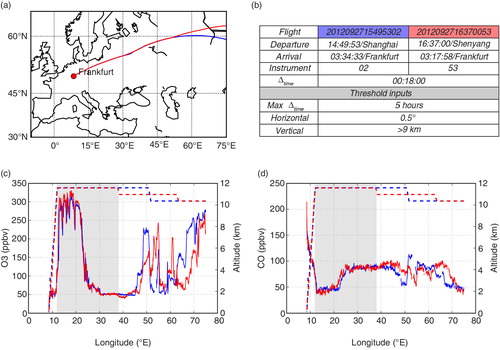
In the near future, we expect to do the same data analysis for flight intercomparisons for cruising altitudes. For the moment, only 134 intercomparisons have been identified in total, including non-validated data and not enough cases comparing the MOZAIC and the IAGOS systems to be statistically significant. However, an individual example is shown in . The latter presents a flight intercomparison between two aircraft following the same route (between 38°E and 12°E) with only an 18-min time difference and during more than 2 h at the same altitude. 53 is the MOZAIC instrument and 02 is the IAGOS instrument. O3 and CO measurements are presented in c and d along with longitudes. As it can be noted, excellent comparisons are made between the historical MOZAIC system and the new IAGOS system as soon as the two aircraft flew at the same altitude.
Fig. 11 Example of flight intercomparison at cruising altitudes (>9 km). Plots are automatically made available within the IAGOS database as soon as at least two flights shared the same route distant by <0.5° of latitude/longitude and within in a 5-h time window. (a) Flight routes, (b) flight intercomparison summary table, (c) O3 and cruising altitude and (d) CO and cruising altitude.
5. Conclusions and perspectives
Routine aircraft observations have provided invaluable information about atmospheric composition and large-scale transport for a long time, helping to improve our understanding of global and regional air quality as well as the potential impact of greenhouse gases on climate change. Important results using MOZAIC and CARIBIC observations of O3, water vapour, NOy and CO, looking at their global distributions and trends, have been published. Several of these studies contributed to the recent Task Force on Hemispheric Transport of Air Pollution (TF HTAP, 2010) and the Intergovernmental Panel on Climate Change (IPCC, 2014) report.
Such O3–CO combined instrument allows IAGOS to keep its statute of unique programme in the world providing the longest time series of O3 (and CO) uninterrupted since 1994 (2001). This is of particular value to assess O3 and CO trends in complement to other networks for reactive gases as reported in a recent GAW paper (Schultz et al., Citationin press). Delivering measurements in near real-time and possibly real-time is also of particular interest for the Copernicus Atmosphere Monitoring Service (CAMS). IAGOS is the only programme for in situ data at global scale in the troposphere and the UTLS (see the use of IAGOS O3 and CO data in this context; www.iagos.fr/macc). The Global Monitoring for Environment and Security (GMES) and the Monitoring Atmospheric Composition and Climate projects have made routine uses of MOZAIC–IAGOS data (Elguindi et al., Citation2010; Ordónez et al., Citation2010; Gaudel et al., Citation2015), which have been particularly useful for independent validation of the products developed in the projects. Their potential for use in data assimilation (either as an ‘anchor’ for bias-correction schemes or in ‘active’ assimilation) has also been explored. The future deployment of a larger fleet (20 aircraft in 2020) of IAGOS-equipped aircraft measuring a wider variety of atmospheric constituents is a very important perspective for CAMS. The near real-time processing and data transmission capabilities of IAGOS will also make it possible to include the corresponding data stream into operational processing, similar to the aircraft meteorological data relay that is used for numerical weather prediction.
Continued IAGOS operation has been assured through sustainable funding in the framework of international observing strategies such as Global Earth Observation System of Systems and its European component Copernicus, as well as from national funding institutions. IAGOS builds on previous European initiatives using novel technological developments and there is a strong emphasis on expanding the network to cover the Pacific, North America and further into the Southern Hemisphere. Its success relies heavily on the willingness of airlines to support operations.
6. Acknowledgements
IAGOS gratefully acknowledges financial support during its preparation, implementation and operation phase from the European Commission in FP6 and FP7 programmes, the IAGOS for the GMES Atmospheric Service national (IGAS), research programmes in Germany (BMBF), France (INSU-CNRS, MESR, CNES) and the UK (NERC), in addition to institutional resources in Germany (Helmholtz Association, Max-Planck-Society, Leibniz Association), France (Université de Toulouse, Météo-France) and the UK (University of Manchester, University of Cambridge) and the continuing support of participating airlines (Lufthansa, Air France, Iberia in Europe, China Airlines and Cathay Pacific in Asia). IAGOS emphasise the excellence of the industrial partners involved in the technical development and realisation: Sabena Technics Bordeaux for aircraft systems definition and certification, LGM Ingénierie for the instruments realisation and aeronautic qualification and enviscope GmbH Frankfort for operating the maintenance centre of IAGOS.
References
- Beswick K. , Baumgardner D. , Gallagher M. , Volz-Thomas A. , Nedelec P. , co-authors . The backscatter cloud probe: a compact low-profile autonomous optical spectrometer. Atmos. Meas. Tech. 2014; 7(5): 1443–1457.
- Brenninkmeijer C. A. M. , Crutzen P. , Boumard F. , Dauer T. , Dix B. , co-authors . Civil aircraft for the regular investigation of the atmosphere based on an instrumented container: the new CARIBIC system. Atmos. Chem. Phys. 2007; 7(18): 4953–4976.
- Brunner D. , Staehelin J. , Jeker D. , Wemli H. , Schumann U . Nitrogen oxides and ozone in the tropopause region of the Northern Hemisphere Measurements from commercial aircraft in 1995/96 and 1997. J. Geophys. Res. 2001; 106: 27673–27699.
- Elguindi N. , Clark H. , Ordóñez C. , Thouret V. , Flemming J. , co-authors . Current status of the ability of the GEMS/MACC models to reproduce the tropospheric CO vertical distribution as measured by MOZAIC. Geosci. Model Dev. 2010; 3(2): 501–518.
- Falconer P. D. , Pratt R. W . A summary of research on the NASA-Global Atmospheric sampling program performed by the atmospheric sciences research center. 1979. NASA CR-159614, Lewis Research Center, Cleveland, Ohio..
- Gaudel A. , Clark H. , Thouret V. , Jones L. , Inness A . On the use of MOZAIC–IAGOS data to assess the ability of the MACC reanalysis to reproduce the distribution of O3 and CO in the UTLS. TellusB. 2015
- Helten M. , Smit H. G. J. , Sträter W. , Kley D. , Nedelec P. , co-authors . Calibration and performance of automatic compact instrumentation for the measurement of relative humidity from passenger aircraft. J. Geophys. Res. 1998; 103(D19): 25643–25652.
- Machida T. , Matsueda H. , Sawa Y. , Nakagawa Y. , Hirotani K. , co-authors . Worldwide measurements of atmospheric CO2 and other trace gas species using commercial airlines. Env. Sci. Technol. 2008; 25(10): 1744–1754.
- Marenco A. , Thouret V. , Nédélec P. , Smit H. , Helten M. , co-authors . Measurement of ozone and water vapor by airbus in-service aircraft: The MOZAIC airborne program, an overview. J. Geophys. Res. 1998; 103: 25631–25642.
- Nédélec P. , Cammas J.-P. , Thouret V. , Athier G. , Cousin J-M. , co-authors . An improved infrared carbon monoxide analyser for routine measurements aboard commercial Airbus aircraft: technical validation and first scientific results of the MOZAIC III programme. Atmos. Chem. Phys. 2003; 3: 1551–1564.
- Nédélec P. , Thouret V. , Brioude J. , Sauvage B. , Cammas J.-P. , co-authors . Extreme CO concentrations in the upper troposphere over North-East Asia in June 2003 from the in-situ MOZAIC aircraft data. Geophys. Res. Lett. 2005; 32: L14807.
- Neis P. , Smit H. G. J. , Krämer M. , Spelten N. , Petzold A . Evaluation of the MOZAIC capacitive hygrometer during the airborne field study CIRRUS-III. Atmos. Meas. Tech. Discuss. 2014; 7(9): 9803–9838.
- Ordónez C. , Elguindi N. , Stein O. , Huijnen V. , Flemming J. , co-authors . Global model simulations of air pollution during the 2003 European heat wave. Atmos. Chem. Phys. 2010; 10(2): 789–815.
- Petzold A . 2015
- Schultz M.G. , Akimoto H. , Bottenheim J. , Buchmann B. , Galbally I . The Global Atmosphere Watch reactive gases measurement network. Elem. Sci. Anth. in press
- Stohl A. , Forster C. , Eckhardt S. , Spichtinger N. , Huntrieser H . A backward modeling study of intercontinental pollution transport using aircraft measurements. J. Geophys. Res. 2003; 108 4370.
- Thouret V. , Marenco A. , Logan J. A. , Nédélec P. , Grouhel C . Comparisons of ozone measurements from the MOZAIC airborne program and the ozone sounding network at eight locations. J. Geophys. Res. 1998a; 103: 25695–25720.
- Thouret V. , Marenco A. , Nédélec P. , Grouhel C . Ozone climatologies at 9–12 km altitude as seen by the MOZAIC airborne program between September 1994 and August 1996. J. Geophys. Res. 1998b; 103: 25653–25679.