
Abstract
In continuation of previous research for evaluation of the high ozone levels observed during summer time over the eastern Mediterranean, MOZAIC profiles collected at the airport of Cairo from 1994 to 2008 are analysed. Average profiles corresponding, respectively, to the highest and the lowest ozone mixing ratios for the 0–1.5 km layer over Cairo in summer (JJA) (94 profiles) are examined along with their corresponding composite maps of geopotential height (and anomalies), vertical velocity (and anomalies), specific humidity anomalies, precipitable water anomalies, air temperature anomalies and wind speed at 850 hPa. In addition, backward trajectories arriving in the boundary layer over Cairo during the days with highest or lowest ozone mixing ratios are examined. During the 7% highest ozone days at the 0–1500 m layer over Cairo, very high ozone concentrations of about 80 ppb on average are observed from the surface up to 4–5 km altitude. The difference in ozone concentrations between the 7% highest and the 7% lowest ozone days reaches maximum values around 60 ppb close to the ground. During the highest ozone days for both 1.5–5 and 0–1.5 km layer, there are extended regions of strong subsidence in the eastern Mediterranean but also in eastern and northern Europe and over these regions the atmosphere is dryer than average. In addition, characteristic profiles with the highest ozone concentrations in the 0–1500 m layer are examined in order to assess the influence of atmospheric transport and photochemistry on the ozone concentrations over the area.
1. Introduction
The high summertime ozone levels over the Mediterranean basin and especially in its eastern part have been the subject of many field studies on air pollution in the area (e.g. Varotsos et al., Citation1993; Kalabokas et al., Citation2000; Kourtidis et al., Citation2002; Kouvarakis et al., Citation2002; Lelieveld et al., Citation2002; Zerefos et al., Citation2002; Roelofs et al., Citation2003; Kalabokas and Repapis, Citation2004), as the frequent exceedance of the 60 ppb EU ozone standard for human health protection in the area is a serious problem regarding health and environmental policy. Among all the recorded profiles in mid-latitudes, the MOZAIC (Marenco et al., Citation1998) database has revealed that this region is noteworthy by presenting differences up to 20 ppb between spring and summer seasonal profiles throughout the free troposphere, while such differences were not observed in other examined regions worldwide (Zbinden et al., Citation2013).
The atmospheric circulation and weather conditions over the eastern Mediterranean during summer are influenced by the northwestern African anticyclone extending northeastwards over central Europe and by high-pressure systems over the Balkans on the one hand and by the Middle East–Iraq–Persian low-pressure trough on the other hand (see e.g. Metaxas, Citation1977; Prezerakos, Citation1984). The strong northwest–north to southeast–east pressure gradient leads to an almost steady northerly to northwesterly flow over the eastern Mediterranean during the summer season. The resulting flow over the Aegean Sea is most pronounced at the 850 hPa level, intensified by the channelling effect from the mountains of the Greek peninsula in the west and the Anatolian plateau in the east. In the north Aegean Sea, this flow appears as northeasterly, becomes northerly in the central Aegean and concludes as northwesterly in the Middle East and northerly towards the African Sahel monsoon (Lelieveld et al., Citation2002; Raicich et al., Citation2003). This persistent annually recurrent northerly winds in the Aegean are what the ancient Greeks called ‘Etesian winds’ meaning annual winds (Repapis et al., Citation1977). The synoptic scale variability of this flow is attributed to the variability of the high pressure over the Western Mediterranean and central Europe and the variability of the low-pressure centre of the Iraq–Persian trough and the thermal low over the Anatolian plateau. Modelling studies of the large-scale dynamics also suggest a strong influence of the Indian Monsoon on the dry Mediterranean climate in summer, that is, by westward Rossby waves, excited by the monsoon convection, interacted with the southern flank of the mid-latitude westerlies producing adiabatic descent and hence anticyclonic conditions at the surface over the eastern Mediterranean. Therefore, the low frequency variability of this flow is controlled by the South Asian monsoon (Rodwell and Hoskins, Citation1996, Citation2001; Lelieveld et al., Citation2002; Ziv et al., Citation2004; Richards et al., Citation2013; Tyrlis and Lelieveld, Citation2013; Tyrlis et al., Citation2013; Doche et al., Citation2014; Zanis et al., Citation2014). As a result, the eastern Mediterranean is influenced by advection from Europe in the lower troposphere, associated with the Etesian winds and subsidence in the middle and upper troposphere, which is in turn associated with the westerly flow interacting with the South Asian monsoon.
In addition, the possibility of an influence of long-range transport from Europe, North America and Southeast Asia on ozone and its precursors over the eastern Mediterranean troposphere was discussed (Van Aalst et al., Citation1996; Volz-Thomas et al., Citation2003) and studied in more detail during two intensive measuring campaigns (MINOS and PAUR) over the Aegean (e.g. Kourtidis et al., Citation2002; Kouvarakis et al., Citation2002; Lelieveld et al., Citation2002; Zerefos et al., Citation2002; Gros et al., Citation2003; Roelofs et al., Citation2003; Scheeren et al., Citation2003; Traub et al., Citation2003). The results of these campaigns showed high summertime surface ozone levels over the Aegean, attributed primarily to the long-range transport and photochemical production in the boundary layer.
In order to address the above issues, vertical ozone profiles measured in the framework of the MOZAIC (Measurement of Ozone and Water Vapor by Airbus in Service Aircraft) project (Marenco et al., Citation1998) regarding flights connecting central Europe to the eastern Mediterranean basin (Heraklion, Rhodes, Antalya) have been analysed (Kalabokas et al., Citation2007). The 77 flights during summer (JJA) showed over the eastern Mediterranean significantly (10–12 ppb, 20–40%) enhanced ozone mixing ratios in the lower troposphere and especially at the 1000–700 hPa layer, where ozone frequently exceeds the 60 ppb, the 8 h EU air quality standard for human health protection, whereas ozone between 700 and 400 hPa was only slightly (3–5 ppb, 5–10%) higher than over central Europe. Analysis of composite weather maps for the high and low ozone cases in the boundary layer, as well as back-trajectories and vertical profiles of carbon monoxide, suggest that the main factor leading to high tropospheric ozone values in the area is anticyclonic influences in combination with a persistent northerly flow in the lower troposphere and the boundary layer during summertime over the Aegean Sea. On the other hand, the lowest ozone levels are associated with the passing of low-pressure systems, or the extension to the west of the Middle Eastern low associated with weak pressure gradients over the eastern Mediterranean and an upper air trough in northeastern Europe. The same pattern of summer ozone variability has been observed by analysing the ozone measurements at several rural sites in the eastern and central Mediterranean (Kalabokas et al., Citation2008; Kleanthous et al., Citation2014), showing that the highest and lowest summer afternoon ozone levels are strongly associated with characteristic synoptic meteorological conditions prevailing throughout the lower troposphere.
The second phase of this work was the investigation of the meteorological and/or chemical factors controlling the lower troposphere ozone levels, above the boundary layer (1.5–5 km altitude) over the eastern Mediterranean (Kalabokas et al., Citation2013). The area under study has been extended towards the Middle East region (Cairo, Tel-Aviv), where a significant number of MOZAIC vertical profiles have been recorded over the respective airports, during the period 1994–2008. The results show that the high observed differences in ozone concentrations between the 7% highest and the 7% lowest ozone levels in the lower troposphere over the eastern Mediterranean could be explained mainly through the transport processes and less through local or regional photochemistry. Based on the results of the FLEXPART backward trajectories of MOZAIC flights, it is observed that transport has a very strong subsidence component in the lower troposphere over the eastern Mediterranean area. During the highest ozone days, the composite weather maps of geopotential height at 850 hPa showed an extended anticyclone over central and western Europe, while during the lowest ozone days the African anticyclone is very restricted and an extended low-pressure system prevails over northern Europe, which is almost connected to the Middle East low or the western edge of the Indian Monsoon. It is interesting to observe that during the highest ozone days in the eastern Mediterranean a deepening of the Middle East low and a simultaneous strengthening of the African–European anticyclone occur while eastern Europe and eastern Mediterranean are located at the interface of these two large synoptic meteorological systems (Kalabokas et al., Citation2013).
Based on the above reported results, it turns out that a key factor leading to high lower troposphere ozone values in the eastern Mediterranean is the strength and the extent of the anticyclonic activity in the area. Summer anticyclones, covering very large areas over North Africa, the Mediterranean basin and the European continent, are associated with the downward transport of upper troposphere ozone, especially at the interface of high- and low-pressure systems as it is also observed in Zanis et al. (Citation2014) and Tyrlis et al. (Citation2014). In addition, a frequent midsummer peak of troposphere ozone is observed over northern Europe and the Atlantic (Mantis et al., Citation1981; Thouret et al., Citation2006). Similar observations of high upper troposphere ozone levels during anticyclonic conditions have been reported in central Europe by analysing vertical MOZAIC profiles (Tressol et al., Citation2008) but also at rural sites in western, central and eastern Mediterranean following the analysis of surface ozone data (Kalabokas et al., Citation2008; Sánchez et al., Citation2008; Schürmann et al., Citation2009; Velchev et al., Citation2011). Especially as it regards the eastern Mediterranean region, atmospheric conditions of strong summer anticyclonic subsidence in the lower troposphere, leading to high ozone concentrations, have been reported as a result of analysis of satellite data as well as large-scale atmospheric modelling simulations, with which our observations are in agreement (Li et al., Citation2001; Eremenko et al., Citation2008; Foret et al., Citation2009; Liu et al., Citation2009; Coman et al., Citation2012; Richards et al., Citation2013; Doche et al., Citation2014; Safieddine et al., Citation2014; Zanis et al., Citation2014).
The present paper is a continuation of the research on eastern Mediterranean ozone based on the analysis of vertical profiles collected in MOZAIC. It is focused on the examination of the influence of the lower tropospheric ozone on the 0–1.5 km layer and consequently on surface ozone concentrations.
2. Data
Since 1994, five commercial airliners have been equipped within the framework of the MOZAIC programme (Marenco et al., Citation1998) with instruments to measure ozone, water vapour, and (since 2002) carbon monoxide. Measurements are taken from take-off to landing so that vertical profiles are obtained near airports, in addition to the measurements at cruising altitude. The ozone measurement is based on dual-beam UV absorption (Thermo-Electron, Model 49-103). The accuracy is estimated at ±[2 ppbv+2%] for a 4 s response time (Thouret et al., Citation1998). The carbon monoxide measurement is based on an infrared analyser. The accuracy is estimated at ±5 ppbv±5% for a 30 s response time (Nedelec et al., Citation2003).
The MOZAIC database (www.iagos.fr/web/) was screened for summer (JJA) flights at the airports of the eastern Mediterranean basin. In total, 94 summer profiles over Cairo (30.1°N, 31.2°E) were analysed. The flights cover the period 1994–2008 between June and August. Both ascent and descent data have been used.
For the determination of the air-mass origin, the Lagrangian particle dispersion model FLEXPART (version 6.2; Stohl et al., Citation1998, Citation2005) was used in backward mode. FLEXPART was driven by data from the European Center for Medium-Range Weather Forecasts (ECMWF) provided at 60 vertical levels and with a temporal resolution of 3 h (analysis at 00:00, 06:00, 12:00, 18:00 UTC; 3 h forecasts at 03:00, 09:00, 15:00, 21:00 UTC). Horizontal resolution was globally 1°×1°. The model was initialised by release of 20 000 particles from grid boxes of 0.5°×0.5° horizontally and 100 m vertically centred on the MOZAIC profiles.
3. Results and discussion
3.1. Highest and lowest ozone days at the 1.5–5 km layer over Cairo
As it was reported in Kalabokas et al. (Citation2013), between the 7% highest and the 7% lowest ozone days at 1.5–5 km over Cairo and Tel-Aviv, there is a significant difference in atmospheric conditions as described in the composite meteorological maps of geopotential heights at 850 hPa. Also, a clear anti-correlation between ozone and relative humidity in the lower troposphere was observed, which seemed to be a common feature over the eastern Mediterranean area, indicating that atmospheric humidity could be used to a certain extent as a tracer of tropospheric ozone variability. Backward trajectories showed distinct differences in the patterns of the vertical atmospheric transport between the highest and the lowest ozone days.
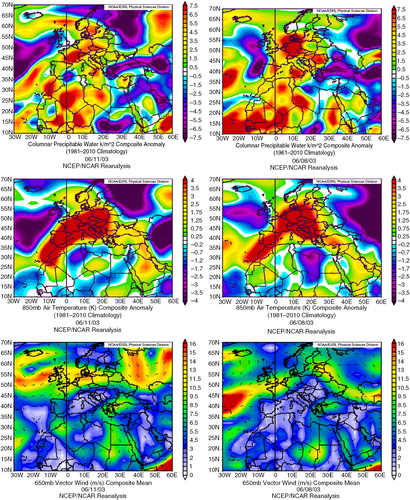
In order to investigate the above aspects in more detail, and display composite reanalysis maps covering Europe and North Africa of several meteorological parameters corresponding to the days with the highest () and lowest () ozone concentrations observed at the 1.5–5 km level over Cairo. The maps were constructed from NCEP/NCAR reanalysis on a 2.5°×2.5° grid at 700 hPa for the days of the ozone measurements and the preceding 3 d following the procedure of Kalnay et al. (Citation1996). They include the following meteorological parameters: geopotential height, geopotential height anomaly, vertical velocity omega, vertical velocity omega anomaly, specific humidity anomaly, precipitable water anomaly, air temperature anomaly and vector wind. The anomalies are calculated as differences to the climatological mean 1981–2010.
Fig. 1 Composite weather maps at 700 hPa of geopotential height, geopotential height anomaly, vertical velocity (omega), vertical velocity anomaly, specific humidity anomaly, precipitable water anomaly (columnar), air temperature anomaly and vector wind of the 7% of the days with the highest vertical summer ozone concentrations at the 1.5–5 km layer over Cairo during the day of the measurement (left column) and 3-d ago (right column).
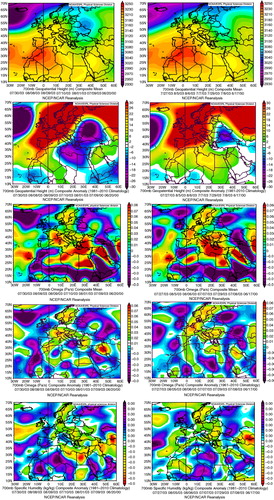
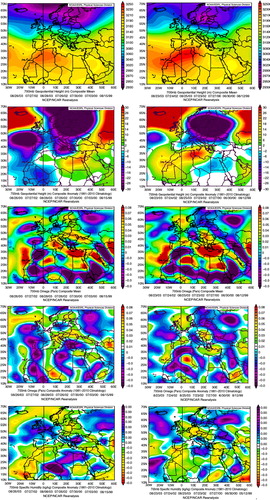
Fig. 2 Composite weather maps at 700 hPa of geopotential height, geopotential height anomaly, vertical velocity (omega), vertical velocity anomaly, specific humidity anomaly, precipitable water anomaly (columnar), air temperature anomaly and vector wind of the 7% of the days with the lowest vertical summer ozone concentrations at the 1.5–5 km layer over Cairo during the day of the measurement (left column) and 3-d ago (right column).
As exhibited by the geopotential heights in , the North African anticyclone is extended towards Western Europe over several days before the measurement, while low pressure is developing over eastern Europe, similar to what has been observed for the 850 hPa level (Kalabokas et al., Citation2013). Also, extended positive anomalies in vertical velocity (subsidence) and negative anomalies in specific humidity and precipitable water (dry air) are observed at 700 hPa. In addition, there is an extended region of low-temperature anomalies from eastern Europe to western Africa at these levels. If examined in more geographical detail, the specific humidity shows a significant negative anomaly over a large geographical area covering Scandinavia, central and eastern Europe, the Balkans, Turkey and Egypt, where at the same time subsidence is observed.
On the other hand, for the lowest ozone days in the lower troposphere at the 1.5–5 km layer over Cairo as also reported in Kalabokas et al. (Citation2013) the composite charts of the presented meteorological parameters show a different picture (). According to the geopotential heights at 700 hPa, the North African anticyclone is much weaker and restricted if compared to the highest ozone days, whereas an extended low-pressure system prevails over northern Europe. At the same time, extended negative anomalies in geopotential height and temperature are seen over central and northern Europe, maximised at the day of measurement. In addition, uplifting and positive anomalies in specific humidity at 700 hPa level and precipitable water (humid air) are observed over the Balkans, Aegean Sea, central Mediterranean and North Africa. There is still subsidence observed over the Mediterranean region, although less intense than during the highest ozone days. In comparison to the highest ozone days (), the air is generally warmer and more humid in the eastern Mediterranean. The most characteristic feature of the observed meteorological conditions during the lowest ozone days observed in the lower troposphere over the eastern Mediterranean is the very strong westerly flow over the Western Mediterranean, transporting air masses with low ozone concentrations from the Atlantic Ocean. In general, the low ozone days are characterised by a stronger zonal flow.
3.2. Highest and lowest ozone days at the 0–1.5 km layer over Cairo
The same analysis as above is shown for the highest and lowest ozone concentrations observed in the 0–1.5 km layer. In , average vertical profiles of ozone, relative humidity, CO and temperature over the eastern Mediterranean airport of Cairo for the 7% highest (red) and the 7% lowest (blue) ozone mixing ratios at the 0–1500 m layer in summer (JJA) are presented. The differences between highest and lowest ozone days are maximised close to the ground (50–60 ppb). The relative humidity close to the ground as well as above 2 km is lower during the highest ozone while the temperature is higher below 1 km. The CO levels during the highest ozone days are slightly higher than the average profile (below 2 km). It should be also mentioned that the wind speed below 1 km (not shown) is comparable for both situations.
Fig. 3 (a) Vertical profiles of ozone over the eastern Mediterranean airport of Cairo for the 7% highest (red) and the 7% lowest (blue) ozone mixing ratios at 0–1.5 km during summer (JJA); (b) same as (a) but for relative humidity; (c) same as (a) but for carbon monoxide (CO); (d) same as (a) but for temperature (CO measurements corresponding to low ozone are missing). The black line in (a–c) shows the mean profile of the respective parameter calculated from all available data during summer.
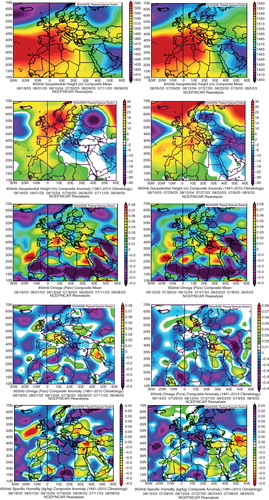
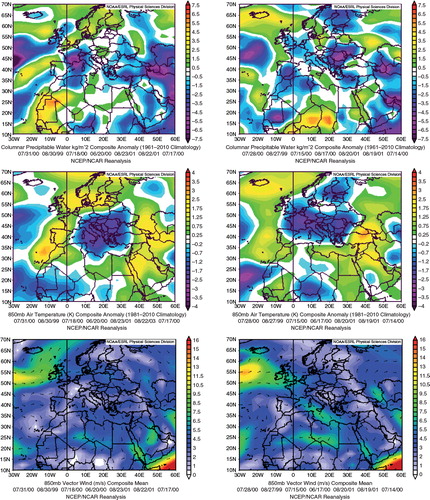
For detection of the influence of the tropospheric layers above 850 hPa on the 0–1.5 km layer, composite meteorological charts at 850 hPa of the highest ozone days at the 0–1.5 km layer are displayed in . Comparing and reveals that the meteorological characteristics (at 850 hPa) of the highest ozone days at the 0–1.5 km layer are quite comparable with the characteristics at 700 hPa of the highest ozone days at the 1.5–5 km layer (), and clear signs of subsidence are also observed. Combining the information presented in , especially the positive vertical velocity and the negative humidity anomalies, it could be suggested that the lower troposphere influences significantly the 0–1.5 km layer and consequently the boundary layer as well as the surface ozone concentrations over the eastern Mediterranean. The clear characteristics of subsidence from the upper layers () are very similar to the corresponding observations in with one slight difference: the signs of subsidence (positive omega, dry air) are shifted somewhat towards the east. This is in agreement with the observations made by Zanis et al. (Citation2014) and Tyrlis et al. (Citation2014) that the southeastward shift from the upper to lower levels might be related to nearly isentropic sloping and downwelling of the air masses towards southeast. In addition, strong northern flow over the eastern Mediterranean is observed at 850 hPa, especially on the days preceding the measurement, which, as mentioned before, is very frequently observed in the area during summertime (Repapis et al., Citation1977).
Fig. 4 Composite weather maps at 850 hPa of geopotential height, geopotential height anomaly, vertical velocity (omega), vertical velocity anomaly, specific humidity anomaly, precipitable water anomaly (columnar), air temperature anomaly and vector wind of the 7% of the days with the highest ozone concentrations at the 0–1.5 km layer over Cairo during the day of the measurement (left column) and 3-d ago (right column).
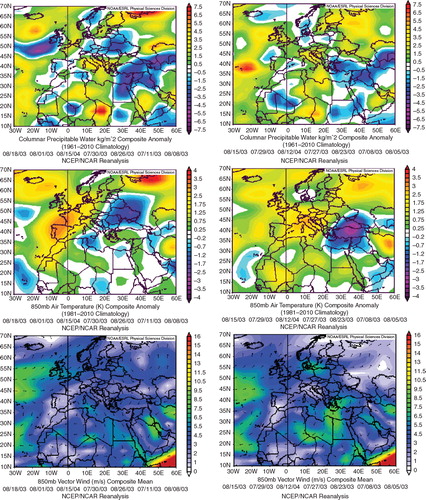
The meteorological characteristics calculated at the 850 hPa level for the lowest ozone days observed in the 0–1500 m layer () are also very comparable to the corresponding characteristics at 700 hPa for the lowest ozone days of the 1.5–5 km layer (). There are extended geopotential height negative anomalies all over Europe the days preceding the measurement, the vertical velocity is weaker and negative omega anomalies are observed while the most important meteorological characteristics of this group of days is a strong northwesterly flow over the Mediterranean, especially during the days before the measurement (), similar to what was observed in the lower troposphere (). The persistent northwesterly flow during the days before the measurement transports ozone-poor air masses originating from the region of the North Atlantic to the Mediterranean basin.
Fig. 5 Composite weather maps of geopotential height, geopotential height anomaly, vertical velocity (omega), vertical velocity anomaly, specific humidity anomaly, precipitable water anomaly, air temperature anomaly and vector wind at 850 hPa of the 7% of the days with the lowest ozone concentrations at the 0–1.5 m layer over Cairo during the day of the measurement (left column) and 3-d ago (right column).
In , the average contribution of each atmospheric layer to the air arriving over Cairo in the 0–1.5 km layer (1000–850 hPa) on the 7% highest ozone days and on the 7% lowest ozone days is presented based on 3 d backward simulations with FLEXPART. The 850–700 hPa (1.5–3 km) layer is the major contributor to the 0–1.5 km layer, 69% for the highest and 48% for the lowest ozone days, respectively. There is also a substantial contribution from the 700–500 hPa (3–5 km) layer (26 and 30% for the highest and the lowest ozone days, respectively), which shows in fact that the subsidence phenomenon is a general characteristic over the region and occurs under different synoptic meteorological regimes, although it is clearly more enhanced during the days with the highest ozone concentrations. For the days with lowest ozone, the 1000–850 hPa (0–1.5 km) layer itself has also an important contribution (20%). A crucial parameter to be kept in mind for the interpretation of the ozone variability is that during the lowest ozone days at 0–1.5 km, the ozone concentrations are lower by 50–60 ppb close to the ground surface but also remain lower by about 20 ppb at higher levels up to 4.5 km (). So, even if subsidence is observed during the lowest ozone days, although weaker than during the highest ones, the lower tropospheric ozone concentrations induce in the boundary and surface layer subsequently lower ozone concentrations.
Table 1. Average percentage contribution of each atmospheric layer to the air arriving over Cairo in the 0–1.5 km layer (1000–850 hPa) on the 7% highest ozone days (left column) and on the 7% lowest ozone days (right column), based on 3-d backward simulations with FLEXPART
3.3. Characteristic examples of very high ozone episodes at the 0–1.5 km layer over Cairo
In order to examine in more detail the atmospheric conditions associated with maximum ozone concentrations at the 0–1.5 km layer, three characteristic profiles from the highest ozone days have been selected for a more detailed examination. presents the average percentage contribution of each atmospheric layer to the air arriving over Cairo for the three selected high ozone profiles at the 0–1.5 km layer for 3-d FLEXPART backward simulations, together with the corresponding potential vorticity averages. As noticed, the three individual profiles from the highest ozone days have been selected for further examination due to their particular characteristics: (1) a profile with the highest contribution from the 700–500 hPa layer (11 July 2003) to the 1000–850 hPa layer, indicating strong and deep subsidence, (2) a profile with the highest contribution from the 850–700 hPa layer (11 June 2003), indicating weak and shallow subsidence and (3) the profile with the highest ozone concentrations observed in the boundary layer (18 August 2003).
Table 2. Average percentage contribution of each atmospheric layer to the air arriving over Cairo during three high ozone days at the 0–1.5 m layer over Cairo with strong subsidence (left column), weak subsidence (middle column) and the day of the highest observed ozone concentrations over Cairo (right column) for 3-day backward simulations with FLEXPART
The corresponding plots of the three above selected profiles are shown in . As observed, the ozone concentrations for the profile with strong and deep subsidence (11 July 2003) are by 10 ppb higher than for the profile with the weak and shallow subsidence (11 June 2003) up to the height of 2.5 km. The relative humidity pattern is very interesting as it shows higher values (40–50%) at the 1.5–4 km layer during the day with shallow subsidence (11 June 2003) and goes to almost zero values above 1 km during the strong and deep subsidence day (11 July 2003). The latter is a sign of important upper tropospheric influence as the strong subsidence suppresses the vertical transport of water vapour from the surface layer. The ozone concentrations for the deep subsidence profile remain almost constant at about 70–80 ppb up to 3 km despite the significant changes in relative humidity and carbon monoxide for altitudes below 1.5 km, which is an additional indication of the importance of transport for the observed variability in tropospheric ozone. It is also noticed that within the 0–1 km layer, the temperature is comparable for the two profiles but for the deeper subsidence profile the whole troposphere is warmer. No significant differences in wind speeds are observed (not shown). The vertical profile with the highest ozone at 0–1.5 km (18 August 2003) is more comparable to the strong subsidence profile as far as relative humidity and temperature is concerned. However, it shows substantially higher CO concentrations at the 1–2 km layer, which is a clear sign of local or regional pollution. In addition, an estimation of the atmospheric boundary layer (ABL) height for the presented case studies could be made from the temperature, the CO and the humidity profiles. For the case study of 11 July, it seems that the ABL height is around 1000–1200 m while for the case of 18 August seems to be close to 2000 m. In the case of 11 June, it seems that the ABL height is considerably higher reaching 3000 m.
Fig. 6 (a) Vertical profiles of ozone over the eastern Mediterranean airport of Cairo during a high ozone day at the 0–1.5 km layer over Cairo with strong subsidence (blue line – 11 July 2003), a day with weak subsidence (red line – 11 June 2003) and the day of the highest observed ozone concentrations over Cairo (brown line – 18 August 2003). (b) Same as (a) but for relative humidity; (c) same as (a) but for carbon monoxide (CO); (d) same as (a) but for temperature. The black line in (a–c) shows the mean profile of the respective parameter.
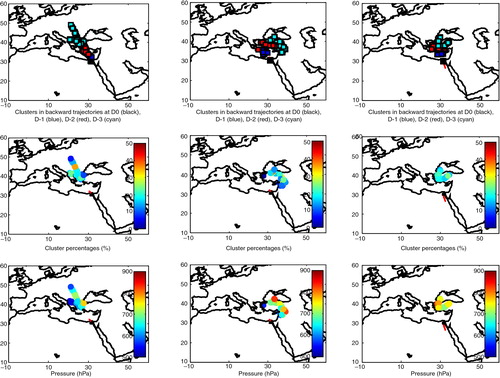
shows the backward integration in time, for 3 d and for the 0–1.5 km layer, for the three MOZAIC vertical profiles over Cairo presented in . The results are summarised on centroids of five clusters, which is the method to condense the large and complex FLEXPART output using a cluster analysis as further described by Stohl et al. (Citation2005). They include every 12 h latitude, longitude, pressure and percentage of representation (the fraction of particles belonging to the cluster). As observed in (left panel), the origin of the air masses arriving at the 0–1.5 km layer for the profile with high ozone concentrations and strong subsidence (11 July 2003), 3 d before the measurement, is from the Balkan region and from high altitudes (see also ). On the other hand, for the profile with the weaker subsidence (11 June 2003), the origin of air masses is from the central and eastern Turkey (, middle panel). Finally, for the profile with the highest ozone concentrations (18 August 2003) the air masses come mostly from western Turkey and the Aegean Sea (, right panel). Overall, the origin of air masses is from northerly directions for all examined profiles, while the air masses related to stronger subsidence originate from directions further to the west as well as higher altitudes.
Fig. 7 (Left panel) Backward integration in time for 3 d for the MOZAIC vertical profile measurements and for air masses arriving at 0–1.5 km over Cairo during a high ozone day with strong subsidence (11 July 2003). (Middle panel) Backward integration in time for 3 d for the MOZAIC vertical profile measurements and for air masses arriving at 0–1500 m over Cairo during a high ozone day with weak subsidence (11 June 2003). (Right panel) Backward integration in time for 3 d for the MOZAIC vertical profile measurements and for air masses arriving at 0–1.5 km over Cairo during the day with the highest ozone concentrations (18 August 2003). The results shown are for the 0–1.5 km layer. The results are summarised on centroids of five clusters, and include every 12 h latitude, longitude, pressure and percentage of representation. Top plots show the clusters positions at day 0 (black), day-1 (blue), day-2 (red) and day-3 (cyan). The middle plots show the percentages of clusters at day-3. Finally, the bottom plots show the pressure of the clusters at day-3. The red line is the aircraft trajectory during ascent/descent.
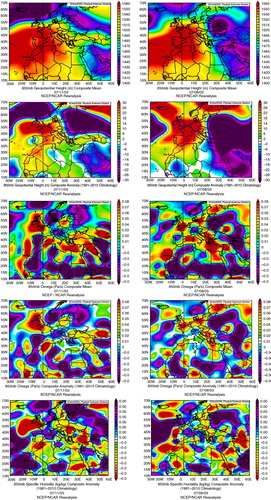
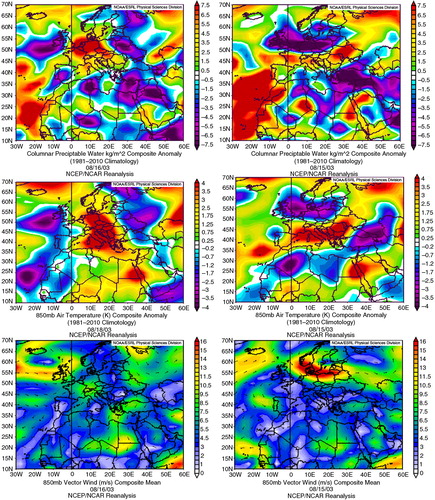
In , the NCEP/NCAR composite reanalysis charts describing the meteorological conditions for the day with strong and deep subsidence are presented (11 July 2003). The composite maps clearly show the characteristics of subsidence for all meteorological parameters, based on the argumentation used for and . All meteorological features related with subsidence, especially the positive anomalies in vertical velocity and the negative anomalies in specific humidity are much more enhanced, in comparison to the average values. Based on the vertical velocity anomalies, it seems that the strongest subsidence occurred 3-d earlier (8 July) over the eastern Mediterranean and these anomalies are shifted eastward on 11 July. It has to be noted that on 8 July together with the strongest subsidence the strongest Etesian winds are also observed ().
Fig. 8 Composite weather maps at 850 hPa of geopotential height, geopotential height anomaly, vertical velocity (omega), vertical velocity anomaly, specific humidity anomaly, precipitable water anomaly (columnar), air temperature anomaly and vector wind for a high ozone day at the 0–1.5 km layer over Cairo with strong subsidence (11 July 2003) during the day of the measurement (left column) and 3-d ago (right column).
In , the NCEP/NCAR composite meteorological charts describing the meteorological conditions for the day with weak subsidence are presented (11 June 2003). The main meteorological characteristics of that day are the very extended anticyclonic conditions associated with positive temperature anomalies showing that a very extended heat wave covers most of the European continent and the Mediterranean basin for several days. These meteorological conditions are associated with humid air and extended stagnant conditions (very low wind velocities) at 850 hPa, especially during the days before the measurement. Also, a southward shift of the subsidence area on 11 June with respect to 3 d earlier (8 June) is observed, thus resulting in a southward movement of positive omega anomalies over the Levantine region and Egypt.
Fig. 9 Composite weather maps at 850 hPa of geopotential height, geopotential height anomaly, vertical velocity (omega), vertical velocity anomaly, specific humidity anomaly, precipitable water anomaly (columnar), air temperature anomaly and vector wind for a high ozone day at the 0–1.5 km layer over Cairo with weak subsidence (11 June 2003) during the day of the measurement (left column) and 3-d ago (right column).
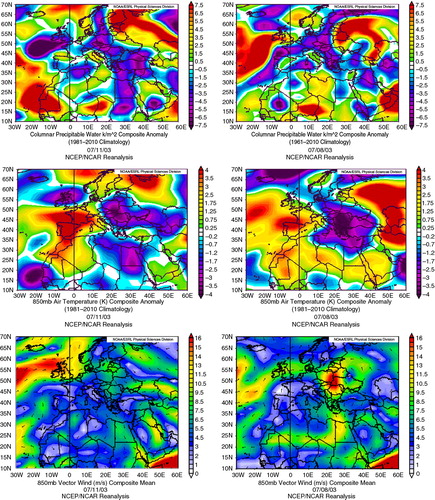
In , the meteorological conditions during the day with the highest ozone concentrations at the 0–1.5 km layer over Cairo are presented (18 August 2003). For that day, a rapid extension of the subtropical anticyclone towards central and eastern Europe took place, which leads to relatively strong subsidence over Egypt, the Aegean Sea, the Balkans and eastern Europe. Subsequently, dry air is observed over these regions. It is interesting to note that the heat wave over central Europe is not as extended as during the episode of 11 June 2003, while the strong northern flow of the Etesian winds in the eastern Mediterranean is well established, showing maximum values over the North African coast. In general, the highest ozone case (18 August) shows similarities with the weak subsidence case (11 June) during the day of measurement with the northerly winds extending southwards over Egypt, as observed in and . As further discussed below, deep tropospheric subsidence influences the highest ozone case (18 August) 4–6 d before the measurement.
Fig. 10 Composite weather maps at 850 hPa of geopotential height, geopotential height anomaly, vertical velocity (omega), vertical velocity anomaly, specific humidity anomaly, precipitable water anomaly (columnar), air temperature anomaly and vector wind at the 0–1.5 km layer over Cairo for the day with the highest ozone concentrations (18 August 2003) during the day of the measurement (left column) and 3-d ago (right column).
It could be argued that the meteorological conditions of the day of the highest ozone in the boundary layer over Cairo (18 August 2003) are sort of combination of the two episodes of the strong and deep tropospheric subsidence (11 July 2003) and of the weak subsidence associated with an extended heat wave (11 June 2003). As a result, at the 0–2 km layer extremely high ozone concentrations (about 90 ppb) with a uniform vertical distribution are recorded. The corresponding values for the shallow subsidence day at the 0–2 km layer is 60–70 ppb, and for the deep subsidence day 70–80 ppb (). It should be noted that due to the geographical location of the Cairo airport (NE of the city) in combination with the strong northerly flow, direct influence of the local urban emissions is not expected for the days investigated.
It is interesting to add that although for the highest ozone day (18 August 2003) there is an indication of shallow subsidence, the higher corresponding potential vorticity values () indicate upper tropospheric air masses transport and therefore deep subsidence occurring the days before, which is in fact in agreement with the corresponding composite charts, indicating deep tropospheric subsidence 3 d before the measurement (). It has to be added that the observed difference between the two patterns is maximised 4–6 d before the measurement, based on composite weather maps and back-trajectories (not shown).
It is worth comparing the patterns of these three cases with the characteristic three Etesian wind patterns discussed by Anagnostopoulou et al. (Citation2014) as the synoptic conditions corresponding to the highest ozone case () appear quite similar to one of the strong Etesian wind patterns presented (EP3).
It should also be added that a detailed examination of the composite weather maps for the tropospheric layers of 850 hPa as well as for the higher layers of 700 hPa and 500 hPa (not shown), during the day of observation but also during the days before the observation has been performed. It comes out that the characteristic synoptic weather patterns corresponding to highest and lowest ozone cases are for each group quite uniform throughout the lower troposphere, from the ground level to at least 5 km height (500 hPa) and can be detected for several days before the selected measurements. The same patterns are also observed over the other eastern Mediterranean airports where MOZAIC profiles are available, such as Tel-Aviv, Antalya, Heraklion and Rhodes (not shown).
According to the above observations, high levels of transported tropospheric ozone are accumulated on the top of the boundary layer during anticyclonic synoptic conditions in the eastern Mediterranean. Depending on the meteorological conditions, the time of the day and the particular geographical characteristics and topography of each site in the area, tropospheric air may enter the boundary layer, causing a sort of fumigation as far as ozone is concerned, and leading to high surface ozone levels, which might exceed the air quality standards. Under these conditions, the transport factor is predominant while the impact of the local ozone photochemical production is less significant in those cases. On the other hand, the regional photochemical ozone production could be important. Finally, the upper tropospheric ozone reservoir, which shows a summer maximum over Europe (Mantis et al., Citation1981; Thouret et al., Citation2006), should play a very determining role in the boundary layer and the surface ozone concentrations over the eastern Mediterranean.
Summarising all of the above and based on the analysis of the composite meteorological charts of the selected ozone episodes in the 0–1.5 km layer, the characteristics associated with important subsidence during summertime over the eastern Mediterranean, and subsequently high ozone concentrations close to the surface (due to the high tropospheric ozone levels occurring at the same time), are the following: At first, the geographic areas with observed deep tropospheric subsidence seem to be the transition regions between a high-pressure system (to the west and north–west sector) and a low-pressure system (to the east sector), as shown in the corresponding charts of the geopotential heights. Over these areas, positive and negative geopotential height anomalies are observed (to the west and east, respectively). At the same time, over these regions high vertical velocity values and low humidity values occur at the 850 and 700 hPa levels. In addition, over the areas of deep tropospheric subsidence, negative temperature anomalies are observed and also high wind speeds. The above mentioned characteristics are observed in and and and to a certain extent in . Following the above analysis, it could be stated that the use of the composite meteorological charts for the analysis of ozone episodes is an efficient tool, complementary to the analysis of back-trajectories.
The above used method of data analysis combining composite weather charts of many meteorological parameters, could be also very useful for the study of the tropospheric influence to the boundary layer and the ground surface, especially for tracing large-scale deep subsidence events (downward movements of generally dry air masses) when analysing surface measurements at sites where no vertical ozone measurements are available at the same time either in the Mediterranean basin or in other places in the world. For example, similar field observations on the influence of lower troposphere ozone to the boundary layer and surface measurements have been already reported at some locations of the Californian coast (Parrish et al., Citation2010).
There are important environmental policy issues arising from the presented results regarding ozone, which is a regulated pollutant by many environmental agencies over the world. The presented results show that during summertime in the eastern Mediterranean the boundary layer is influenced by the free troposphere to such an extent that the air quality standards might be exceeded even in the absence of local pollution. This phenomenon seems to be more closely related to transport linked to the synoptic meteorological conditions than to the emissions of air pollutants in the surrounding area followed by photochemical production, although the observed ozone could have been photochemically produced in the troposphere but at much larger geographical or time scales. The origin of the atmospheric ozone entering the boundary layer during a deep subsidence event might be of upper tropospheric or stratospheric origin but it could also come from the lower or the middle troposphere during stagnant regional conditions when important photochemical ozone production is observed over the continent. It is not clear to which extend the regional models reproduce these events, which seem to be quite discontinuous and their effect might be quite significant during certain time periods usually lasting for several days.
A further detailed study of this phenomenon, would improve our understanding on the mechanisms associated with intercontinental pollution as well as regional photochemical pollution. The most affected region within the Mediterranean basin seems to be the eastern Mediterranean, where the 60 ppb EU standard is very frequently exceeded during the warm period of the year and especially during July–August, when the atmospheric subsidence over the area is a quite common atmospheric feature and almost quasi-permanent as it comes out from the average climatology of the omega vertical velocity (Doche et al., Citation2014; Zanis et al., Citation2014). In conclusion, in the Mediterranean during some high ozone events a large part of the measured ozone could not be attributed to the local or even regional emissions, which, for the affected countries might be a reason of reconsideration of the procedures of compliance to air pollution standards.
4. Conclusions
From the analysis of the summer vertical profiles of ozone measured in the period 1994–2008 in the framework of the MOZAIC project over five eastern Mediterranean airports, the following concluding remarks can be made:
During the 7% highest ozone days at the 0–1500 m layer over Cairo, very high ozone concentrations, about 80 ppb on average, from the ground surface up to 4–5 km altitude are observed. On the contrary, the lowest levels of ozone observed in the boundary layer (20–40 ppb) are associated with lower ozone levels (<60 ppb) up to 5 km. The difference in ozone concentrations between the 7% highest and the 7% lowest ozone days (about 60 ppb) is maximised close to the surface. On the contrary, the relative humidity levels are lower below 1 km during the highest ozone days, while the CO levels during the highest ozone days in the boundary layer over Cairo are just slightly higher than the average CO levels.
Highest ozone levels over Cairo in the lower troposphere and the boundary layer are observed under strong and extended anticyclonic conditions over North Africa and central Europe for several days before the measurement. On the contrary, low ozone is observed when the North African anticyclone is weak and restricted and when low-pressure systems prevail over central and northern Europe. In addition, the examination of the average composite charts of more meteorological parameters during the highest and lowest ozone days for both 1.5–5 km and 0–1.5 km layers shows that there are extended regions of strong subsidence in the eastern Mediterranean but also in eastern and northern Europe. Over the same regions the atmosphere is dryer than average, as observed from anomalies in the specific humidity anomalies and the precipitable water content. At the same time a strong northerly flow in the eastern Mediterranean (Etesian winds) prevails and also negative temperature anomalies appear at the 850 and 700 hPa levels over the regions of maximum subsidence.
Based on the FLEXPART back-trajectory simulations corresponding to the highest ozone days, the high intensity of atmospheric subsidence over the eastern Mediterranean is also detected. Interestingly, tropospheric subsidence might occur also during the lowest ozone days, although much weaker than during the highest ozone days.
The detailed examination of three characteristic highest ozone profiles confirms that tropospheric subsidence is a major source for the high ozone background at the surface in the region. This could be due to either deep or shallow tropospheric subsidence associated with different meteorological conditions. During deep tropospheric subsidence and on a few days timescale, transport is clearly predominant while during conditions of shallow subsidence associated with extended stagnant conditions and pollutants accumulation as well as high temperatures, ozone photochemical production could be important as well. The day with the highest ozone values at the 0–2 km layer over Cairo (about 90 ppb, well above the 60 ppb EU standard) a combination of both types of deep and shallow subsidence is observed.
The combined use of composite charts of the available meteorological parameters together with the corresponding back-trajectories could be a very effective tool in understanding the ozone variability in the boundary layer and ground surface, especially for the detection of the influence of the upper tropospheric layers.
Combining the above observations, it appears that ozone variability over the eastern Mediterranean in the boundary layer as well as at the surface is significantly influenced by tropospheric transport, which is associated with certain mesoscale synoptic meteorological conditions.
Acknowledgments
This work was supported by the Research Committee of the Academy of Athens and the Mariolopoulos-Kanaginis Foundation for the Environmental Sciences. The composite weather maps were provided by the NOAA/ESRL Physical Sciences Division, Boulder Colorado from their Web site at www.cdc.noaa.gov/. MOZAIC was funded by the European Commission. The authors acknowledge for the strong support of the European Commission, Airbus and the Airlines (Lufthansa, Austrian, Air France) who carry the MOZAIC equipment free of charge and have performed the maintenance since 1994. MOZAIC is presently funded by INSU-CNRS (France), Meteo-France and Forschungszentrum Juelich (Germany). The MOZAIC database is supported by ETHER (CNES and INSU-CNRS). Dr. J. Hjorth, JRC-Ispra, and Dr. H. Smit, FZ-Juelich, are also gratefully acknowledged for discussion and comments. The authors also acknowledge the constructive comments of the two anonymous referees.
References
- Anagnostopoulou C. , Zanis P. , Katragkou E. , Tegoulias I. , Tolika K . Recent past and future patterns of the Etesian winds based on regional scale climate model simulations. Clim. Dynam. 2014; 42: 1819–1836. DOI: http://dx.doi.org/10.1007/s00382-013-1936-0 .
- Coman A. , Foret G. , Beekmann M. , Eremenko M. , Dufour G. , co-authors . Assimilation of IASI partial tropospheric columns with an Ensemble Kalman Filter over Europe. Atmos. Chem. Phys. 2012; 12: 2513–2532. DOI: http://dx.doi.org/10.5194/acp-12-2513-2012 .
- Doche C. , Dufour G. , Foret G. , Eremenko M. , Cuesta J. , co-authors . Summertime tropospheric-ozone variability over the Mediterranean basin observed with IASI. Atmos. Chem. Phys. 2014; 14: 10589–10600.
- Eremenko M. , Dufour G. , Foret G. , Keim C. , Orphal J. , co-authors . Tropospheric ozone distributions over Europe during the heat wave in July 2007 observed from infrared nadir spectra recorded by IASI. Geophys. Res. Lett. 2008; 35: 18805. DOI: http://dx.doi.org/10.1029/2008GL034803 .
- Foret G. , Hamaoui L. , Schmechtig C. , Eremenko M. , Keim C. , co-authors . Evaluating the potential of IASI ozone observations to constrain simulated surface ozone concentrations. Atmos. Chem. Phys. 2009; 9: 8479–8491. DOI: http://dx.doi.org/10.5194/acp-9-8479-2009 .
- Gros V. , Williams J. , van Aardenne J. A. , Salisbury G. , Hofmann R. , co-authors . Atmos. Chem. Phys. 2003; 3: 1223–1235. DOI: http://dx.doi.org/10.5194/acp-3-1223-2003 Origin of anthropogenic hydrocarbons and halocarbons measured in the summertime European outflow (on Crete in 2001).
- Kalabokas P. D. , Cammas J.-P. , Thouret V. , Volz-Thomas A. , Boulanger D. , co-authors . Examination of the atmospheric conditions associated with high and low summer ozone levels in the lower troposphere over the eastern Mediterranean. Atmos. Chem. Phys. 2013; 13: 10339–10352. DOI: http://dx.doi.org/10.5194/acp-13-10339-2013 .
- Kalabokas P. D. , Mihalopoulos N. , Ellul R. , Kleanthous S. , Repapis C. C . An investigation of the meteorological and photochemical factors influencing the background rural and marine surface ozone levels in the Central and Eastern Mediterranean. Atmos. Environ. 2008; 42: 7894–7906.
- Kalabokas P. D. , Repapis C. C . A climatological study of rural surface ozone in central Greece. Atmos. Chem. Phys. 2004; 4: 1139–1147. DOI: http://dx.doi.org/10.5194/acp-4-1139-2004 .
- Kalabokas P. D. , Viras L. G. , Bartzis J. G. , Repapis C. C . Mediterranean rural ozone characteristics around the urban area of Athens. Atmos. Environ. 2000; 34: 5199–5208.
- Kalabokas P. D. , Volz-Thomas A. , Brioude J. , Thouret V. , Cammas J.-P. , co-authors . Vertical ozone measurements in the troposphere over the Eastern Mediterranean and comparison with Central Europe. Atmos. Chem. Phys. 2007; 7 : 3783–3790. DOI: http://dx.doi.org/10.5194/acp-7-3783-2007 .
- Kalnay E. , Kanamitsu M. , Kistler R. , Collins W. , Deaven D. , co-authors . The NCEP/NCAR Reanalysis 40-year Project. Bull. Am. Meteorol. Soc. 1996; 77 : 437–471.
- Kleanthous S. , Vrekoussis M. , Mihalopoulos N. , Kalabokas P. , Lelieveld J . On the temporal and spatial variation of ozone in Cyprus. Sci. Total Environ. 2014; 476–477: 677–687.
- Kourtidis K. , Zerefos C. , Rapsomanikis S. , Simeonov V. , Balis D. , co-authors . Regional levels of ozone in the troposphere over eastern Mediterranean. J. Geophys. Res. 2002; 107: 8140. DOI: http://dx.doi.org/10.1029/2000JD000140 .
- Kouvarakis G. , Vrekoussis M. , Mihalopoulos N. , Kourtidis K. , Rappenglueck B. , co-authors . Spatial and temporal variability of tropospheric ozone in the boundary layer above the Aegean Sea (eastern Mediterranean). J. Geophys. Res. 2002; 107: 8137. DOI: http://dx.doi.org/10.1029/2000JD000081 .
- Lelieveld J. , Berresheim H. , Borrmann S. , Crutzen P. J. , Dentener F. J. , co-authors . Global air pollution crossroads over the Mediterranean. Science. 2002; 298: 794–799.
- Li Q. , Jacob D. J. , Logan J. A. , Bey I. , Yantosca R. M. , co-authors . A tropospheric ozone maximum over the Middle East. Geophys. Res. Lett. 2001; 28: 3235–3238. DOI: http://dx.doi.org/10.1029/2001GL013134 .
- Liu J. J. , Jones D. B. A. , Worden J. R. , Noone D. , Parrington M. , co-authors . Analysis of the summertime build-up of tropospheric ozone abundances over the Middle East and North Africa as observed by the Tropospheric Emission Spectrometer instrument. J. Geophys. Res. 2009; 114: D05304. DOI: http://dx.doi.org/10.1029/2008JD010993 .
- Mantis H. T. , Repapis C. C. , Zerefos C. S . The summer maximum in total ozone over Northwest Europe. Pure Appl. Geophys. 1981; 119: 213–230.
- Marenco A. , Thouret V. , Nédélec P. , Smit H. , Helten M. , co-authors . Measurements of ozone and water vapor by Airbus in-service aircraft: the MOZAIC airborne program. An overview. J. Geophys. Res. 1998; 103: 25631–25642.
- Metaxas D. A . The interannual variability of the Etesian frequency as a response of atmospheric circulation anomalies. Bull. Hellenic Meteorol. Soc. 1977; 2(5): 30–40.
- Nedelec P. , Cammas J.-P. , Thouret V. , Athier G. , Cousin J.-M. , co-authors . An improved infrared carbon monoxide analyser for routine measurements aboard commercial Airbus aircraft: technical validation and first scientific results of the MOZAIC III programme. Atmos. Chem. Phys. 2003; 3: 1551–1564. DOI: http://dx.doi.org/10.5194/acp-3-1551-2003 .
- Parrish D. D. , Aikin K. C. , Oltmans S. J. , Johnson B. J. , Ives M. , co-authors . Impact of transported background ozone inflow on summertime air quality in a California ozone exceedance area. Atmos. Chem. Phys. 2010; 10: 10093–10109. DOI: http://dx.doi.org/10.5194/acp-10-10093-2010 .
- Prezerakos N. G . Does the extension of the Azores anticyclone towards the Balkans really exist, Arch. Meteorol. Geophys. Bioklimatol. A. 1984; 33: 217–227.
- Raicich F. , Pinardi N. , Navarra A . Teleconnections between Indian monsoon and Sahel rainfall and the Mediterranean. Int. J. Climatol. 2003; 23: 173–186.
- Repapis C. , Zerefos C. , Tritakis B . On the Etesians over the Aegean. Proc. Acad. Athens. 1977; 52: 572–606.
- Richards N. A. D. , Arnold S. R. , Chipperfield M. P. , Miles G. , Rap A. , co-authors . The Mediterranean summertime ozone maximum: global emission sensitivities and radiative impacts. Atmos. Chem. Phys. 2013; 13: 2331–2345. DOI: http://dx.doi.org/10.5194/acp-13-2331-2013 .
- Rodwell M. J. , Hoskins B. J . Monsoons and the dynamics of deserts. Q. J. Roy. Meteorol. Soc. 1996; 122: 1385–1404.
- Rodwell M. J. , Hoskins B. J . Subtropical anticyclones and summer monsoons. J. Clim. 2001; 14: 3192–3211.
- Roelofs G. J. , Scheeren H. A. , Heland J. , Ziereis H. , Lelieveld J . A model study of ozone in the eastern Mediterranean free troposphere during MINOS (August 2001). Atmos. Chem. Phys. 2003; 3: 1199–1210. DOI: http://dx.doi.org/10.5194/acp-3-1199-2003 .
- Sánchez M. L. , García M. A. , Pérez I. A. , de Torre B . Evaluation of surface ozone measurements during 2000–2005 at a rural area in the upper Spanish plateau. J. Atmos. Chem. 2008; 60: 137–152.
- Scheeren H. A. , Lelieveld J. , Roelofs G. J. , Williams J. , Fischer H. , co-authors . The impact of monsoon outflow from India and Southeast Asia in the upper troposphere over the eastern Mediterranean. Atmos. Chem. Phys. 2003; 3: 1589–1608. DOI: http://dx.doi.org/10.5194/acp-3-1589-2003 .
- Safieddine S. , Boynard A. , Coheur P.-F. , Hurtmans D. , Pfister G. , co-authors . Summertime tropospheric ozone assessment over the Mediterranean region using the thermal infrared IASI/MetOp sounder and the WRF-Chem model. Atmos. Chem. Phys. 2014; 14: 10119–10131. DOI: http://dx.doi.org/10.5194/acp-14-10119-2014 .
- Schürmann G. J. , Algieri A. , Hedgecock I. M. , Manna G. , Pirrone N. , co-authors . Modeling local and synoptic scale influences on ozone concentrations in a topographically complex region of Southern Italy. Atmos. Environ. 2009; 43: 4424–4434.
- Stohl A. , Forster C. , Frank A. , Seibert P. , Wotawa G . Technical note: the Lagrangian particle dispersion model FLEXPART version 6.2. Atmos. Chem. Phys. 2005; 5: 2461–2474. DOI: http://dx.doi.org/10.5194/acp-5-2461-2005 .
- Stohl A. , Hittenberger M. , Wotawa G . Validation of the Lagrangian particle dispersion model FLEXPART against large scale tracer experiments. Atmos. Environ. 1998; 24: 4245–4264.
- Thouret V. , Cammas J.-P. , Sauvage B. , Athier G. , Zbinden R. , co-authors . Tropopause referenced ozone climatology and inter-annual variability (1994–2003) from the MOZAIC programme. Atmos. Chem. Phys. 2006; 6: 1033–1051. DOI: http://dx.doi.org/10.5194/acp-6-1033-2006 .
- Thouret V. , Marenco A. , Logan J. , Nédélec P. , Grouhel C . Comparisons of ozone measurements from the MOZAIC airborne program and the ozone sounding network at eight locations. J. Geophys. Res. 1998; 103: 25695–25720.
- Traub M. , Fischer H. , de Reus M. , Kormann R. , Heland H. , co-authors . Chemical characteristics assigned to trajectory clusters during the MINOS campaign. Atmos. Chem. Phys. 2003; 3: 459–468. DOI: http://dx.doi.org/10.5194/acp-3-459-2003 .
- Tressol M. , Ordonez C. , Zbinden R. , Brioude J. , Thouret V. , co-authors . Air pollution during the 2003 European heat wave as seen by MOZAIC airliners. Atmos. Chem. Phys. 2008; 8: 2133–2150. DOI: http://dx.doi.org/10.5194/acp-8-2133-2008 .
- Tyrlis E. , Lelieveld J . Climatology and dynamics of the summer Etesian Winds over the Eastern Mediterranean. J. Atmos. Sci. 2013; 70: 3374–3396.
- Tyrlis E. , Lelieveld J. , Steil B . The summer circulation over the eastern Mediterranean and the Middle East: influence of the South Asian monsoon. Clim. Dynam. 2013; 40: 1103–1123. DOI: http://dx.doi.org/10.1007/s00382-012-1528-4 .
- Tyrlis E. , Škerlak B. , Sprenger M. , Wernli H. , Zittis G. , co-authors . On the linkage between the Asian summer monsoon and tropopause fold activity over the eastern Mediterranean and the Middle East. J. Geophys. Res. Atmos. 2014; 119: 3202–3221. DOI: http://dx.doi.org/10.1002/2013JD021113 .
- Van Aalst R. , Fowler D. , Megie G. , Moussiopoulos N. , Warneck P. , co-authors . Borrell P. , Hov O. , Grennfelt P. , Builtjes P . Photo-oxidants. Photooxidants, Acidification and Tools; Policy Applications of EUROTRAC results. 1996; Berlin: Springer Verlag. 41–69. Vol. 10.
- Varotsos C. , Kalabokas P. , Chronopoulos G . Atmospheric ozone concentration at Athens, Greece. Part II: Vertical ozone distribution in the troposphere. Atmos. Res. 1993; 30: 151–155.
- Velchev K. , Cavalli F. , Hjorth J. , Marmer E. , Vignati E. , co-authors . Ozone over the Western Mediterranean Sea – results from two years of ship borne measurements. Atmos. Chem. Phys. 2011; 11: 675–688. DOI: http://dx.doi.org/10.5194/acp-11-675-2011 .
- Volz-Thomas A. , Beekmann M. , Derwent D. , Law K. , Lindskog A. , co-authors . Builtjes P. J.-H. , Harrison R. M. , Midgley P. M. , Tørsen K . Tropospheric ozone and its control. Towards Cleaner Air for Europe – Science, Tools and Applications. Part 1: Results from the EUROTRAC-2; Synthesis and Integration (S&I) Project. 2003; Munchen, Germany: International Scientific Secretariat. 73–122.
- Zanis P. , Hadjinicolaou P. , Pozzer A. , Tyrlis E. , Dafka S. , co-authors . Summertime free-tropospheric ozone pool over the eastern Mediterranean/Middle East. Atmos. Chem. Phys. 2014; 14: 115–132.
- Zbinden R. M. , Thouret V. , Ricaud P. , Carminati F. , Cammas J.-P. , co-authors . Climatology of pure Tropospheric profiles and column contents of ozone and carbon monoxide using MOZAIC in the mid-northern latitudes (24N to 50 N) from 1994 to 2009. Atmos. Chem. Phys. Discuss. 2013; 13: 14695–14747. DOI: http://dx.doi.org/10.5194/acpd-13-14695-2013 .
- Zerefos C. S. , Kourtidis K. A. , Melas D. , Balis D. , Zanis P. , co-authors . Photochemical Activity and Solar Ultraviolet Radiation (PAUR) Modulation factors: an overview of the project. J. Geophys. Res. 2002; 107: 8134. DOI: http://dx.doi.org/10.1029/2000JD000134 .
- Ziv B. , Saaroni H. , Alpert P . The factors governing the summer regime of the Eastern Mediterranean. Int. J. Climatol. 2004; 24: 1859–1871.