
Abstract
In 2011, the MOZAIC (Measurement of Ozone by AIRBUS In-Service Aircraft) successor programme IAGOS (In-service Aircraft for a Global Observing System) started to equip their long-haul passenger aircraft with the modified capacitive hygrometer Vaisala HUMICAP® of type H. The assurance of the data quality and the consistency of the data set during the transition from MOZAIC Capacitive Hygrometers to IAGOS Capacitive Hygrometers were evaluated within the CIRRUS-III and AIRTOSS-ICE field studies. During these performance tests, the capacitive hygrometers were operated aboard a Learjet 35A aircraft together with a closed-cell Lyman-α fluorescence hygrometer, an open-path tunable diode laser (TDL) system and a closed-cell, direct TDL absorption hygrometer for water vapour measurement. For MOZAIC-typical operation conditions, the comparison of relative humidity (RH) data from the capacitive hygrometers and reference instruments yielded remarkably good agreement with an uncertainty of 5% RH. The temperature dependence of the sensor's response time was derived from the cross-correlation of capacitive hygrometer data and smoothed data from the fast-responding reference instruments. The resulting exponential moving average function could explain the major part of the observed deviations between the capacitive hygrometers and the reference instruments.
This paper is part of a Special Issue on MOZAIC-IAGOS in Tellus B celebrating 20 years of an ongoing air chemistry climate research measurements from airbus commerical aircraft operated by an international consortium of countries. More papers from this issue can be found at http://www.tellusb.net
1. Introduction
In the framework of the Global Climate Observing System (GCOS, Citation2010) water vapour was identified as one of the core variables to be monitored for a better understanding, prediction and mitigation of climate change. Particularly, the interaction between the water vapour in the UTLS (upper troposphere and lowermost stratosphere) and tropopause dynamics needs a detailed consideration. This region is characterised by thermal gradients and dynamic barriers controlling atmospheric transport processes. It is most important for climate change and dynamical processes to understand stratosphere–troposphere exchange (Gettelman et al., Citation2011), but hardly observable from space or from ground. Since global aviation mainly operates in the altitude band between 9 and 13 km, in-service aircraft equipped with small, compact and light-weight scientific instruments for measuring atmospheric trace constituents are a powerful tool for collecting in situ observation data in the extra-tropical UTLS.
Since 1994, the European research programme MOZAIC (Measurement of Ozone by AIRBUS In-Service Aircraft; Marenco et al., Citation1998) and its successor IAGOS (In-service Aircraft for a Global Observing System; Petzold et al., Citation2015) have provided regular data for relative humidity (RH) and other meteorological quantities such as temperature and pressure as well as data on atmospheric composition (e.g. ozone and CO) with high spatial and temporal resolution on a global scale. RH data from the MOZAIC programme have been used for various climatological studies, including the distribution of upper tropospheric humidity (UTH; Kley et al., Citation2007; Luo et al., Citation2007, Citation2008) and the distribution of RH with respect to ice (e.g. Gierens et al., Citation1997, Citation1999) and ice-supersaturation regions (e.g. Gierens et al., Citation2000; Spichtinger et al., Citation2003) in the upper troposphere. The reanalysis of the global MOZAIC RH data set for the period 2000–2009 was recently published (Smit et al., Citation2014).
Atmospheric RH is measured in the MOZAIC/IAGOS approach through a compact airborne humidity sensing device based on capacitive sensors Vaisala HUMICAP® of type H (MOZAIC/IAGOS Capacitive Hygrometer: MCH and ICH). The MCH itself, the applied calibration techniques and evaluations are described in detail by Helten et al. (Citation1998) and Neis et al. (Citation2015), while Smit et al. (Citation2008) presents an approach for a potential in-flight calibration.
In 2011, IAGOS aircraft were equipped with a modified Vaisala HUMICAP® of type H sensor. To assure the data quality and the consistency in the data set during the transition from MCH to ICH, we evaluated both sensors during the CIRRUS-III (MCH) and AIRTOSS-ICE (ICH) field study.
2. Description of the modified IAGOS Capacitive Hygrometer
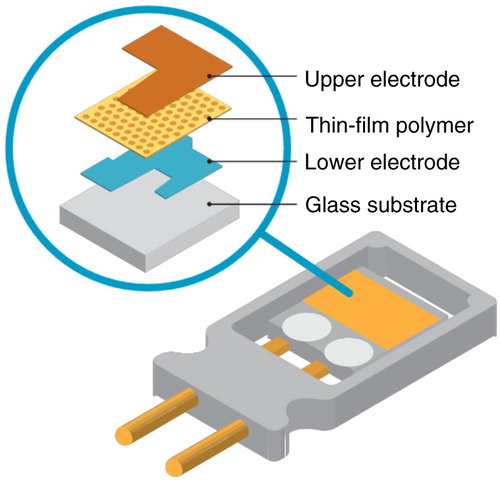
In the following sections, we describe the modification of the revised compact airborne IAGOS Capacitive Hygrometer. A detailed description and evaluation of the MOZAIC Capacitive Hygrometer is given elsewhere (Helten et al., Citation1998, Citation1999; Smit et al., Citation2014; Neis et al., Citation2015). The ICH uses a capacitive sensor (Vaisala HUMICAP® of type H, Finland), the capacitance of which depends on the RH of the dielectric layer of the condenser, and a platinum resistance sensor (Pt100) for the direct measurement of the temperature at the humidity sensing surface. The measurement principle is based on the diffusion-limited adsorption/desorption of H2O molecules by the dielectric membrane of the sensor. Since diffusion is strongly temperature dependent, the sensor response slows down at lower temperatures. shows the set-up of the capacitive sensor. The improved hydroactive thin-film polymer composition, with increased capacitance from former 40–50 pF to now 180–220 pF, was introduced in 2011 in the ICH to decrease the sensor response time by increasing its sensitivity.
Fig. 1 The advanced IAGOS Capacitive Hygrometer bases on a compact capacitive sensor measures relative humidity and differs from the MOZAIC Capacitive Hygrometer by the thin-film polymer composition. The improved hydroactive polymer composition of Vaisala HUMICAP® type H has a larger capacitance to increase the sensitivity. For signal processing, the Vaisala HMT333 transmitter unit is used. Courtesy of Vaisala Oyj, 2015.
3. Experimental section
3.1. Field campaigns CIRRUS-III and AIRTOSS-ICE
Both field studies CIRRUS-III and AIRTOSS-ICE used the same twin engine business-jet aircraft of type Learjet 35A operated by enviscope GmbH as measurement platform.
The overarching goals of CIRRUS-III, coordinated by the Forschungszentrum Jülich, were to understand the formation mechanism of cirrus clouds for different background conditions, their radiative effects and the microphysical properties of the cirrus cloud particles. In total, six flights were conducted between 23 and 29 November 2006 at mid-latitudes (45–70°N) and at flight altitudes between 7 and 12 km. These flights in the UTLS were launched from the Hohn Airforce Base in Northern Germany.
For the sensor intercomparison studies, CIRRUS-III contributed four flights. The data set consists of 13 flight hours in air masses colder than −40°C at cruise altitude, four flight hours in cirrus clouds and nine flight hours out of clouds.
As a main conclusion, Neis et al. (Citation2015) reported a good agreement of the MCH with the reference time series (see Section 3.2), with an uncertainty of 5% RH with respect to liquid water (RHliquid). During sequences with decreasing sensor temperature, the MCH showed a decreasing sensitivity as a consequence of the increasing response time (see Section 4.1), that is, small-scale fluctuations across strong RH gradients could not be resolved.
In 2013, two years after the first aircraft had been equipped with the modified sensor, the ICH was operated aboard the Learjet as part of the field study AIRTOSS-ICE (AIRcraft Towed Sensor Shuttle – Inhomogeneous Cirrus Experiment) to evaluate the performance of the ICH and to assure the data quality after the transition from MCH to ICH. This field study was coordinated by the Johannes Gutenberg University Mainz and the Leipzig Institute for Meteorology.
The main objectives of AIRTOSS-ICE was to study spatially inhomogeneous cirrus clouds and to understand their formation mechanism in different background conditions, their radiative impacts and the microphysical properties of the cirrus cloud particles. The uniqueness of this campaign was the opportunity to measure simultaneously on two height levels with a towed sensor shuttle (Frey et al., Citation2009).
This study focused on the main campaign with a total of seven flights between 29 August and 5 September 2013. Five of the flights were performed in two military restricted areas above the Baltic and the North Sea. The last two flights were heading to Iceland and back without the towed sensor shuttle. Flight altitudes between 8 and 12 km were reached. The main campaign flights were launched from the Schleswig Air Base in Northern Germany.
The data set consists of approximately five flight hours in air masses colder than −40°C at cruise altitude, approximately one flight hour in cirrus clouds and four flight hours out of clouds. An overview of data for cruise altitude from the two field campaigns is provided in .
Table 1. Field study data overview for cruise altitude
3.2. Instrumentation
During the CIRRUS-III and AIRTOSS-ICE field campaigns, high-precision research-grade instruments were operated aboard the aircraft to characterise the air masses probed during flight patterns in frontal cirrus clouds. An important part of the instrumentation was dedicated to the measurement of the gas-phase and condensed-phase water. The CIRRUS-III instrumentation included an MCH and an open-path tunable diode laser (TDL) system (open-path Jülich Stratospheric TDL ExpeRiment OJSTER; MayComm Instruments, May and Webster, Citation1993; Krämer et al., Citation2009) to measure gas-phase water vapour volume mixing ratio (VMR). Simultaneously, total water VMR (=gas-phase plus evaporated ice water) was measured by the well-established, closed-cell Lyman-α photofragment fluorescence hygrometer FISH (Fast In-Situ Hygrometer, Zöger et al., Citation1999; Meyer et al., Citation2015), which was equipped with a forward-facing inlet to sample gas-phase water in clear sky and total water inside cirrus clouds. The FISH instrument is regularly calibrated in the laboratory as well as in the field to an MBW DP30 reference frost point hygrometer and thus is regarded as transfer standard between aircraft measurements and the ground-based reference. OJSTER is compared to and, if necessary, adjusted to the FISH measurement as described by Krämer et al. (Citation2009). To determine whether a data point is inside a cirrus cloud, the ratio of RHice from FISH (total water) and OJSTER (water vapour) was used (see Krämer et al., Citation2009).
The AIRTOSS-ICE instrumentation was similar to CIRRUS-III with an ICH and FISH. For gas-phase water vapour VMR measurements, a novel instrument, the calibration-free (first principles), direct tunable diode laser absorption (TDLAS) hygrometer SEALDH-II (Selective Extractive Airborne Laser Diode Hygrometer, Buchholz et al., Citation2013), was used. The SEALDH-II was validated via a comparison to the metrological water vapour scale and a primary humidity standard (Buchholz et al., Citation2014). Again, the cirrus cloud data points have been determined from the ratio of RHice from FISH (total water) and SEALDH-II (water vapour). An instrument overview and the parameters derived from these measurements are listed in .
Table 2. Participating hygrometers during CIRRUS-IIIa and AIRTOSS-ICEb
For both field campaigns we finally used reference water vapour time series, combining FISH data in the cloud-free sequences and TDL instrument data for the in-cloud sequences.
3.3. Data overview
For the evaluation of the MCH and ICH performance and to assure the data quality after the transition, we classified the probed air masses of both field studies and compared them to conditions met in the MOZAIC and IAGOS programmes.
An obvious criterion is the sensor temperature, which is substantially higher of about 35°C compared to the ambient air temperature. This heating is caused by adiabatic compression in the aeronautic inlet housing at typical Mach numbers of about 0.81 M (Helten et al., Citation1998). Both capacitive hygrometers are regularly calibrated in the atmospheric simulation chamber at Jülich (Smit et al., Citation2000) before installation on the aircraft, and again after detachment. For both, these calibrations are made over a sensor temperature range between −40 and +20°C against (1) a Lyman-α photofragment fluorescence hygrometer (Kley and Stone, Citation1978) for water vapour VMR below 1000 ppmv and (2) a dew/frost point hygrometer (General Eastern, Type D1311R) for water vapour VMR above 1000 ppmv (Smit et al., Citation2000).
Another reason for classifying the field study data by the sensor temperature is the fact that Neis et al. (Citation2015) have observed an improvement in the agreement with the reference humidity data with increasing sensor temperature, that is, with decreasing response time of the hygrometer.
The distributions of measured sensor temperatures during 15 yr of MOZAIC measurements and during CIRRUS-III and AIRTOSS-ICE are shown in as probability distribution functions (PDFs). The large data set of 15 yr of MOZAIC measurements can be described as a Gaussian distribution with its maximum at −22°C broadened with higher values from the ascent and descent sequences, when approaching or leaving the airport. T sensor values colder than the minimum calibration temperature −40°C occur in less than 1% of the data.
Fig. 2 Probability distribution functions (PDF) show the distributions of the measured sensor temperatures during a) 15 yr of MOZAIC measurements, b) CIRRUS-III and c) AIRTOSS-ICE. The red line indicates the lower limit of the sensor calibration. The grey line illustrates the most probable value of MOZAIC distribution.
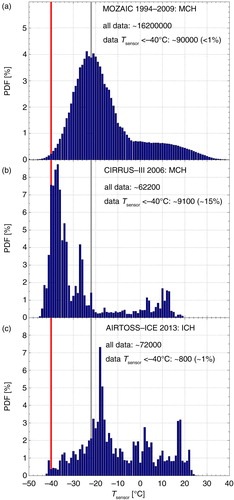
The most probable T sensor value observed during CIRRUS-III is −38°C, with 15% of the data colder than −40°C. The distribution is shifted to colder temperatures, that is, to longer response times relative to the MOZAIC PDF.
AIRTOSS-ICE showed a shift to warmer temperatures compared to the MOZAIC data. The most probable T sensor is at −18°C, with less than 1% of the data colder than −40°C. This distribution results in a shorter response time compared to both other data sets.
In the following section, we describe the methodology to determine the temperature-dependent response time. This property is needed for the comparison of the capacitive hygrometer evaluations during two field studies with different ambient conditions.
4. Methodology of performance evaluation
Former evaluation studies of the MCH showed a good agreement with high-precision water vapour instruments (Helten et al., Citation1998; Neis et al., Citation2015). However, they also reported a decreasing sensitivity of the MCH with decreasing sensor temperatures as a result of an increasing but unspecified sensor response time.
The reduced temperature range of CIRRUS-III data does not permit a robust analysis for the MCH only. However, combining the data sets of CIRRUS-III and AIRTOSS-ICE (see ), the complete MOZAIC-relevant temperature range from −40°C to 0°C is covered and the determination of the temperature-dependent response time is possible.
4.1. Temperature-dependent response time
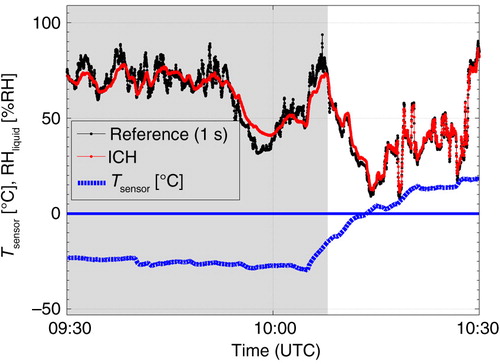
The impact of the temperature-dependent response time τ is illustrated in the extracted time-series sequence of an AIRTOSS-ICE flight in . With increasing sensor temperature, the difference of the RHliquid measurements of ICH and the reference, that is, in clear sky and below 1000 ppmv water vapour VMR the FISH instrument, otherwise SEALDH-II, decreases.
Fig. 3 RHliquid and T sensor (blue dotted line) sequence of an AIRTOSS-ICE flight. Small-scale fluctuations of the measured reference RHliquid (black line) can be resolved by the ICH (red line) in warmer air masses (white background). In colder air masses with T sensor<−20°C, the ICH seems to measure the smoothed background.
For different types of Vaisala radiosondes which also use capacitive Vaisala HUMICAP® RH sensors, Miloshevich et al. (Citation2004) have determined experimentally in a laboratory study the response time of the RH sensors at different temperatures. They found a strong exponential increase at decreasing sensor temperatures. Qualitatively, we expect a similar exponential response time behaviour for the Vaisala HUMICAP® RH sensor of the MCH and ICH instrument at low temperatures.
Although the hydroactive thin-film polymer composition is similar, the design of the Vaisala HUMICAP® RH sensor used in MCH or ICH are rather different compared to the sensor deployed on Vaisala radiosondes, such that significant quantitative differences in their temperature-dependent time response can be expected. In this study, the temperature-dependent time response τ is derived experimentally from the flight data by the following approach.
For each flight of the two field studies, an exponential moving average (EMA; Lucas and Saccucci, Citation1990) with a fixed τ value (1 – 501 s in 2 s steps) is applied to the reference RH time series, RH
t
[see eq. (1)]. The used EMA is defined as a linear transformation of RH
t
to a smoothed RH time series () according to
1
where . Subsequently, the flight data is grouped in distinct sensor temperature intervals. These temperature intervals T
i
of width 5 K are defined as T
i
=(T
i
−2.5<T
i
≤T
i
+2.5), where
K. Then, the cross-correlation factor R
2 is determined between the smoothed reference
and the responsible MCH or ICH RH
t
measurement for every temperature interval.
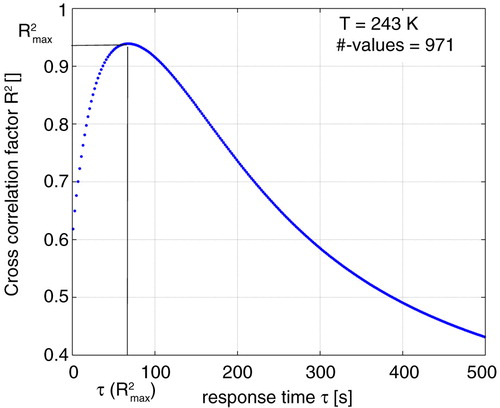
An example shown in demonstrates the way to extract the most probable response time. Upon calculating all the cross-correlation factors R 2 for the measurements in the temperature interval T i =243 K for AIRTOSS-ICE flight 3, the most probable response time τ can be determined by the distinctive maxima in R 2. If there is, in addition, a minimum number of 600 values (equivalent to 10 min flight) in the temperature bin, this τ and T-value data pair is used for further calculation of the temperature-dependent time response equation.
Fig. 4 Example to demonstrate the way to determine the most probable response time in the temperature bin T=243 K for AIRTOSS-ICE flight 3.
In , the determined τ values are plotted against T
sensor for all flights of the two field studies. Because the advanced ICH confirms and expands the MCH behaviour, it was possible to merge both field study response times for the calculation. As described before, the number of τ values per temperature depends on the number of measurement values (minimum 600 values) and the existence of the distinctive maxima in the R
2 distribution. A robust fit function yields the temperature-dependent time response equation2
Fig. 5 Determined response times per temperature bin and flight for the CIRRUS-III (blue squares) and AIRTOSS-ICE (red stars) flights. The robust exponential fit (black line) through the data leads to the MCH and ICH characteristic temperature-dependent response time τ [see eq. (2)].
![Fig. 5 Determined response times per temperature bin and flight for the CIRRUS-III (blue squares) and AIRTOSS-ICE (red stars) flights. The robust exponential fit (black line) through the data leads to the MCH and ICH characteristic temperature-dependent response time τ [see eq. (2)].](/cms/asset/1fd8ea1b-a3c6-49c5-a7e0-70017317f388/zelb_a_11817329_f0005_ob.jpg)
with T sensor in units of Kelvin. With decreasing sensor temperature, τ increases from a few seconds at 273 K to a few minutes below the calibration limit of 233 K. The increase in the spread of τ in some temperature intervals might be a result of the flight pattern with an increased or decreased amount of flight level changes.
The validity check for this function is visualised in for an example flight of AIRTOSS-ICE. The envelope of the original 1 Hz RHliquid difference, that is, ICH – reference, increases from ±5% to ±10% RHliquid with decreasing T sensor of −18 to −30°C. The ability of the ICH to resolve small-scale fluctuations in RHliquid reduces with lower temperatures. Later in flight, T sensor increases significantly, which immediately leads to differences of less than 1% RHliquid to the reference value.
Fig. 6 From top to bottom: RHliquid measured by the ICH (red) and the measured reference (black), that is, FISH (clear sky) and SEALDH-II [in-cirrus (blue dots) and above 1000 ppmv]; RHliquid measured by the ICH (red) and the smoothed reference (EMA including the temperature-dependent response time, black); Δ RHliquid (ICH and reference) as envelope for the measured reference and as green line for the smoothed reference, as a function of flight time during the AIRTOSS-ICE flight on 3 September 2013; and sensor temperature T sensor (black) as well as the lower temperature limit of the calibration (red).
![Fig. 6 From top to bottom: RHliquid measured by the ICH (red) and the measured reference (black), that is, FISH (clear sky) and SEALDH-II [in-cirrus (blue dots) and above 1000 ppmv]; RHliquid measured by the ICH (red) and the smoothed reference (EMA including the temperature-dependent response time, black); Δ RHliquid (ICH and reference) as envelope for the measured reference and as green line for the smoothed reference, as a function of flight time during the AIRTOSS-ICE flight on 3 September 2013; and sensor temperature T sensor (black) as well as the lower temperature limit of the calibration (red).](/cms/asset/5abee017-e5b1-4aee-a3a9-8139d90565db/zelb_a_11817329_f0006_ob.jpg)
The EMA smoothing function is defined by the previously determined temperature-dependent response time [see eq. (1)]. After applying this function to the reference RHliquid time series, the ICH time series is reproduced for almost the complete cold flight sequence without getting worse in the warmer sequence of the flight. The remaining deviations might have their origins in calibration uncertainties, as well as in the potential deviations in the response time for conditions when the RHliquid is either increasing or decreasing (Wildmann et al., Citation2014) and uncertainties in the reference measurement.
5. Results
We extracted a subset of the measured data set, which corresponds to the regular operation conditions of the MCH and ICH aboard long-haul passenger aircraft. The MOZAIC/IAGOS typical conditions are characterised by the sensor temperature T sensor, which depends on the cruising speed of the aircraft. As described in Section 3.3, the cruising speed of in-service aircraft at a Mach number of 0.81 M causes a heating of the ambient temperature through adiabatic compression in the aeronautic inlet housing and yields to sensor temperatures, which are usually above the lower calibration temperature limit of −40°C (see Fig. 2a).
However, during CIRRUS-III the operation aboard the slower-flying Learjet 35A (cruising speed <0.70 M), T sensor values significantly lower than −40°C were reached (see ). Data for T sensor<−40°C were excluded from further analysis.
To minimise the perturbation of measurements by potentially sampled liquid water droplets in warm clouds, the maximum T ambient was set to the level of instantaneous freezing of −40°C. A perturbation of measurements by potentially sampled ice crystals have not been observed by Neis et al. (Citation2015). Since the steep ascents and descents of the Learjet 35A are not comparable to conditions aboard long-haul passenger aircraft, these flight sequences were also excluded from further analysis.
A statistically based view on the measured data set is shown in , where the correlation between the sensors averaged for 5% RHliquid bins is shown. The MCH agrees very well with the reference instruments over the entire range of values measured in the cloud-free atmosphere. Inside cirrus clouds (see a), that is, RHliquid > approximately 60%, the sensors deviate as expected since the increased MCH response time decreases with decreasing T sensor. In turn, the sensitivity of the MCH decreases and small-scale fluctuations cannot be resolved. Linear regression analysis provides a correlation coefficient of R 2=0.99 with an offset of −0.15±1.29% RHliquid and a slope of 1.02±0.03. Median values and almost all of the 25th and 75th percentiles fall within the ±5% RHliquid range of the linear regression line.
Fig. 7 (a) presents comparisons between the RHliquid data from MCH and the measured reference, that is, FISH (clear sky) and OJSTER (in-cirrus), during CIRRUS-III. (b) shows results of comparisons between ICH and the measured reference, that is, FISH (clear sky) and SEALDH-II (in-cirrus and above 1000 ppmv), during AIRTOSS-ICE campaign; the straight line indicates the linear regression line, while the dashed lines illustrate the sensor uncertainty range ±5% RHliquid. In the transition area measurements of both reference instruments can occur.
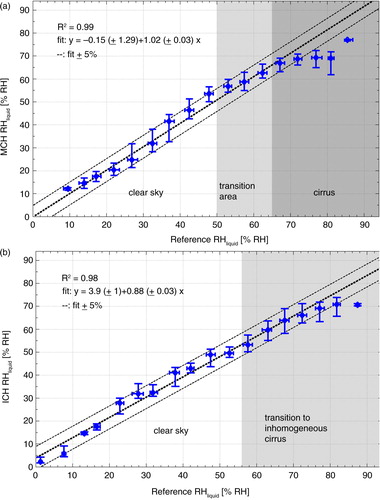
Similar result is found for the intercomparison of ICH and the measured reference (see b), where the correlation between the sensors averaged for 5% RHliquid bins confirm the uncertainty of 5% RHliquid. Inside the transition to inhomogeneous cirrus, that is, RHliquid > ca. 56%, the variability of ICH values increases mainly as a result of the increased response time. The measured data provide a correlation coefficient of R 2=0.98 with an offset of 3.90±1.00% RHliquid and a slope of 0.88±0.03.
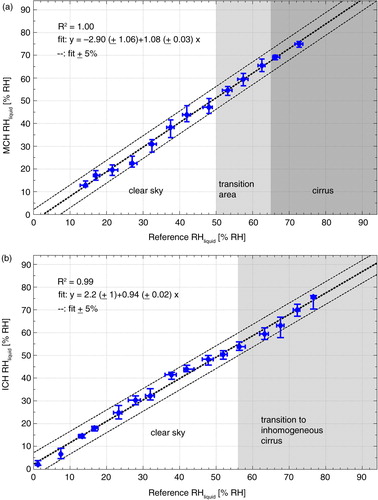
After applying the smoothing algorithm based on the temperature-dependent response time to the reference data, the correlation between MCH or ICH and the responsible reference data further increased (see ). Since both correlations reveal an improvement, that is, median values of each bin converge to the linear regression line with a clearly reduced variation, the main driver of observed small-scale deviations between the capacitive hygrometers and the reference instruments can be attributed to the temperature-dependent response time τ.
Fig. 8 Similar to Fig. 7, but the reference RHliquid data are smoothed prior to the comparisons of (a) CIRRUS-III and (b) AIRTOSS-ICE.
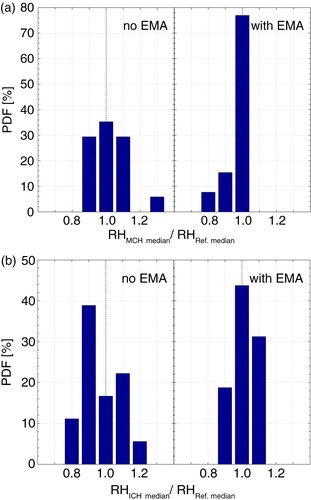
This finding can be confirmed by , where the ratios of the measured ICH and MCH medians to the measured (left panel) and the smoothed (right panel) reference medians are plotted for CIRRUS-III (MCH, a) and for AIRTOSS-ICE (ICH, b), respectively. Both PDFs show clearly a more narrow distribution around the ratio 1 with the applied temperature-dependent response time algorithm. The asymmetry in the distribution of a is caused by the sample of the 25–30% RHliquid bin in the MCH versus smoothed reference distribution (see ). However, the deviation is still within the 5% RHliquid uncertainty.
Fig. 9 Frequency of occurrence of the ratios of MCH to reference RHliquid (a) and of ICH to reference RHliquid (b), respectively. Both figures are divided into the PDF of original (left panel) and smoothed (right panel) reference data.
6. Summary and conclusions
Since 1994, long-haul passenger aircraft participating in the MOZAIC programme were equipped with a capacitive hygrometer Vaisala HUMICAP® of type H (MCH), measuring upper troposphere humidity. In 2011, the first aircraft of the successor programme IAGOS were equipped with the modified Vaisala HUMICAP® type H sensor (ICH). To assure the data quality and the consistency of the data set during the transition from MCH to ICH, we have evaluated both sensors during the CIRRUS-III (MCH) and AIRTOSS-ICE (ICH) field studies against similar reference techniques.
To obtain results for sensor uncertainties representative of its regular deployment aboard passenger aircraft, a subset of data was extracted, which corresponds to the typical MOZAIC/IAGOS operation conditions. Data with sensor temperatures below −40°C and thus below the calibration limit were excluded and strong ascent and descent sequences of the more agile aircraft were removed. Finally, the maximum ambient temperature was set to −40°C to exclude effects of warm clouds.
The RHliquid data grouped in 5% RHliquid bins agreed very well in cross-correlations for MCH and ICH and the respective reference instruments over the entire cloud-free range and for the most of the cirrus clouds sequences, yielding the uncertainty of 5% RHliquid.
Main deviations between the capacitive hygrometers and reference RHliquid data are related to decreasing sensor temperatures. Combining both field campaigns, it was possible to determine the temperature dependence of the sensor's response time. MCH and ICH RHliquid data were reproduced by applying the resulting exponential filter function to the measured reference RHliquid data. The temperature dependence of the capacitive hygrometer response time may also be used to extend the measurement range of the instrument to the dry conditions of the lowermost stratosphere. Contrary to earlier approaches (Helten et al., Citation1998) MCH and ICH data may now be considered valid, if the flight time of the aircraft in the lowermost stratosphere exceeds the sensor response time for the given temperature.
Furthermore, we showed that the quality of the upper tropospheric humidity (UTH) data is preserved during the transition from the MCH to the modified ICH. Both sensors showed similar behaviour in same conditions, which ensures a long-time data set for UTLS water vapour climatology and trend analyses, when combining MOZAIC and IAGOS UTH data sets.
7. Acknowledgements
The authors gratefully acknowledge Fanny Finger (Leipzig Univ.) and Marcus Klingebiel (Mainz Univ.) for planning and leading the AIRTOSS-ICE field campaign. The authors also acknowledge Peter Spichtinger (Mainz Univ.) for fruitful discussions. The support by enviscope GmbH at the technical organisation of the field study is also appreciated. Part of this work was funded by the German Federal Ministry for Research and Education (BMBF) in the framework of the joint programme IAGOS-D under Grant No. 01LK1223A and 01LK1301A.
Notes
This paper is part of a Special Issue on MOZAIC-IAGOS in Tellus B celebrating 20 years of an ongoing air chemistry climate research measurements from airbus commerical aircraft operated by an international consortium of countries. More papers from this issue can be found at http://www.tellusb.net
References
- Bange J. , Esposito M. , Lenschow D. H. , Brown P. R. A. , Dreiling V. , co-authors . Wendisch M. , Brenguier J.-L . Measurement of aircraft state and thermodynamic and dynamic variables. Airborne Measurements for Environmental Research: Methods and Instruments. 2013; Wiley-VCH Verlag GmbH & Co KGaA. 7–75. DOI: http://dx.doi.org/10.1002/9783527653218.ch2 .
- Buchholz B. , Böse N. , Ebert V . Absolute validation of a diode laser hygrometer via intercomparison with the German national primary water vapor standard. Appl. Phys. B. 2014; 116: 883–899. DOI: http://dx.doi.org/10.1007/s00340-014-5775-4 .
- Buchholz B. , Kühnreich B. , Smit H. G. J. , Ebert V . Validation of an extractive, airborne, compact TDL spectrometer for atmospheric humidity sensing by blind intercomparison. Appl. Phys. B. 2013; 110: 249–262. DOI: http://dx.doi.org/10.1007/s00340-012-5143-1 .
- Frey W. , Eichler H. , de Reus M. , Maser R. , Wendisch M. , co-authors . A new airborne tandem platform for collocated measurements of microphysical cloud and radiation properties. Atmos. Meas. Tech. 2009; 2: 147158. DOI: http://dx.doi.org/10.5194/amt-2-147-2009 .
- GCOS. WMO . Implementation Plan for the Global Observing System for Climate in Support of the UNFCCC. DOI: http://dx.doi.org/10.1007/s00585-999-1218-7 .
- Gettelman A. , Hoor P. , Pan L. L. , Randel W. J. , Hegglin M. I. , co-authors . The extratropical upper troposphere and lower stratosphere. Rev. Geophys. 2011; 49: RG3003. DOI: http://dx.doi.org/10.1029/2011rg000355 .
- Gierens K. , Schumann U. , Helten M. , Smit H. , Marenco A . A distribution law for relative humidity in the upper troposphere and lower stratosphere derived from three years of MOZAIC measurements. Ann. Geophys. 1999; 17: 1218–1226. DOI: http://dx.doi.org/10.1007/s00585-999-1218-7 .
- Gierens K. , Schumann U. , Helten M. , Smit H. , Wang P . Ice-supersaturated regions and subvisible cirrus in the northern midlatitude upper troposphere. J. Geophys. Res. 2000; 105: 22743–22753. DOI: http://dx.doi.org/10.1029/2000JD900341 .
- Gierens K. M. , Schumann U. , Smit H. G. J. , Helten M. , Zängl G . Determination of humidity and temperature fluctuations based on MOZAIC data and parametrisation of persistent contrail coverage for general circulation models. Ann. Geophys. 1997; 15: 1057–1066. DOI: http://dx.doi.org/10.1007/s00585-997-1057-3 .
- Helten M. , Smit H. , Kley D. , Ovarlez J. , Schlager H. , co-authors . In-flight comparison of MOZAIC and POLINAT water vapor measurements. J. Geophys. Res. 1999; 104: 26087–26096. DOI: http://dx.doi.org/10.1029/1999JD900315 .
- Helten M. , Smit H. , Sträter W. , Kley D. , Nedelec P. , co-authors . Calibration and performance of automatic compact instrumentation for the measurement of relative humidity from passenger aircraft. J. Geophys. Res. 1998; 103: 25643–25652. DOI: http://dx.doi.org/10.1029/98JD00536 .
- Kley D. , Smit H. G. J. , Nawrath S. , Luo Z. , Nedelec P. , co-authors . Tropical Atlantic convection as revealed by ozone and relative humidity measurements. J. Geophys. Res. 2007; 112: D23109. DOI: http://dx.doi.org/10.1029/2007JD008599 .
- Kley D. , Stone E . Measurement of water-vapor in the stratosphere by photo-dissociation with Ly-alpha (1216 A) light. Rev. Sci. Instrum. 1978; 49: 691–697. DOI: http://dx.doi.org/10.1063/1.1135596 .
- Krämer M. , Schiller C. , Afchine A. , Bauer R. , Gensch I. , co-authors . Ice supersaturations and cirrus cloud crystal numbers. Atmos. Chem. Phys. 2009; 9: 3505–3522. DOI: http://dx.doi.org/10.5194/acp-9-3505-2009 .
- Lucas J. M. , Saccucci M. S . Exponentially weighted moving average control schemes: properties and enhancements. Technometrics. 1990; 32: 1–12. DOI: http://dx.doi.org/10.2307/1269835 .
- Luo Z. , Kley D. , Johnson R. H. , Smit H . Ten years of measurements of tropical upper-tropospheric water vapor by MOZAIC. Part I: climatology, variability, transport, and relation to deep convection. J. Clim. 2007; 20: 418–435. DOI: http://dx.doi.org/10.1175/JCLI3997.1 .
- Luo Z. , Kley D. , Johnson R. H. , Smit H . Ten years of measurements of tropical upper-tropospheric water vapor by MOZAIC. Part II: assessing the ECMWF humidity analysis. J. Clim. 2008; 21: 1449–1466. DOI: http://dx.doi.org/10.1175/2007JCLI1887.1 .
- Marenco A. , Thouret V. , Nedelec P. , Smit H. , Helten M. , co-authors . Measurement of ozone and water vapor by Airbus in-service aircraft: the MOZAIC airborne program. An overview. J. Geophys. Res. 1998; 103: 25631–25642. DOI: http://dx.doi.org/10.1029/98JD00977 .
- May R. , Webster C . Data processing and calibration for tunable diode-laser harmonic absorption spectrometers. J. Quant. Spectrosc. Radiat. Tran. 1993; 49: 335–347. DOI: http://dx.doi.org/10.1016/0022-4073(93)90098-3 .
- Meyer J. , Rolf C. , Schiller C. , Rohs S. , Spelten N. , co-authors . Two decades of water vapor measurements with the FISH fluorescence hygrometer: a review. Atmos. Chem. Phys. Discuss. 2015; 15: 7735–7782. DOI: http://dx.doi.org/10.5194/acpd-15-7735-2015 .
- Miloshevich L. M. , Paukkunen A. , Vomel H. , Oltmans S. J . Development and validation of a time-lag correction for Vaisala radiosonde humidity measurements. J. Atmos. Ocean. Technol. 2004; 21: 1305–1327. DOI: http://dx.doi.org/10.1175/1520-0426(2004)021<1305:DAVOAT>2.0.CO;2 .
- Neis P. , Smit H. G. J. , Krämer M. , Spelten N. , Petzold A . Evaluation of the MOZAIC Capacitive Hygrometer during the airborne field study CIRRUS-III. Atmos. Meas. Tech. 2015; 8: 1233–1243. DOI: http://dx.doi.org/10.5194/amt-8-1233-2015 .
- Petzold A. , Thouret V. , Gerbig C. , Zahn A. , Brenninkmeijer C. A. M. , co-authors . Global-scale atmosphere monitoring by in-service aircraft current achievements and future prospects of the European research infrastructure IAGOS. Tellus B. 2015; 67: 28452. DOI: http://dx.doi.org/10.3402/tellusb.v67.28452 .
- Smit H. G. J. , Sträter W. , Helten M. , Kley D . Environmental Simulation Facility to Calibrate Airborne Ozone and Humidity Sensors. 2000; Jülich: Forschungszentrum, Zentralbibliothek. Technical Report No. 3796, Berichte des Forschungszentrums Jülich.
- Smit H. G. J. , Rohs S. , Neis P. , Boulanger D. , Krämer M. , co-authors . Technical note: reanalysis of upper troposphere humidity data from the MOZAIC programme for the period 1994 to 2009. Atmos. Chem. Phys. 2014; 14: 13241–13255. DOI: http://dx.doi.org/10.5194/acp-14-13241-2014 .
- Smit H. G. J. , Volz-Thomas A. , Helten M. , Paetz W. , Kley D . An in-flight calibration method for near-real-time humidity measurements with the airborne MOZAIC sensor. J. Atmos. Ocean. Tech. 2008; 25: 656–666. DOI: http://dx.doi.org/10.1175/2007JTECHA975.1 .
- Spichtinger P. , Gierens K. , Leiterer U. , Dier H . Ice supersaturation in the tropopause region over Lindenberg, Germany. Meteorol. Z. 2003; 12: 143–156. DOI: http://dx.doi.org/10.1127/0941-2948/2003/0012-0143 .
- Wildmann N. , Kaufmann F. , Bange J . An inverse-modelling approach for frequency response correction of capacitive humidity sensors in ABL research with small remotely piloted aircraft (RPA). Atmos. Meas. Tech. 2014; 7: 3059–3069. DOI: http://dx.doi.org/10.5194/amt-7-3059-2014 .
- Zöger M. , Afchine A. , Eicke N. , Gerhards M. , Klein E. , co-authors . Fast in situ stratospheric hygrometers: a new family of balloon-borne and airborne Lyman alpha photofragment fluorescence hygrometers. J. Geophys. Res. 1999; 104: 1807–1816. DOI: http://dx.doi.org/10.1029/1998JD100025 .