
Abstract
This work presents the characterisation of the Aerosol Package for the European Research Infrastructure IAGOS (In-service Aircraft for a Global Observing System). Condensation particle counter (CPC) are used to measure the aerosol number concentration of the total and the non-volatile particles. The size distribution is measured by means of an optical particle counter (OPC) in the diameter range of 0.25–3 µm. In particular the OPC is characterised for (1) leakage, (2) flow and calibration stability over the expected IAGOS pressure range of 170 hPa to 1013 hPa, (3) OPC accuracy test by comparing extinction measurements with calculated values from Mie theory using the OPC size distribution and (4) the inter-instrumental precision. The CPC is characterised in the same pressure range for (1) the lower cut-off diameter, (2) the instrument accuracy by comparing with a reference instrument (Faraday Cup Electrometer, FCE) and (3) the instrument precision. We conclude that the IAGOS Aerosol Package is a fully automated, robust, low-maintenance instrument providing high precision measurements with good accuracy.
1. Introduction
The natural variability of aerosol particles both in space and time is still one of the largest sources of uncertainty in global climate models (IPCC, Citation2013). Whereas the overall cooling effect of the atmospheric aerosol on the global climate is well known and recognised (Schwartz et al., Citation2010; Rap et al., Citation2013), its impact on cloud formation and cloud microphysics (Clarke and Kapustin, Citation2010), cloud radiative forcing (Carslaw et al., Citation2013) and even on the modification of biological cycles (Mahowald, Citation2011) are identified but difficult to quantify. Consequently, the atmospheric aerosol is included in the list of essential climate variables (ECV) of the atmosphere domain which has been defined in the framework of the Global Climate Observing System (GCOS, Citation2010).
While ground-based networks for in-situ and remote-sensing measurements of aerosol properties are well developed (Holben et al., Citation2001; Pappalardo et al., Citation2014), no comparable infrastructure is available for corresponding in-situ measurements in the free troposphere, upper troposphere and lowermost stratosphere on a global scale. On the contrary, vertically resolved in-situ data of aerosol properties are urgently needed for model validation and improvement (Aquila et al., Citation2011; Mann et al., Citation2014).
The European Research Infrastructure IAGOS (In-service Aircraft for a Global Observing System; www.iagos.org) responds to the increasing requests for long-term, routine in-situ observational data by using commercial passenger aircraft as measurement platforms. The infrastructure is built from two complementary approaches: the IAGOS-CORE component comprises the implementation and operation of autonomous instruments installed on up to 20 long-range aircraft of international airlines for continuous measurements of important reactive gases and greenhouse gases, as well as aerosol particles, dust and cloud particles. The fully automated instruments are designed for operation aboard the aircraft in unattended mode for several weeks and the data are transmitted automatically. The complementary IAGOS-CARIBIC component consists of the monthly deployment of a cargo container equipped with instrumentation for a larger suite of components; see Petzold et al. (Citation2015) for more details.
The routine observations of aerosol particles aboard a single instrumented passenger aircraft during regular flights in the framework of IAGOS-CARIBIC (see www.caribic-atmospheric.com for more information) have demonstrated the significant gain of knowledge from these in-situ observations (Hermann et al., Citation2003, Citation2008; Heintzenberg et al., Citation2011; Ekman et al., Citation2012). In the framework of IAGOS-CORE, a compact and robust aerosol instrumentation package was developed. The operation of this instrument aboard a fleet of in-service aircraft is expected to provide significant data on aerosol climatologies and complement the observations provided by IAGOS-CARIBIC. The IAGOS Aerosol Package (referred to as P2c) includes components for the measurement of the aerosol particle size distribution and the integral numbers of particles and of non-volatile particle cores. The aerosol size information for the so-called accumulation mode (particle diameter 0.1–1 µm) covers the range of particles available for the formation of liquid water and ice clouds (Lohmann and Feichter, Citation2005; Levin and Cotton, Citation2009; DeMott et al., Citation2011). The total number concentration provides information on gas-to-particle conversion and particle nucleation at flight altitude level. The difference between the total and the non-volatile particle cores number concentration covers complementary information on the anthropogenic contribution to the atmospheric aerosol burden. Also, non-volatile soot particles emitted by aircraft are thought to play a role in the indirect aerosol effect on climate by acting as ice nuclei for cirrus particles (Zhou and Penner, Citation2014). Here, we first describe the design of this autonomous aerosol instrument followed by a summary of the standard operating procedure (SOP) (Section 3). The main parts are the characterisation of the optical particle counter (OPC) (Section 4), the thermodenuder (Section 5) and the condensation particle counter (CPC) (Section 6) in extensive laboratory tests.
2. Instrument design
Because of the aircraft platform the instruments have to fulfil the following requirements: (1) Automated, low-maintenance operation; the instrument is only accessible during regular maintenance of the aircraft (approximately every 3 months) and will be operated permanently during this time. (2) The instrument has to be leak-tight (pressurised cabin) and capable of operating at a cruise altitude equivalent pressure of 170 hPa. (3) Size, weight and power limits are L×W×H=560×400×283 mm; mass=30 kg and current max=15 A at 28 V limited by requirements of the carrier and the structure of the aircraft installation kit. (4) For security reasons V 0 flammability grade materials and an electrical performance according to RTCA/DO 160F are required. (5) High time resolution of 1 Hz provides a reasonable spatial resolution.
2.1. Constrains by aerosol inlet and sampling line
From a science perspective, we are aiming to cover a broad size range including the Aitken mode, the accumulation-mode and coarse-mode particle. The inlet which is a small, quasi-isokinetic, shrouded system is resting on a Rosemount footprint. Depending on the carrier requirements the envelope is restricted to a standard Pitot tube design for aircraft wind-speed measurements. The conductive inlet line of type Swagelock SS-XC4 with an inner diameter of inch is connected to P2c and to the inlet plate by Swagelock fittings. Computational fluid dynamic simulations using FLUENT™ of the Aerosol Inlet System (AIS) show that no coarse mode particles larger than D
50=2.5–3 µm are accessible at cruising altitude and speed. Due to diffusion losses along the sampling line no nucleation mode will pass to the instrument. Here 50 % (85 %) of 5 nm (13 nm) particles will penetrate to the instrument (P=150 hPa, T=293 K, 2.4 L/min total flow). A detailed characterisation of the AIS will be published separately. Following these requirements, we choose one instrument for measuring particle size distributions of the aerosol accumulation mode by light scattering techniques (OPC; GRIMM Model 1.129). To cover Aitken-mode particles we choose a butanol-based CPC of type GRIMM Model 5.411. Due to the calculated diffusion losses of the AIS, we adjust the CPC lower cut-off diameter D
50 to 13 nm to minimise the influence of the sampling line on the measurement. The inlet system will be characterised in detail in a separate publication. Because of the lightweight of the CPC instrument a second channel including a thermodenuder could be added. The dual-channel setup permits the separation of total aerosol particles and non-volatile aerosol particles. summarises the characteristics of the integrated instrument components, whereas presents the schematic of the instrument package design.
Fig. 1 Schematic setup of the IAGOS Aerosol Instrument. Aerosol particles are sampled using a quasi-isokinetic shrouded inlet by means of central vacuum unit (VAC). Flow rates through the individual instruments are kept constant by means of critical orifices. The double-walled container for butanol supply (BSC) and butanol reservoir (BRC) are statically pressurised to the inlet pressure. The exhaust of the VAC is connected to the sample outlet. In case of fire an overpressure of butanol is discharged via release valves connected to the outlet.
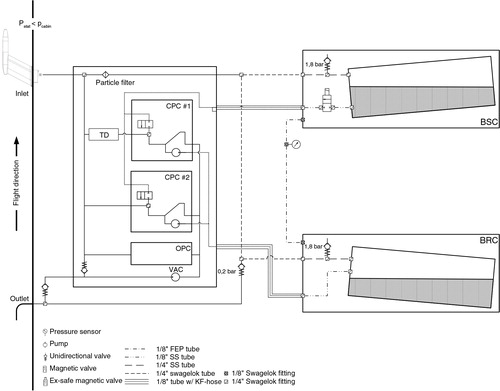
Table 1. Instrument components integrated in the IAGOS aerosol package
2.2. Optical particle counter
The OPC is a central part of the IAGOS aerosol instrument that measures the particle size distribution in the diameter range from 0.25 µm to super-µm size by light scattering. The aerosol flow crosses a focused beam of a Class 3B laser diode emitting at 655 nm. Light scattered by particles in the optical volume of the OPC is detected by a photo detector inside the instrument housing. The instrument infers the particle size from the amplitude of the light pulse scattered by the individual particles while crossing the laser beam. The instrument has two different fast operational modes. The first mode counts particles in 32 scattering pulse amplitude bins with a time resolution of 6 s, the second uses 16 bins with 1 s time resolution. The corresponding sizing ranges are µm for the first and
µm for the second mode. The schematic of the instrument is shown in . Regularly the 1 Hz, 16-channel mode is used. The optical design is based on the wide-angle collection of light scattered under a mean scattering angle of 90 ° by means of a parabolic mirror which covers an angular range of 120 °. In addition, light scattered into an angular range of 18 ° is detected directly by the photo-detector. This wide-angle optical setup increases the total amount of scattered light detected by the photo sensor and allows detection of particles as small as 250 nm in diameter. The pulse amplitude histogram provided by the instrument electronics is transferred into a particle size distribution by relating the pulse amplitude to a particle size, making reasonable assumptions on particle shape (spherical, Mie-theory) and complex refractive index. shows the theoretical response function of the OPC calculated for different refractive indices, i.e. different materials. Channel limits are indicated. It demonstrates the relative insensitivity of the optical design to Mie ambiguities of the scattered light; see also Heim et al. (Citation2008) for details. The associated lower channel limits of the GRIMM Model 1.129 OPC are compiled in . The IAGOS OPC has been developed on the basis of the existing instrument GRIMM Model 1.109. An issue of the predecessor instrument (GRIMM Model 1.109) concerns the sample flow rate, measured under ambient conditions of temperature and pressure, which increases when the sample pressure decreases influencing stability of the relationship between light pulse amplitude and particle diameter. Therefore, the Model 1.109 OPC was not suitable for the application in the IAGOS aerosol payload. Consequently, a new OPC with an adapted flow system with flow control was designed that meets the special requirements of the application within IAGOS, built and is now purchasable as GRIMM Model Sky OPC 1.129.
Fig. 2 Schematic Sky OPC: The optical design is based on the wide-angle collection of light scattered under a mean scattering angle of 90 ° by means of a parabolic mirror which covers an angular range of 120 °. In addition, light scattered into an angular range of 18 ° is detected directly by the photodetector.
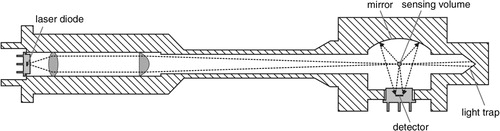
Fig. 3 Theoretical response function (depending on the given geometry of the OPC optics) calculated for different particle types [polystyrene latex (PSL), ammonium sulphate (AS) and di-ethyl-hexyl-sebacate (DEHS)].
![Fig. 3 Theoretical response function (depending on the given geometry of the OPC optics) calculated for different particle types [polystyrene latex (PSL), ammonium sulphate (AS) and di-ethyl-hexyl-sebacate (DEHS)].](/cms/asset/16626883-4e9f-47dd-8f58-010e75b57482/zelb_a_11817324_f0003_ob.jpg)
Table 2. Lower limit for PSL, ammonium sulphate (AS) and di-ethyl-hexyl-sebacate (DEHS) per channel
Here, the sample flow rate, as well as the flow rate of the flush air used to keep mirrors and lenses in the optical cavity particle free, is independently controlled by two critical orifices. Those ensure a constant volume flow rate independently of the absolute pressure upstream the orifice as long as the pressure on the orifice downstream side is at most half as large as on the upstream side. The GRIMM Model 1.129 OPC uses its small internal pump for driving the flush air, while the sample flow is driven by an external vacuum source. The improved flow system keeps the sample flow in the GRIMM Model 1.129 OPC constant even with varying system pressure from sea level down to 170 hPa as it occurs while operating the OPC aboard passenger aircraft. Conducted instrument evaluation tests will be discussed in Section 4.
2.3. Condensation particle counter
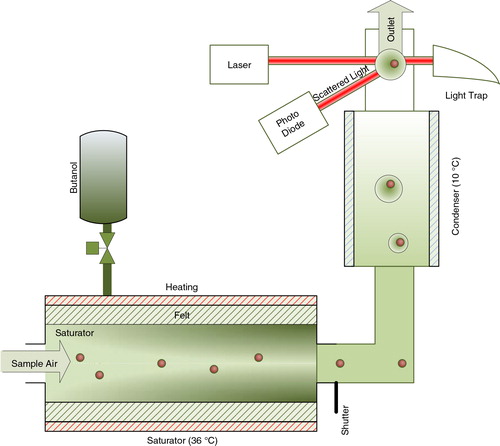
The CPC GRIMM Model 5.411 core is a conventional cooling type CPC. A schematic is shown in . This type of CPC operates on a single sample flow containing both the supersaturated working fluid and the aerosol to be measured. The conductive cooling type CPC experiences reduced detection efficiencies at pressures below 150 hPa (Hermann et al., Citation2005). Anticipating the results of the laboratory test (see Section 6), this instrument fulfils the requirements for a CPC installed as part of the IAGOS aerosol instrument: Thus: (1) the design is robust and leak-tight; (2) the temperature difference of condenser and saturator is adjustable in order to harmonise and adjust the lower cut-off of different instruments to 13 nm; (3) the dependence of the detection efficiency as function of pressure is reproducible; and (4) the instrument is powered using 28V DC.
Fig. 4 Schematic of a conductive cooling type Sky CPC. A sample flow is exposed to a butanol saturated environment called the saturator. Downstream of the saturator the flow is cooled in the condenser. Due to thermodynamical reasons a supersaturated butanol atmosphere is established. Here particles will grow by condensation. Thus, particles passing a laser beam are detected by their scattered light by means of a photo diode.
2.4. Thermodenuder
The thermodenuder consists of a heated stainless steel tube. In principle volatile compounds are removed from the particle depending of the thermodenuder temperature (Clarke, Citation1991). We choose a design with an inner diameter of 9 mm and a length of 0.2 m. A proportional-integral-derivative controller (PID controller) powering the heating coil keeps the temperature constant at 250 °C. The adsorption section is realised using an unheated stainless steel tube to the CPC. Conducted tests will be discussed in Section 5.
3. Standard operating procedure
Instrument operation, maintenance and test procedures are described in detail in the standard operating procedure (SOP) documents for all IAGOS instruments. These documents are currently under review and will be published and regularly updated using revision control on the IAGOS Homepage at www.iagos.org. A brief summary is given in the following.
3.1. Instrument operation
The instrument operates fully automated. The functions of the instrument are controlled by a single board PC via an interface board using LabVIEW™ software which also records the relevant signals of the detectors (OPC signal, CPC signals, temperatures, pressures). Externally required provisions for instrument operation are a 28 V power supply and the Weight-on-Wheel (WoW) signal of the aircraft. The instrument uses the WoW signal to switch between standby (on ground) and normal operation (in air). When the aircraft is on ground, the instrument is in standby [instrument power is on, Data Acquisition System (DAS) is running and instrument components are switched on]. When WoW is set to zero (in air), the pump (VAC) is switched on and the measurement program starts data storage.
The operation of P2c requires connection to an inlet line and to an exhaust line.
3.2. Maintenance and calibration
The following checks are mandatory before and after each deployment: (1) Visual inspection for loose, broken or overheated parts, to be identified by discoloration. (2) Verification of electrical load during start up and operation (specified value: max. 8 A, acceptable range ±10 %) (3) Verification of leakage rate (specified value: <25 hPa/h) (4) Determination of the volumetric flow through the instrument by means of a DryCal (or equivalent) flow meter (specified 2.4 L/min, acceptable range ±10 %). (5) Determination of instrument background with zero air filtered with PALL HEPA filter capsule (specified values: N CPC<1 cm−3, N OPC<1 cm−3) at low pressure conditions of P=200 hPa. (6) Determination of instrument response with NaCl aerosol (refractory at TD temperature of 250 °C) against the Jülich reference CPC and OPC units. (7) Adjustment of the CPC lower cut-off diameter to 13 nm by altering the temperature difference of condenser and saturator. (8) Determination and adjustment of OPC channel thresholds by polystyrene latex (PSL) spheres of nominal diameters 300 nm, 450 nm and 800 nm.
3.3. Calibration methodology and standards
The instrument calibration procedure follows the calibration procedures of Global Atmosphere Watch (GAW) World Calibration Center for Aerosols; see e.g. Hermann and Wiedensohler (Citation2001); Rosenberg et al. (Citation2012). In summary, instrument components will be compared to reference instruments maintained at Forschungszentrum Jülich. These reference instruments have to be calibrated once per year by the instrument provider against a primary standard defined by the German Metrology Institute (Physikalisch-Technische Bundesanstalt) in Braunschweig.
3.4. Data flow and error analysis
Counting rates of CPC and OPC are recorded on a 1 Hz basis. CPC counting rates are converted to number concentrations and OPC as particle number concentrations per size bin by division by the volumetric flow rate. Data and instrumental parameters are stored locally as binary files. Number concentration data provided by the sensor units (N
instr) have to be corrected for standard pressure and temperature conditions (N
STP) from the ideal gas law by using pressure and temperature data measured inside the instrument (index ‘instr’) and standard pressure and temperature conditions (index STP; P
STP=1013.25 hPa, T
STP=273.15 K).1
The statistical uncertainty of the particle concentration measurements (CPC/OPC) arises from Poisson counting statistics whereby the statistical uncertainty σ
N
of a measured concentration N is given by (in percent)2
According to the Gauss error propagation law using eq. (1) the errors for N
CPC and N
OPC at STP conditions are derived as (N
STP corresponds to N
CPC and N
OPC at STP conditions, respectively):3
where
For each individual calculation of the number concentration at STP conditions by eq. (1), the associated error can be calculated using eq. (3). The error of the particle number concentration at STP conditions calculated for cruise level (P
inst=250 hPa, T
instr=230 K) conditions is of the order of 6 %. It is dominated by the instrumental number concentration measurement error ΔN
instr=5 % (Petzold et al., Citation2011). A minor contribution (<1 %) is associated with measurement errors of temperature and pressure which are conservatively estimated to be ΔT
instr=0.2 K, ΔP
instr=2 hPa.
4. Evaluation of IAGOS P2c optical particle counter OPC
In this section the OPC is characterised. We performed (1) a leak-tightness test, (2) a test estimating for the accuracy at ground base pressure, (3) a test for stability of the calibration at low pressure condition and finally (4) a test to estimate the system precision.
4.1. Test for leak-tightness
To test the OPC flow system for gas leaks when operated with an internal system pressure significantly lower than the conditions surrounding the instrument, the OPC was sealed at its sample inlet. The outlet was connected to the vacuum source. The system was evacuated down to 150 hPa, the vacuum source sealed off and the pressure increase inside the instrument monitored over time with a pressure transducer. This was done twice, once with the instrument switched on and once switched off. The instrument performed as specified. The instrument was also supplied with particle free air down to system pressures of 150 hPa. As specified, the instrument did not count any particles under these conditions.
4.2. Test of apparent ‘accuracy for application’
In order to test the accuracy of the OPC, we have to reference the size distribution measurement to an independent method. Most of the user will use the OPC size distribution to calculate particle optical properties. Thus, we choose to calculate the extinction coefficient using the OPC size distribution of optically well characterised latex spheres and compare the results with measured extinction coefficients using the CAPS (Cavity Attenuated Phase Shift) PMex instrument from Aerodyne Research (Massoli et al., Citation2010). The instrument measures the extinction as an absolute instrument. This study is already published by Petzold et al. (Citation2013) and the main result is shown in . Briefly, the measured and calculated extinction coefficients show a highly significant correlation of:
Fig. 5 The figure shows a comparison of extinction at a wavelength of 630 nm measured by the CAPS PMex instrument (y-axis) versus the extinction calculated for PSL spheres using the full size distribution information measured by the GRIMM OPC 1.129. During the experiment PSL nominal sizes and number concentration where varied. The regression line parameters for slope m and offset a as well as their standard deviation are shown.
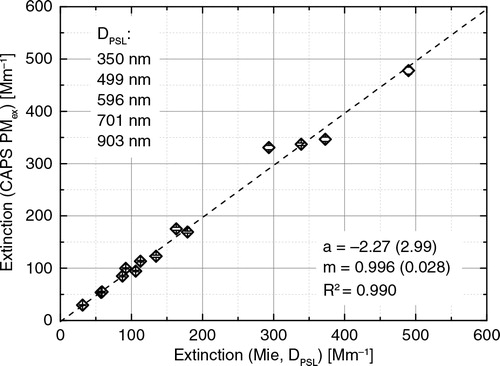
So we estimate the ‘accuracy for application’ of the used size distribution measurement to 3 % which is actually a sensitivity analysis for Mie calculations.
4.3. Test of stability of calibration with decreasing internal pressure
Another requirement for operating an OPC aboard an aircraft for measuring the ambient particle size distribution is the stability of the OPC calibration with varying internal system pressure. The amount of interaction of an aerosol particle with incident electromagnetic radiation is quantified independently of the incident radiation intensity by the particle’s scattering cross section. A particle with a given scattering cross section causes a light pulse in the OPC characterised by its amplitude, expressed as voltage. The instrument factor that describes the OPCs calibration is nothing else than the constant of proportionality (factor m) between particle scattering cross section in cm2 and light pulse amplitude in V. Knowledge of this constant, together with the pulse amplitudes marking the boundaries of the OPC size bins, allows to transfer the histogram of light pulse intensities measured by the OPC into a particle size distribution.
An OPC is calibrated by supplying it with laboratory test particles of known chemical composition, i.e. refractive index, size and (spherical) shape. While keeping the chemical composition (refractive index, shape) constant, the particle size is varied to align consecutively with each size bin boundary. Knowing the particle refractive index and shape, the particle scattering cross sections that mark the bin boundaries can be calculated using Mie-theory (). The particle scattering cross sections at the bin boundaries are then correlated with the preset pulse amplitudes at the bin boundaries to obtain the instrument factor m.
Fig. 6 OPC calibration using {299; 404; 499; 709 nm} PSL particles. The count probability which is defined by the channel count number divided by the total number of particles counted is plotted per OPC channel for two OPC instruments and for different PSL particles sizes. The response of an ideal OPC is added as hatched area.
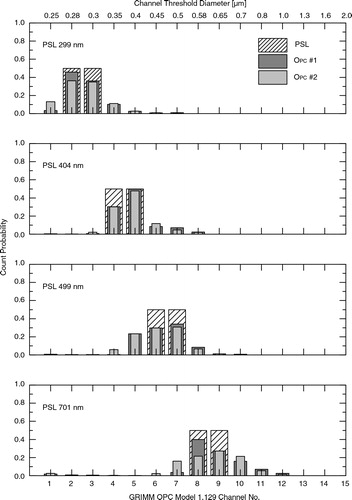
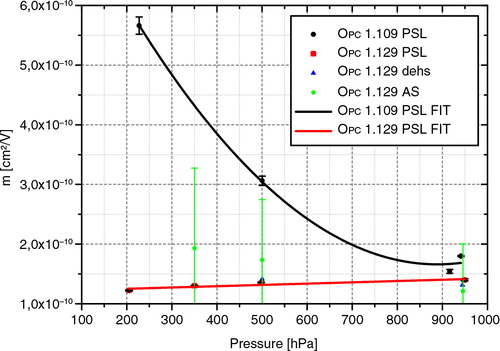
We conducted such OPC calibration measurements and determined the instrument factor m for different system pressure levels and different test particles. summarises the results. For comparison reason also the GRIMM Model 1.109 OPC is included in this figure. This instrument fails the requirements for IAGOS application due to the pressure dependence of the system flow-rate as described in Section 2.2. The instrument shows consequently a pressure dependence of the instrument factor m. If the sample flow increases with decreasing system pressure, the particle residence time within the illuminating laser beam decreases too. Since the amplifier conditioning the scattering pulse shows a time-dependent response, the decreasing residence time of the particles within the laser beam causes a corresponding decrease in scattering pulse amplitude. This causes the observed dependence of the instrument factor m on GRIMM Model 1.109 system pressure. The improved GRIMM Model 1.129 OPC with a stable sample volume flow does not show any significant dependence of the factor m on system pressure. Consequently the calibration of the instrument is stable for different pressure levels. This has been verified not only with PSL particles, but also with di-ethyl-hexyl-sebacate (DEHS) and ammonium sulphate particles.
Fig. 7 This graph shows the instrument factor m for the IAGOS OPC (1.129) and for the non-modified predecessor OPC (1.109) as a function of the pressure. The factor m represents the instrumental calibration factor. Thus, size bin thresholds are defined by the product of m and the theoretical response function. The old design shows a significant pressure dependence whereas the modified IAGOS OPC (1.129) shows no significant pressure dependence of factor m.
4.4. OPC test of precision
In this section results from a side-by-side testing of two identical OPC instruments are reported. shows the results from parallel measurements of laboratory test aerosols measured by two GRIMM Model 1.129 instruments. The average ratio of total number concentrations reported by these instruments is 1.02 (r 2=0.997) as determined by linear regression analysis. The instruments report total number concentrations very precisely. Respective ratios of number concentrations are summarised in . Differences in reported number concentrations are observed when individual channel values are considered. shows the average ratio between Model 1.129 instrument #1 and instrument #2 for individual channels. The standard deviation is shown as an error bar. Correlation coefficients are still very high, but ratios between instruments differ in statistically significant way. As a result the channel thresholds for each individual instrument have to be controlled and adjusted against a ‘golden standard’ instrument during a maintenance cycle in order to harmonise the different measurements.
Fig. 8 OPC precision test: The plot shows the scatterplot of the total number concentration of two GRIMM Model 1.129 Sky-OPC instruments measuring laboratory test aerosols in a wide range of particle number concentration. In the plot the one-to-one correlation, the ±5 % margin and the linear regression parameters are shown.
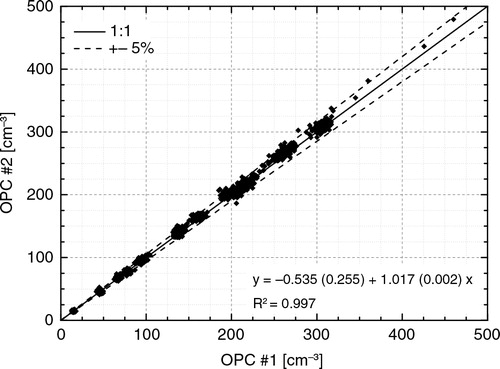
Fig. 9 This figure compiles ratios of number counts for individual sizing channels of two parallel measuring OPC. Considering the standard deviation indicated as error bars, the individual channels deviates from the one-to-one correlation significantly.
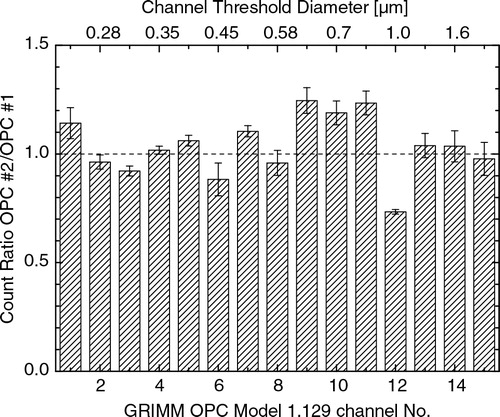
Table 3. Average ratio of number concentrations measured by two GRIMM Model 1.129 Sky-OPC instruments under different conditions; airborne measurements were performed during research flights in July 2008 over Greenland
5. Evaluation of IAGOS P2c thermodenuder TD
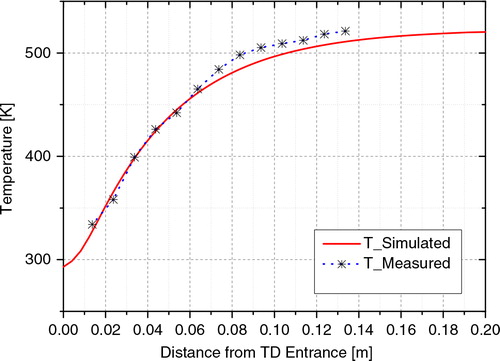
The temperature profile of the thermodenuder was calculated using 3D computational fluid dynamic simulation software FLUENT™ Ver. 16.0. Because of the low Reynolds-number associated with the flow rate of 0.6 L/min and a diameter of 9 mm we used the laminar flow model (Mesh: 3816 Nodes, 2982 Elements). According to Clarke (Citation1991) ammonium sulphate and sulphuric acid is completely removed at 235 °C and 150 °C, respectively. The temperatures where reached at 11 and 4 cm distance from the thermodenuder inlet, respectively. We also measured the temperature at the centerline using a micro thermoelement. The measurement results are plotted overlying the calculated temperature profile along the centerline of the thermodenuder in . The model results and associated measurements agree well in the first 7 cm. Measurement and model deviate slightly starting at distances of 7 cm from the thermodenuder entrance. Here, introduced micro turbulence by the sensor may affect the measurement result. The thermodenuder operates like it is expected. At the given flow rate aerosol particles will face a temperature higher than 235 °C for approximately 1 second duration. Using ammonium sulphate particles as test substances more than 93 % out of 21 000 particles are removed. The residual 7 % fraction of particles is constant for different particle number concentrations used. Thus, the residual fraction is supposed to be caused by contaminations of the used ammonium sulphate.
Fig. 10 The graph shows the calculated and measured temperature profiles along the thermodenuder centerline. The model-calculation is shown as a solid line and measurements are marked with an asterisk. Model calculation and measurements show similar results. The measurement deviates from calculation starting at 0.06 m distance which may be caused by microturbulence induced by the micro temperature sensor.
6. Evaluation of IAGOS P2c condensation particle counter CPC
In this section the CPC cores of type GRIMM Model 5.411 are characterised as follows.
First, the experimental setup is introduced. Using a Faraday Cup Electrometer (FCE) as reference instrument a multi-charge correction has to be applied. Here the theoretical background is introduced. The empirical coincidence correction of the GRIMM CPC will be examined. Finally a side-by-side precision-test at ground level pressure is shown followed by a cut-off characterisation as function of system pressure. The independent FCE measurements are used to determine the system accuracy.
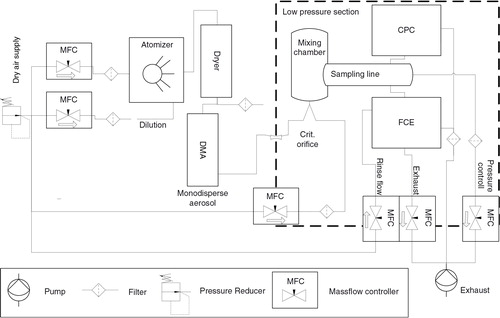
6.1. Experimental setup
The experimental setup is shown in . Ammonium sulphate particles are produced from a 0.625 % molar solution using a TSI 3076 constant output atomizer. The flow to the atomizer, as well as the dilution flow, was controlled by Bronkhorst Mass-Flow Controller (MFC), series ‘low-ΔP-Flow™’. Particles are subsequently dried using a diffusion dryer before classification using a Vienna-type Differential Mobility Analyzer (DMA) (GRIMM ‘M-DMA’, active length 8.8 cm, inner diameter 2.6 cm, outer diameter 4 cm) controlled by a GRIMM DMA controller (Type 5.706).
Fig. 11 Setup of the low pressure cut-off experiment. Particles are produced by means of a constant output atomizer Type TSI 3076. Particles are subsequently dried, charged and size selected by means of a DMA/americium diffusion charger. Monodisperse particles enter the low pressure section via a critical orifice and are further diluted by a particle free flow. The pressure in this section is actively controlled by means of a mass flow controller (MFC). An aerosol splitter provides the aerosol flow for the test candidate CPC and the reference instrument FCE.
In principle a DMA selects particles with a certain electrical mobility range. Assuming single-charged particles this electrical mobility range corresponds to a certain particle size range (see Appendix). In this setup particles are charged by diffusion using an Americium 241Am charger (type GRIMM 5.525). Charged particles are injected in a laminar particle free sheath flow at the outer wall side of the Vienna type classifier. An adjustable high voltage is applied between the outer wall and the inner rod. Thus, charged particles are accelerated towards the electrode of opposite polarity. Due to the sheath flow, smaller particles will be removed by hitting the inner rod close to the injection point whereas larger particles will reach the inner wall further downstream. Particles of a certain electrical mobility are selected by entering a small slid in the inner rod. These selected particles are further called monodisperse aerosol. The particle size of the monodisperse aerosol is easily varied by changing the high voltage level (see Appendix).
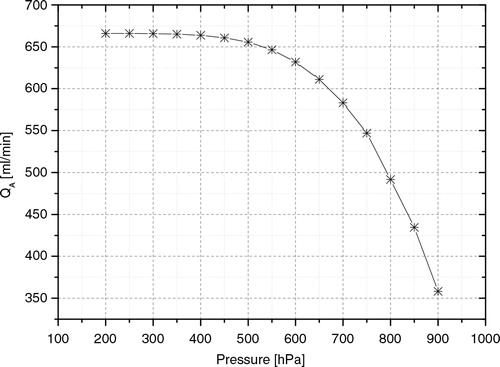
Monodisperse aerosol enters the low-pressure section via a critical orifice with a nominal volume flow of 0.655 L min−1 with respect to atmospheric pressure. The critical orifice limits also the aerosol ‘In’ flow Q A of the DMA by mass balance. The latter influences the selected particle size range [see eqs. (A1, A2), (A4) in the Appendix]. The actual aerosol flow rate Q A was measured as function of the pressure of the sample line and plotted in .
Fig. 12 This graph shows the measured volume flux QA limited by the critical orifice as a function of the pressure of the sampling line (with respect to ambient pressure of 1013 hPa) during the experiment.
Downstream of the critical orifice the aerosol particles relax in a mixing chamber. They are further diluted by means of a MFC operated for constant volume flux. The aerosol flow is split for the test candidate CPC and the reference FCE. In principle a FCE determines the number concentration of charged particles by measuring the associated current. Here, we used a GRIMM 5.705 FCE as reference instrument. The GRIMM FCE has a sensitivity of 0.1 fA (1 Hz, 600 charged particles s −1) and an automatic zero point adjustment. The reference volume flux is controlled by the difference of the FCE exhaust flow and the rinse flow, which are also controlled by MFCs operated for constant volume flux. The benefit of the experimental setup is that both the reference instrument and the test candidate are located in the low-pressure section. Thus, particle losses at the critical orifice have no influence on the results.
The experiments are controlled automatically by a LabVIEW™ program. Here, for a series of different pressure level the DMA voltage is adjusted for a series of certain electrical mobility equivalent particle diameter.
6.2. Multi-charge correction
Using a diffusion charger in combination with a DMA and using FCE as reference instrument it has to be taken into account that particles passing the DMA may carry multiple charges. If a particle exiting the DMA carries n charges the FCE will count these particle n times whereas a CPC will register just one particle. Thus, a multi-charge correction has to be applied to the FCE data: The FCE number concentration is described by eq. (5)
5
For technical reasons – only charged particle will pass the DMA – and as a good approximation we limit the sum to {1≤n≤2}. Thus, only single and double charged particles are considered. Here, N*(D
p
) denotes the ‘true’ particle number per time interval as function of the electrostatic mobility particle diameter D
p
(U, n), U denotes the DMA voltage and η(n, D
p
) the normalised charge distribution of particles carrying n charges. For the latter, we use the approximation by Wiedensohler (Citation1988):6
the approximation coefficients a
i
are defined in . Thus, reads as follows:
7
Table 4. Approximation coefficients a i (n)
Equivalent to eq. (7) the number concentration N
CPC of the CPC is given by:8
Thus, using eqs. (6 and 7) the ratio which gives the correction factor ξ(D
p
) to be applied to the FCE data derives to:
9
using10
The factor in eq. (10) is calculated using the size distribution measurement. Here, the diameters D
p
(U, n=1), D
p
(U, n=2) are associated with the different DMA voltages U. They are calculated solving the implicit eq. (A4) (see Appendix) numerically by using the method of successive approximation. The factor
in eq. (10) is calculated using eq. (6).
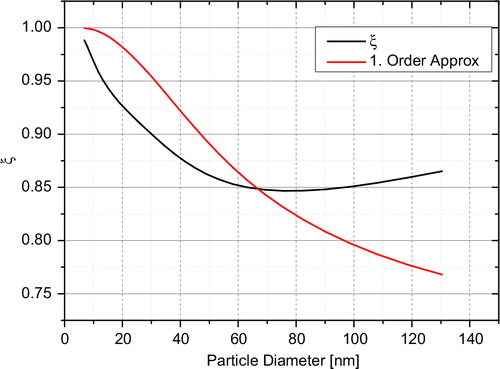
The applied correction factor ξ(D
p
) is plotted in . Here, the first order approximation of eq. (9) is also included by setting .
Fig. 13 The graph shows the multi-charge correction factor ξ(Dp) as a function of the particle diameter. The red line shows the first order approximation ignoring the actual size distribution by setting C =1. The first order approximation deviated significantly (up to 15 %) from the ξ(Dp) curve. Thus, the actual size distribution measurement has to be considered calculating parameter C .
The Final FCE data correction function reads:11
6.3. Coincidence correction
At high particle number concentrations like they are used in our low-pressure experiments, we have to consider that two or more particles might be present in the detection volume. The GRIMM CPC Model 5.411 has an empirical coincidence correction implemented in the firmware.
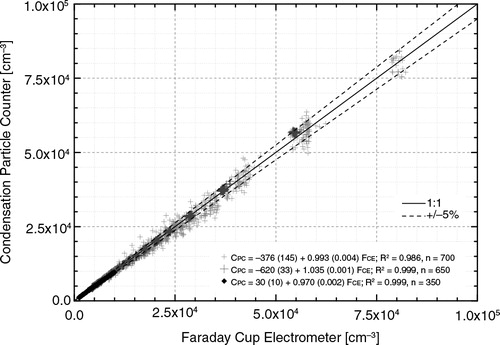
In order to prove the empirical coincidence correction we conducted measurements at high number concentration of up to 80 000 particle cm −3 using the GRIMM FCE as reference (see also ). The accuracy for the coincidence corrected data is ±3.5 % (see linear regression for high particle concentrations). The empirical correction is not documented for users. According to the manual the empirical coincidence correction is about 10 % at 23 500 particles per cm
3. In the following we compare this value to a general theoretical description given by eq. (12) by Zhang and Liu (Citation1991).12
Fig. 14 CPC accuracy test: The graph shows the scatterplot of number concentrations measured with the GRIMM CPC versus the reference GRIMM FCE. The one-to-one correlation as well as ±5 % boundaries and the linear regression analysis is shown.
Solving eq. (12) for τ we derive:13
Using N a /N i =1.10, N a =23 500 and Q=10 cm3/s the effective time of particles in detection volume calculates to τ=4.05 10−7 s. This value is comparable to the rise time of 3.98 10−7 s of the raw CPC optical signal measured with an oscilloscope and also matches instrumental constants reported for TSI CPCs. Thus, the empirical correction seems to be comparable to this commonly used correction.
6.4. CPC test of accuracy at ground-level pressure conditions
Comparison measurements were performed using the GRIMM FCE as reference instrument. Here, we have analysed experimental data at 900 hPa for particles larger than 20 nm described in Section 6.1 and calculated the inter-instrument correlation. In order to test the instrument at high number concentration we choose a sheath flow to aerosol flow ratio of 4:1 to select a broader particle size using the DMA. The latter data show a larger scatter and are plotted as large crosses in . We have separated the linear regression calculation for the different experimental setups (up to 10 000 particle cm−3) and high concentration measurement setup described above.
For low particle concentration of up to 10 000 particle cm−3 the linear regression line reads:14
For higher number concentration, please refer to . In summary the reported accuracy including all measurements is ±3 %.
6.5. CPC test of precision at ground-level pressure conditions
In this section the inter-instrument variability is checked using two different GRIMM CPCs (see ). The different instruments agree well with a slope of 0.966±0.001 over an wide dynamic range of 0≤N≤21 000 cm−3.
Fig. 15 CPC precision test: The scatterplot of two identical CPC instruments of type GRIMM 5.411 are shown. The number-density of NaCl particles are varied in the range up to 20 000 particle per cm−3.
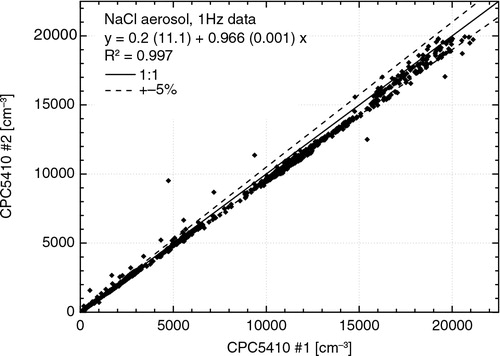
The regression line is calculated as:15
6.6. CPC cut-off diameter as function of pressure
The temperature difference of the condenser and saturator of the IAGOS CPC are adjusted for a D
50=13 nm at 900 hPa. In this section the pressure dependence of the cut-off diameter D
50 of the GRIMM Model 5.411 is investigated using the experimental setup as described in Section 6.1. The multi-charge correction is applied to FCE data using the correction factor ξ(D
p
) [see eq. (9)]. The cut-off is defined as the particle size where the CPC efficiency equals 0.5. The CPC efficiency is given as:16
During the experiment the individual DMA voltages (respectively the calculated particle diameter) where kept constant for 3 minutes. The first 20 seconds of an individual DMA voltage step were excluded as ‘transition’ measurements from the data analysed. This scan through the size-distribution was repeated five times.
compiles the results of the mean efficiency functions for the different pressure levels. The error bars show the individual variances for one particle size during the experiments. The solid lines show the fitted four-parameter-exponential function eq. (17) introduced by Banse et al. (Citation2001). The fitted parameters are compiled in . Solving eq. (17) for D
p
[see eq. (18)] and setting η=0.5 gives the D
50 cut-off diameter. The efficiency plateau value is derived by solving eq. (17) for the limit (6.6). Both values are also reported in .17
Fig. 16 This graph shows the CPC counting efficiency ξ(Dp) as a function of the particle diameter compiling results for 170, 200, 600 and 900 hPa pressure levels.
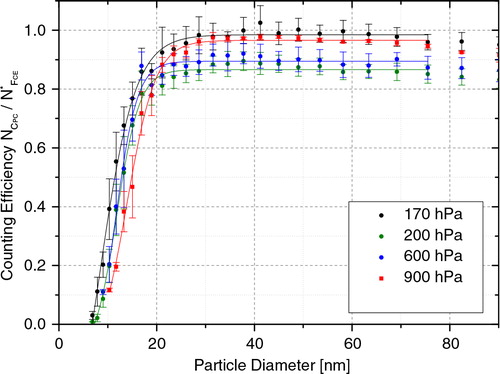
Table 5. Cut-off diameter as function of ξ for the given pressure level
using
18
19
The fits are highly significant passing the fitting-test at a level of 99 %
with a coefficient of determination of r
2>0.98 (compare
value of the test-statistic in ). Here, (1–α) denotes the level of significance, and m the degree of freedom. The D
50 cut-off diameter slightly increases from 11.4 nm up to 14.9 nm with a mean size of 13 nm±1 nm. The observed deviation is not significant with respect to the error bars. The efficiency plateau value η
∞=93±5 % shows a slight dependence on the pressure. All reported values are measured with ammonium sulphate particles as described in Section 6.1.
7. Summary and outlook
Summarising the results of the evaluation tests, we conclude that IAGOS P2c for aerosol measurements is a fully automated, robust, low-maintenance device providing high precision measurements with good accuracy. Following the rules defined in the standard operating procedures document the data-set produced will be homogenous on this high level. In particular the individual results are summarised for the subsystems as follows:
The GRIMM Model 1.129 Sky OPC reported ‘accuracy for application’ is estimated to be 4±1 %. Also the total particle number concentration is reported very precisely with an average instrument-to-instrument ratio of 0.99 (precision≤1 %). With respect to size-resolved data, instrument-to-instrument differences are observed which demonstrate the need for an instrument-specific calibration procedure.
The thermodenuder operates like it is expected. For approximately 1 second the aerosol will face a temperature higher than of 235 °C. The performance was demonstrated using ammonium sulphate particles.
The GRIMM Model 5.411 core CPC instruments report total particle number concentration with an accuracy of 3±1.5 % against FCE standard. Side-by-side operation of GRIMM CPC leads to an estimated precision of 3.4 %
Summarising the results from the low pressure tests of the GRIMM Model 5.411 CPC module the CPC efficiency is >86 % for particles with a diameter 20 nm for an operational pressure higher than 170 hPa. The mean cut-off diameter of about 13±1.25 nm shows only a slight variation with the pressure down to 170 hPa which is within the 1σ variability at a certain pressure level.
7.1. Outlook
The IAGOS P2c will be operational in spring 2016 if the European Aviation Safety Agency (EASA) certification is approved. On the long-term perspective the IAGOS fleet will increase to 20 aircrafts, of which up to five will be equipped with the aerosol package collecting a worldwide aerosol data-set.
The following data will be provided by IAGOS P2c regularly:
Total aerosol number concentration (0.014−3 μm) at STP.
Total number concentration of non-volatile particles (0.014−3 μm) at STP.
Number concentration of sub-μm sized particles with diameter from 0.25 to 1.0 μm at STP.
Number concentration of super-μm sized particles with diameter <2.5 μm at STP.
All number concentrations will be corrected for standard pressure 1013.25 hPa and temperature 273.15 K.
8. Acknowledgements
This work was supported by the EC project IGAS (Grant Agreement No. 312311) and by the Federal Ministry of Education and Research, Germany, in IAGOS D (Grant Agreement No. 01LK1223A). The authors gratefully acknowledge valuable contributions by Elena Justus-Bischler, Andreas Veira (formerly DLR) and Julia Perim de Faria (FZ Jülich) during the evaluation studies.
References
- Allen M. D. , Raabe O. G . Slip correction measurements of spherical solid aerosol particles in an improved Millikan apparatus. Aerosol Sci. Technol. 1985; 4(3): 269–286.
- Aquila V. , Hendricks J. , Lauer A. , Riemer N. , Vogel H. , co-authors . Made-in: a new aerosol microphysics submodel for global simulation of insoluble particles and their mixing state. Geosci. Model Dev. 2011; 4(2): 325–355.
- Banse D. F. , Esfeld K. , Hermann M. , Sierau B. , Wiedensohler A . Particle counting efficiency of the TSI Cpc 3762 for different operating parameters. J. Aerosol Sci. 2001; 32(1): 157–161.
- Carslaw K. S., Lee L. A., Reddington C. L., Pringle K. J., Rap A., co-authors. Large contribution of natural aerosols to uncertainty in indirect forcing. Nature. 2013; 503(7474):67–71.
- Clarke A. D . A thermo optic technique for in-situ analysis of size-resolved aerosol physicochemistry. Atmos. Environ. A Gen. Topics. 1991; 25(3–4): 635–644.
- Clarke A., Kapustin V. Hemispheric aerosol vertical profiles: anthropogenic impacts on optical depth and cloud nuclei. Science. 2010; 329(5998): 1488–1492.
- Cunningham E . On the velocity of steady fall of spherical particles through fluid medium. Proc. Roy. Soc. Lond. A Math. Phys. 1910; 83(563): 357–365.
- DeMott P. J. , Mohler O. , Stetzer O. , Vali G. , Levin Z. , co-authors . Resurgence in ice nuclei measurement research. Bull. Am. Meteorol. Soc. 2011; 92(12): 1623.
- Ekman A. M. L. , Hermann M. , Gross P. , Heintzenberg J. , Kim D. , co-authors . Sub-micrometer aerosol particles in the upper troposphere/lowermost stratosphere as measured by Caribic and modeled using the mit-cam3 global climate model. J. Geophys. Res. Atmos. 2012; 117: 11202.
- GCOS. Implementation Plan for the Global Observing System for Climate in Support of the UNFCCC (ed. WMO) . 2010. WMO, Geneva, Switzerland, p. 186.
- Heim M. , Mullins B. J. , Umhauer H. , Kasper G . Performance evaluation of three optical particle counters with an efficient “multimodal” calibration method. J. Aerosol Sci. 2008; 39(12): 1019–1031.
- Heintzenberg J. , Hermann M. , Weigelt A. , Clarke A. , Kapustin V. , co-authors . Near-global aerosol mapping in the upper troposphere and lowermost stratosphere with data from the Caribic project. Tellus B. 2011; 63(5): 875–890.
- Hermann M. , Adler S. , Caldow R. , Stratmann F. , Wiedensohler A . Pressure-dependent efficiency of a condensation particle counter operated with fc-43 as working fluid. J. Aerosol Sci. 2005; 36(11): 1322–1337.
- Hermann M. , Brenninkmeijer C. A. M. , Slemr F. , Heintzenberg J. , Martinsson B. G. , co-authors . Submicrometer aerosol particle distributions in the upper troposphere over the mid-latitude north Atlantic – results from the third route of ‘Caribic’. Tellus B. 2008; 60(1): 106–117.
- Hermann M. , Heintzenberg J. , Wiedensohler A. , Zahn A. , Heinrich G. , co-authors . Meridional distributions of aerosol particle number concentrations in the upper troposphere and lower stratosphere obtained by civil aircraft for regular investigation of the atmosphere based on an instrument container (Caribic) flights. J. Geophys. Res. Atmos. 2003; 108(D3): 4114.
- Hermann M. , Wiedensohler A . Counting efficiency of condensation particle counters at low-pressures with illustrative data from the upper troposphere. J. Aerosol Sci. 2001; 32(8): 975–991.
- Holben B. N. , Tanre D. , Smirnov A. , Eck T. F. , Slutsker I. , co-authors . An emerging ground-based aerosol climatology: aerosol optical depth from AERONET. J. Geophys. Res. Atmos. 2001; 106(D11): 12067–12097.
- IPCC. The Physical Science Basis. Contribution of Working Group I to the Fifth Assessment Report of the Intergovernmental Panel on Climate Change. 2013; Cambridge, UK: Cambridge University Press.
- Knudsen M. , Weber S . Air resistance against the slow movement of small spheres. Annalen Der Physik. 1911; 36(15): 983–996.
- Knutson E. O. , Whitby K. T . Aerosol classification by electric mobility: apparatus, theory, and applications. J. Aerosol Sci. 1975; 6(6): 443–451.
- Levin Z. , Cotton W. R . Aerosol Pollution Impact on Precipitation: A Scientific Review. 2009; Dordrecht: Springer.
- Lohmann U. , Feichter J . Global indirect aerosol effects: a review. Atmos. Chem. Phys. 2005; 5: 715–737.
- Mahowald N. Aerosol indirect effect on biogeochemical cycles and climate. Science. 2011; 334(6057): 794–796.
- Mann G. W. , Carslaw K. S. , Reddington C. L. , Pringle K. J. , Schulz M. , co-authors . Intercomparison and evaluation of global aerosol microphysical properties among AeroCom models of a range of complexity. Atmos. Chem. Phys. 2014; 14(9): 4679–4713.
- Massoli P. , Kebabian P. L. , Onasch T. B. , Hills F. B. , Freedman A . Aerosol light extinction measurements by cavity attenuated phase shift (CAPS) spectroscopy: laboratory validation and field deployment of a compact aerosol particle extinction monitor. Aerosol Sci. Technol. 2010; 44(6): 428–435.
- Pappalardo G. , Amodeo A. , Apituley A. , Comeron A. , Freudenthaler V. , co-authors . EARLINET: towards an advanced sustainable European aerosol lidar network. Atmos. Meas. Tech. 2014; 7(8): 2389–2409.
- Petzold A., Marsh R., Johnson M., Miller M., Sevcenco Y., co-authors. Evaluation of methods for measuring particulate matter emissions from gas turbines. Environ. Sci. Technol. 2011; 45(8):3562–3568.
- Petzold A. , Onasch T. , Kebabian P. , Freedman A . Intercomparison of a cavity attenuated phase shift-based extinction monitor (CAPS PMex) with an integrating nephelometer and a filter-based absorption monitor. Atmos. Meas. Tech. 2013; 6(5): 1141–1151.
- Petzold A., Thouret V., Gerbig C., Zahn A., Brenninkmeijer C., co-authors. Global-scale atmosphere monitoring by in-service aircraft current achievements and future prospects of the European research infrastructure Iagos. Tellus B. 2015; 67 28452, http://dx.doi.org/10.3402/tellusb.v67.28452 (MOZAIC-Iagos special issue).
- Rap A. , Scott C. E. , Spracklen D. V. , Bellouin N. , Forster P. M. , co-authors . Natural aerosol direct and indirect radiative effects. Geophys. Res. Lett. 2013; 40(12): 3297–3301.
- Reischl G. P . The relationship of input and output aerosol characteristics for an ideal differential mobility analyzer particle standard. J. Aerosol Sci. 1991; 22(3): 297–312.
- Rosenberg P. D. , Dean A. R. , Williams P. I. , Dorsey J. R. , Minikin A. , co-authors . Particle sizing calibration with refractive index correction for light scattering optical particle counters and impacts upon PCASP and CDP data collected during the fennec campaign. Atmos. Meas. Tech. 2012; 5(5): 1147–1163.
- Schwartz S. E. , Charlson R. J. , Kahn R. A. , Ogren J. A. , Rodhe H . Why hasn't earth warmed as much as expected?. J. Clim. 2010; 23(10): 2453–2464.
- Seto T. , Nakamoto T. , Okuyama K. , Adachi M. , Kuga Y. , co-authors . Size distribution measurement of nanometer-sized aerosol particles using Dma under low-pressure conditions. J. Aerosol Sci. 1997; 28(2): 193–206.
- Wiedensohler A . An approximation of the bipolar charge-distribution for particles in the sub-micron size range. J. Aerosol Sci. 1988; 19(3): 387–389.
- Zhang Z. Q. , Liu B. Y. H . Performance of TSI 3760 condensation nuclei counter at reduced pressures and flow-rates. Aerosol Sci. Technol. 1991; 15(4): 228–238.
- Zhou C. , Penner J. E . Aircraft soot indirect effect on large-scale cirrus clouds: is the indirect forcing by aircraft soot positive or negative?. J. Geophys. Res. Atmos. 2014; 119(19): 11303–11320.
9. Appendix
DMA theory
In the following, the DMA theory necessary for the above-described multi-charge correction is briefly summarised:
Neglecting diffusion effects, the central value of the electrostatic mobility Z selected by the DMA is described by Knutson and Whitby (Citation1975), see eq. (A1), and the half width of the distribution is given by eq. (A2).A1
A2
using
The electrostatic mobility of a given particle with the aerodynamic particle diameter D
p
is given by eq. (22), e.g. Seto et al. (Citation1997)A3
Combining eqs. (A1 and A2) and solving for D
p
results in eq. (A2)A4
using the Cunningham correction (see: Cunningham, Citation1910; Knudsen and Weber, Citation1911; Reischl, Citation1991; Allen and Raabe, Citation1985)A5