
Abstract
We present the features seen in the first 2 months (July and August 2012) of data collected over the Pacific by IAGOS (In-service Aircraft for a Global Observing System)-equipped aircraft. IAGOS is the continuation and development of the well-known MOZAIC (Measurement of Ozone and Water Vapour on Airbus in-service Aircraft) project where scientific instruments were carried on commercially operated A340 aircraft to make measurements of chemical species in the atmosphere. Here, we show data from an aircraft operated by China Airlines on routes from Taipei to Vancouver, which provided the first trans-Pacific measurements by an IAGOS-equipped aircraft. We describe the chemical composition of the extratropical upper troposphere/lower stratosphere (Ex-UTLS) across the Pacific basin in the Northern Hemisphere. The observed concentrations of ozone span a range from 18 to 500 ppbv indicating sources in the marine boundary layer and lowermost stratosphere, respectively. Concentrations of carbon monoxide (CO) greater than 400 ppbv are observed in the Ex-UTLS suggesting that plumes of pollution have been exported from the continent. These low concentrations of ozone and high concentrations of CO were rarely recorded in 8 yr of MOZAIC observations over the Atlantic.
This paper is part of a Special Issue on MOZAIC-IAGOS in Tellus B celebrating 20 years of an ongoing air chemistry climate research measurements from airbus commerical aircraft operated by an international consortium of countries. More papers from this issue can be found at http://www.tellusb.net
1. Introduction
IAGOS (In-Service Aircraft for a Global Observing System) has been developed from the success of the MOZAIC (Measurement of Ozone and Water Vapour on Airbus in-service Aircraft) project (Marenco et al., Citation1998; Petzold et al., Citation2015) which has been running since 1994. In MOZAIC, sensors were mounted on long-range commercial aircraft to obtain in-situ measurements of several chemical species in the atmosphere, initially water vapour and ozone, and later carbon monoxide (CO) and nitrogen oxides (NOy). At first, all the airlines that operated MOZAIC-equipped aircraft were based in Europe and operated routes from European hubs to the Americas, Asia, the Middle East and Africa, with the highest concentration of flights being over the North Atlantic flight corridor. Later, one aircraft was based in Namibia giving more flights over Africa.
Within the successor programme IAGOS, the first Asian-based aircraft has been equipped. The aircraft is operated by China Airlines from Taipei and provides data on many routes in the Asia-Pacific region, and particularly across the northern Pacific where hitherto there have been very little in-situ data collected on a regular basis. In this paper, we present the data obtained during the first 2 months of trans-Pacific flights between Taipei and Vancouver. Ninety percent of the data are acquired in the upper troposphere/lower stratosphere (UTLS) when the aircraft attains its cruise altitude somewhere between 300 and 180 hPa. One of the important features of MOZAIC-IAGOS is the simultaneous measurements of O3, CO, water vapour and clouds. In the extratropical UTLS (Ex-UTLS; e.g. Gettelman et al., Citation2011), correlations between the tracers O3 and CO can identify features such as stratospheric intrusions and the mixing of stratospheric and tropospheric air masses near the tropopause, whereas associated observations of water vapour may help to identify source regions or transport processes related to the observed CO–O3 features (Hoor et al., Citation2002; Pan et al., Citation2004; Hegglin et al., Citation2009; Tilmes et al., Citation2010). The remaining data are considered to be quasi-vertical profiles obtained during take-off and landing. In the troposphere, profiles from MOZAIC have revealed episodes of pollution, such as enhanced CO from boreal wildfires (Nédélec et al., Citation2005; Elguindi et al., Citation2010) or the impacts of meteorological events such as the 2003 heatwave across Europe (Tressol et al., Citation2008; Ordóñez et al., Citation2010).
Until now, most in-situ data over the Pacific have been obtained as part of research campaigns such as Transport and Chemical Evolution over the Pacific (TRACE-P) in 2001 (Jacob et al., Citation2003) or Intercontinental Chemical Transport Experiment, Phase B (INTEX-B) in 2006 (Singh et al., Citation2009). Such research campaigns are targeted at particular scientific questions, and thus are of limited duration and have more focused spatial extent. For example, INTEX-B was aimed at understanding transport and evolution of Asian pollution off the Pacific West Coast, and it was conducted over a 2-month period in boreal spring 2006. In contrast, this IAGOS-equipped aircraft assures regular measurements across the Northern Pacific basin. Based on these first 2 months of operation, we can expect about 10 crossings per month. The data are capable of capturing individual events such as episodes of pollution and are also suitable for statistical or climatological analysis. In addition, the continuity of the measurements will allow seasonal and eventually interannual variability to be studied as well as providing a platform for long-term monitoring. In this article, we describe these first measurements across the Pacific, focusing on the period July–August 2012, the only period so far when the complete validated dataset is available. We present case studies which highlight the seasonal monitoring potential of IAGOS, which is ongoing. We highlight the differences between the Pacific and 8 yr (2002–2009) of CO and O3 measurements over the Atlantic obtained by MOZAIC aircraft, and show that these new data, in combination with water vapour and cloud observations, offer opportunities for new research interests.
2. IAGOS data
The instruments used for IAGOS are almost the same as those used for MOZAIC. They have been miniaturised and IAGOS includes a data transmission system which allows the data to be transmitted as soon as the aircraft arrives at its parking gate and to be available in quasi near-real time. The availability of data in quasi near-real time is useful for operational purposes, but for scientific studies, the data are subject to further calibration and quality control procedures after a 6-month period of operation. Full details are provided by Nédélec et al. (Citation2015). Confidence in the IAGOS data and in the operation of the programme is derived from its history as MOZAIC. The ozone and CO instruments used by MOZAIC are described in more detail by Thouret et al. (Citation1998) and Nédélec et al. (Citation2003) respectively. Ozone is measured by the dual-beam UV absorption principle and has an estimated accuracy of ±2 ppbv or ±2% and a response time of 4 s. The CO infrared analyser gives an accuracy of ±5 ppbv ±5% with a response time of 30 s (7.5 km at cruise altitude). Test-flights showed the stability of the measurements at concentrations above 40 ppbv and a minimum detectable concentration of 10 ppbv. Water vapour is measured by a capacitive hygrometer (Helten et al., Citation1998), which was improved for operation aboard IAGOS aircraft (Neis et al., Citation2015). The accuracy of the hygrometer is ±5%RH, whereas the response time is of the order of 5 minutes under cruise altitude conditions. Cloud elements are detected by a backscatter cloud probe (Beswick et al., Citation2014).
During MOZAIC, a consistent and reliable set of observations of ozone has been obtained since 1994 and of CO since 2002, and data have been used in numerous wide ranging studies (Petzold et al., Citation2015). The quality control procedures which were established for MOZAIC are maintained for IAGOS to ensure that the dataset remains free of instrumental artefacts. The instruments are calibrated in the laboratory against a National Institute of Standards and Technology (NIST) reference before and after an operational period of about 6 months and in addition, each instrument's zero and calibration factor are regularly checked in-flight, using a built-in, ozone generator. The responses of different sets of MOZAIC instruments are compared whenever they fly in the same route within a delay of less than 2 hours. This issue contains more details of the instrumentation and the operation of the programme. More information about MOZAIC and IAGOS, along with access to the database, is available at www.iagos.org and links given there.
The spatial and temporal origins of the air masses observed by MOZAIC were determined using the FLEXPART Lagrangian dispersion model version 9.02 (www.transport.nilu.no/flexpart; Stohl et al., Citation2005). The model calculates trajectories of user-defined ensembles of particles released from three-dimensional boxes in backward mode. In this study, particles were released from the high and low CO or O3 anomalies along the MOZAIC flight tracks. The model was driven by wind fields provided by the European Centre for Medium-range Weather Forecast (ECMWF) using both analyses and forecasts with a temporal resolution of 3 hours (analyses at 0000, 0600, 1200, 1800 UTC; forecasts at 0300, 0900, 1500, 2100 UTC). The horizontal resolution is 1°×1° and 91 vertical levels were used. Turbulence is parameterised solving Langevin equations (Stohl and Thomson, Citation1999) and the convection parameterisation scheme is adopted from Emanuel and Zivkovic-Rothman (Citation1999) for all types of convection. The height of the planetary boundary layer is derived using the critical Richardson number concept. FLEXPART has been extensively used to help identify features observed by MOZAIC aircraft, in case studies (e.g. Nédélec et al., Citation2005; Cammas et al., Citation2009; Elguindi et al., Citation2010; Gressent et al., Citation2014). Similarly, the LAGRANTO Lagrangian model (Wernli, Citation1997) was used with MOZAIC data in a statistical approach to identify the origin of air masses over West Africa (Sauvage et al., Citation2005) and to characterise mixing around the tropopause (Brioude et al., Citation2008).
FLEXPART enables us to establish a relationship between a ‘source’, which may be a region of clean air or be characterised by the emissions of pollutants, and a ‘receptor’ which in this study is an anomaly of CO or O3. A large number of particles are released from the receptor location and transported backwards in time. In order to investigate the anomalies of CO with respect to their background mixing ratios, particle dispersion is analysed as soon as particles reach the ground when they could possibly be loaded with pollution. FLEXPART outputs the residence time (in seconds) of all the particles in each grid-box of the model output and represents the sensitivity of single or multiple ground-sources to the receptor.
Similarly, we also used FLEXPART to link each observation with a ‘source’ value of potential vorticity (PV) obtained from the ECMWF's operational analysis. The value of PV gives an indication of where the air parcels are with respect to the tropopause which approximates to 2PVU (Potential Vorticity Units: 1PVU=10−6m2s−1Kkg−1) in the mid-latitudes (Holton et al., Citation1995). The association of the observations with PV has recently been completed for the MOZAIC database and for the IAGOS flights studied in this article. In 2003, the ECMWF operational analysis used had a resolution of TL511 (0.3°) with 60 levels in the vertical. The horizontal resolution was increased to TL799 (0.2°) in 2006 and the number of vertical levels was increased to 91.
3. Chemical composition of the Pacific Ex-UTLS
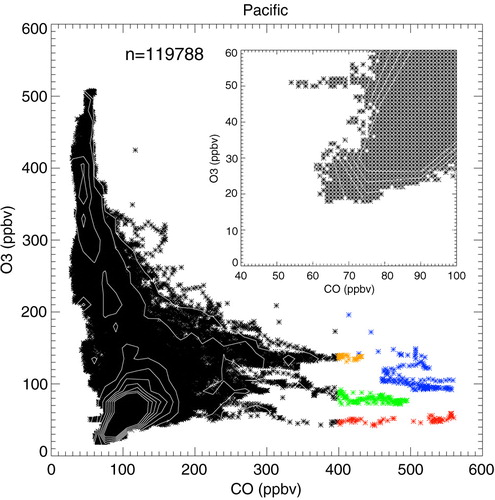
In this section, we describe the chemical composition of the extratropical UTLS (Ex-UTLS) over the northern Pacific as sampled by the flights from Taipei to Vancouver during July and August 2012. The trajectories for these flights are shown in . We show in , a time series of the complete dataset provided on 25 July 2012 (referred to as Flight-20120725) from the IAGOS aircraft. The measurements were made at cruise altitude between 274 and 196 hPa, and span latitudes ranging from 24 to 64°N. The abundances of O3 and CO measured on these flights are presented as a tracer–tracer plot in . Plotting O3 against CO forms a well-known, ‘L’-shaped distribution (e.g. Pan et al., Citation2004), whereby the stratospheric branch is characterised by high mixing ratios of ozone with low mixing ratios of CO, and the tropospheric branch by high CO mixing ratios and low O3 mixing ratios. In the following, we discuss the anomalies in the ‘L’-shaped distribution that have not been previously observed by MOZAIC.
Fig. 1 Aircraft trajectories during July and August 2012.
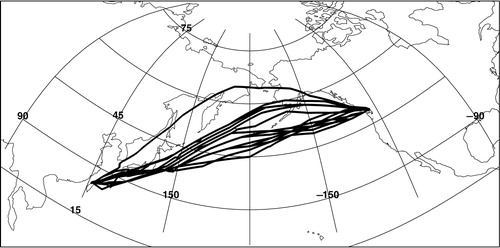
Fig. 2 The suite of measurements available from IAGOS for the flight 20120725 from Taipei to Vancouver.
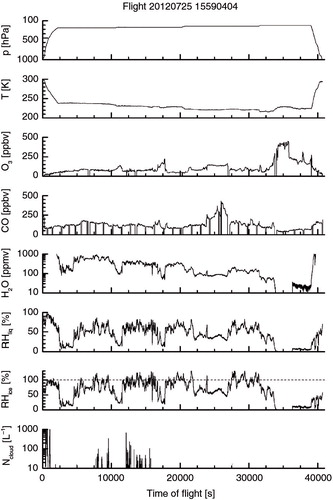
Fig. 3 CO–O3 scatter-plot based on all trans-Pacific flights in July and August 2012 at cruise altitudes between 274 and 196 hPa. Inset zoom shows the very low ozone mixing ratios observed. Also highlighted are several flights where very high CO mixing ratios were observed: 20120703: blue, 20120705: green, 20120725: orange, 20120808: red. The total number of flights is 28. The contours from the pdf distribution shown in are also overlain in white.
3.1. Signatures of pollution
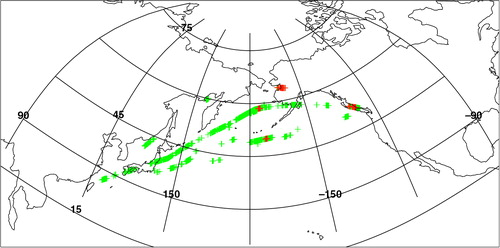
First to note in , are the concentrations of CO exceeding 400 ppbv which were observed at altitudes from 274 to 216 hPa (9.7–11.3 km) on four separate flights in July and August 2012 as the colour coding highlights (20120703: blue, 20120705: green, 20120725: orange, 20120808: red). The highlighted observations fall in the tropospheric branch of the ‘L’-shaped distribution due to the corresponding mixing ratios of ozone having values around 100 ppbv (Pan et al., Citation2004; Thouret et al., Citation2006; Tilmes et al., Citation2010). Therefore, these elevated values of CO suggest heavily polluted air in the upper troposphere, which may also explain the ozone mixing ratios being slightly higher than we would expect based on the 70–90 ppbv climatological values from MOZAIC observations over the Atlantic (Thouret et al., Citation2006). On 20120703 indicated in blue and 20120705 indicated in green in , the aircraft encountered the elevated CO over Alaska and along the coast of British Columbia, respectively. On 20120725 indicated in orange and 20120808 indicated in red, the high CO values are found in an oceanic location south of the Aleutian Islands and over the Bering Sea, respectively. The location of all these areas of CO >400 ppbv is shown as red crosses in .
Fig. 4 Location of CO mixing ratios >200 ppbv shown by green crosses and CO >400 ppbv shown by red crosses.
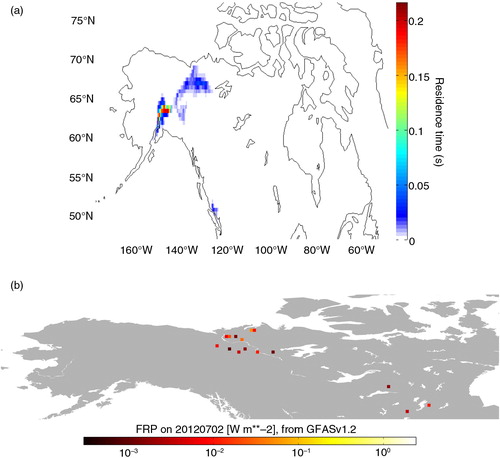
The high concentrations observed at cruise altitudes over the Pacific correspond to specific episodes of pollution from different regional sources. Back trajectories using the Lagrangian particle dispersion model FLEXPART show that the source of the elevated CO on 20120705 indicated in green on is over Canada (Yukon) (a) and is likely related to the wildfires burning at the time as illustrated by the fire radiative power (FRP) (b). FRP is calculated from the 4-µm channels of the two MODIS instruments (Justice et al., Citation2002). The instantaneous satellite product is used by the global fire assimilation system (GFAS; Kaiser et al., Citation2012) to create global daily cloud-corrected and observation-gap-filled fields of FRP. The FRP and associated emission fields are produced in real time by the Copernicus Atmosphere Monitoring Service (CAMS; Flemming et al., Citation2013) and are publicly available at www.atmosphere.copernicus.eu/fire. The current system (GFASv1.2) has a resolution of 0.1°. For b, the FRP field has been aggregated to 0.5° resolution. b shows that the only source of CO that contributes to the observed anomaly is from over the Yukon. The CO anomaly is also influenced by apparently cleaner air masses from the region north of Anchorage. This may indicate that the fires over the Yukon are responsible for more CO than observed by IAGOS.
Fig. 5 Residence times from a FLEXPART simulation integrated until the trajectories reached ground level, 3 d prior to the observed anomaly of high CO. Residence times show the likely origin of the high CO mixing ratios observed at (a) 51 N, 130 W on 5 July 2012 (green in ) and (b) fire radiative power as derived from MODIS showing the locations of active burning on 2 July 2012.
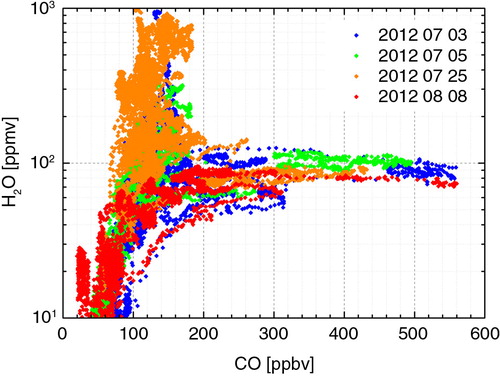
The water vapour mixing ratios corresponding to these high CO mixing ratios fall within a narrow range (70–130 ppmv) (). With an ozone mixing ratio around 100 ppbv, suggesting that the air parcels are near the bottom of the extratropical tropopause layer (Ex-TL), the water vapour mixing ratios are relatively high. Typical water vapour mixing ratios in this region would be around 40 ppmv (e.g. Hegglin et al., Citation2009). The narrow range of mixing ratios indicates that the production mechanisms are likely to be the same in each case. Cammas et al. (Citation2009) documented an event in June 2004 when CO mixing ratios of 275 ppbv were observed over the Atlantic and attributed to boreal fires in Alaska. The corresponding relative humidity in the plume was 30–40%. In the cases we describe here, the CO mixing ratios are much higher, and the water vapour mixing ratios are around 100 ppmv with relative humidities ranging from 35 to 75%. Parmar et al. (Citation2008) compared the water vapour released when different biomass samples were burned. Their experimental study showed that the ratio of water vapour to carbon oxides (CO +CO2) was much greater for a spruce biomass such as would be found in boreal forests as compared with grass biomass as found in the savannahs. The high water vapour content, the FLEXPART trajectories and the location of the wildfires shown by the FRP strongly suggest boreal fires as the source of these plumes of high CO.
Fig. 6 Scatter-plot for flights with high CO mixing ratio, with colours representing the date of the flight.
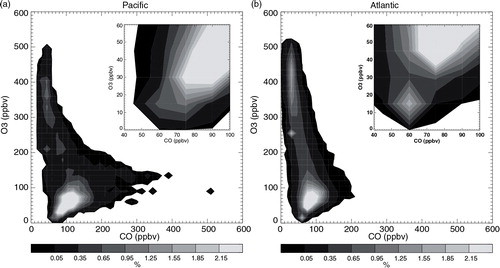
While such high concentrations of CO have not been previously detected by MOZAIC-IAGOS aircraft over the Pacific, such values have been recorded by MOZAIC instruments at cruise altitude over North-East Asia and were also identified as plumes from boreal wildfires (Nédélec et al., Citation2005). Similarly, high values of CO have been measured over the Pacific by research aircraft in a number of previous studies (e.g. Heald et al., Citation2003). Such elevated concentrations were not seen again during the period of July–August 2012 and thus make only a small contribution to the probability distribution function for the 120×103 observations over the Pacific shown in a. For comparison, a similar pdf (over the same latitude range 25–64°N) has been constructed for the Atlantic sector, containing 8 yr and 2500 ×103 measurements (b). While the plumes from the boreal forest fires in June 2004, noted by Cammas et al. (Citation2009) reached 275 ppbv of CO over the Atlantic, the pdf suggests that mixing ratios higher than 200 ppbv are very rarely encountered over the Atlantic basin by MOZAIC aircraft.
Fig. 7 Probability density function based on all trans-Pacific flights in July and August 2012 and all trans-Atlantic flights from July to August 2002–2009 at cruise altitudes between 274 and 196 hPa.
This difference is further illustrated by the box-plot in a. In this figure, we compare the Pacific and Atlantic measurements of CO on flight-levels, the roughly constant pressure levels between 287 and 178 hPa, that the aircraft maintain during the cruise phase of the flight. Climbs or descents between flight-levels account for about 6% of the data (Thouret et al., Citation1998), and these data are not shown in this figure. There were two further flight-levels used over the Atlantic compared with the Pacific during the time period studied. The boxes represent the lower quartile, median, and upper quartile, and the whiskers extend to the 1st to 99th percentiles. The Pacific has higher median mixing ratios of CO as well as higher 99th percentiles at all flight-levels. Lower mixing ratios are seen over the Atlantic, along with a vertical gradient of decreasing CO with altitude. This vertical gradient is less obvious over the Pacific, perhaps due to the position of the tropopause relative to the flight-levels.
Fig. 8 (a) CO measured on flight-levels in hPa over the Pacific during July and August 2012 (black lines) and over the Atlantic (red) for July–August 2002–2009. The boxes represent the lower quartile, median, and upper quartile and the whiskers extend to the 1st to 99th percentiles. (b) The percentage of measurements with CO greater than 200 ppbv over the Pacific (black) in July–August 2012 and the Atlantic (grey) July–August 2002–2009.
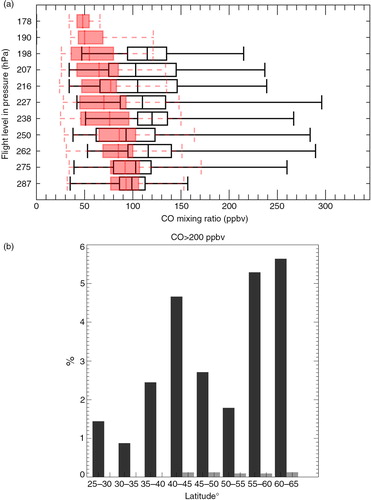
The histogram in b shows that the frequency of occurrence of mixing ratios exceeded 200 ppbv for the Pacific Ocean when considered by latitude. The location of these measurements is plotted in . The number of measurements of CO exceeding 200 ppbv is greater over the Pacific than over the Atlantic in every latitude band. Over the Pacific, the distribution by latitude shows a bimodal structure with a first peak related to the proximity of land, and to local sources of anthropogenic pollution at more northern latitudes (55–65°N). The second peak, in the latitude range 40–45°N (b), corresponds to the north Pacific storm tracks suggesting long-range transport of air pollution (Stohl and Eckhardt, Citation2004). We anticipate that a similar plot for winter and spring will show a different latitudinal distribution according to the seasonal variation in storm tracks.
Relatively few pollution plume events over the 10 yr period over the Atlantic have been observed by MOZAIC aircraft. Even when accounting for the difference in background CO over the Atlantic seaboard (110 ppbv) compared with the Pacific seaboard (140 ppbv), there remains a significant difference in the extreme concentrations observed. This difference may be due to the fact that the Atlantic flights have not captured the pollution plumes due to them crossing the Atlantic at a lower altitude than the cruise altitude of the aircraft. Several field studies and long-term measurements by Raman lidar showed that boreal fire plumes are transported typically at altitudes below 10 km over the Atlantic into Europe (e.g. Petzold et al., Citation2002, Citation2007; Mattis, Citation2008). Our analysis also shows that the air sampled over the Atlantic has more stratospheric characteristics (high O3, low CO) than over the Pacific for the same latitude and flight-level (see Section 3.3), indicating that the aircraft is flying higher relative to the tropopause than over the Pacific. Where CO plumes have been observed over the Atlantic or observed in Europe having crossed the Atlantic (Cammas et al., Citation2009; Elguindi et al., Citation2010), the height of the plumes is sensitive to the injection height. It is possible that the injection height is on average lower for North American sources than for Asian sources due to the intensity of the burning or to the role of pyroconvection. However, this would not be expected from the observed lower intensity of boreal fires in Russia compared with those in North America (Wooster and Zhang, Citation2004). Analysis of the new injection height estimates (Paugam et al., Citation2015) in GFASv1.2 may be used to investigate further.
3.2. Contribution from the marine boundary layer
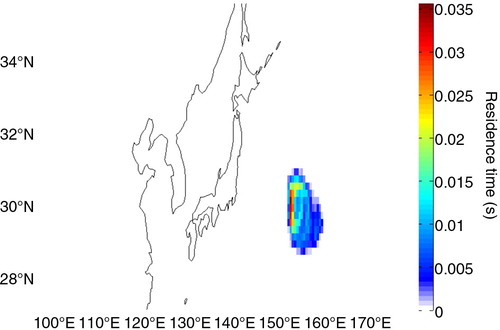
Returning now to the scatter-plot of , we note a pronounced tail, where air has low concentrations of CO (around 70 ppbv) and very low mixing ratios of ozone (<30 ppbv and even down to 18–20 ppbv; see zoom of ). The observations where ozone mixing ratios were less than 30 ppbv are marked on the map in , with areas where O3<25 ppbv highlighted in red. We initiated 10-d FLEXPART back-trajectories in six regions of lowest ozone concentration (O3<25 ppbvO3) confirming that in 80% of the cases, the air has its origin in the tropical marine boundary layer. In one example, 49.5°N, 165°E on 11 August 2012, the air has its origin in the tropical marine boundary layer () some 4 d earlier.
Fig. 9 Location of O3 mixing ratios <30 ppbv shown by blue crosses and O3 <25 ppbv shown by red crosses.
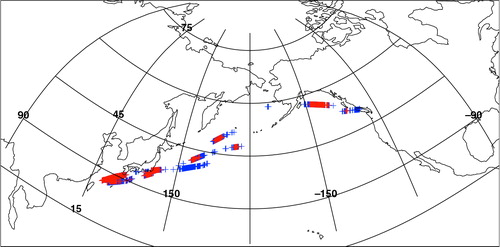
Fig. 10 Residence times from a FLEXPART simulation integrated until the trajectories reached ground level, 4 d prior to the observed anomaly of low ozone. Residence times show the likely origin of low ozone mixing ratios O3<25 ppbv (in red in ) observed at (a) 49.5°N, 165°E on 11 August 2012.
a shows that the air masses with low ozone mixing ratios generally have a water vapour mixing ratio at the upper end of the expected range (Hegglin et al., Citation2009). This plot shows air masses coloured by their corresponding mixing ratio of CO. This way, it illustrates the photochemical environment with which these low ozone values are associated. The high humidity, low ozone and low CO suggest a photochemical environment typical of the marine boundary layer, where the photochemically produced OH radical is able to cleanse the atmosphere of pollution. Similarly, low ozone concentrations were detected during the measurement campaign PEM-West A, where ozone less than 20 ppbv was noted throughout the depth of the troposphere over the Pacific at low latitudes (Browell et al., Citation1996). The low ozone values observed during PEM-West A were related to the outflow from deep tropical convection and typhoons which transport ozone-poor air from the marine boundary layer to the upper troposphere.
Fig. 11 Scatter-plots for flights with low ozone mixing ratio: (a) colours represent the corresponding mixing ratio of CO, and (b) colours represent the latitude of observation.
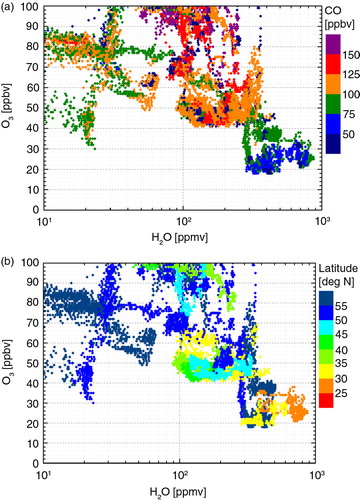
The low ozone values observed in or near to the tropical region are not unusual. More recently, Cooper et al. (Citation2013), showed that low ozone events observed by three remote sensing instruments (Microwave Limb Sounder, Optical Spectrograph and Infrared Imaging System, and Atmospheric Chemistry Experiment Fourier Transform Spectrometer) were most frequent in the tropical South Pacific warm pool and were coherent with outgoing longwave radiation as an indicator of deep convection. Interestingly, these low ozone values encountered by IAGOS were not confined to the tropical region. b (same as a, but coloured by latitude) additionally shows that the occurrence of these air masses with high-H2O, low-ozone and low CO has no latitudinal dependence. These characteristics are found at latitudes from 30°N up to 60°N. Furthermore, as shown in such low ozone air masses have a spatial extent of a few 100 km.
Our results are not definitive, as in one example (not shown) the low ozone mixing ratios originated over China. In this case, ozone may have been depleted through titration with high NO, but we might then expect the CO mixing ratio to be higher than we observe as both have anthropogenic sources. The ambiguity in determining the source of these air masses also highlights the need for the NOx measurements, which will soon be available as part of the IAGOS installation package. These will provide a second measure of likely anthropogenic pollution and an indication of recent lightning and convective activity.
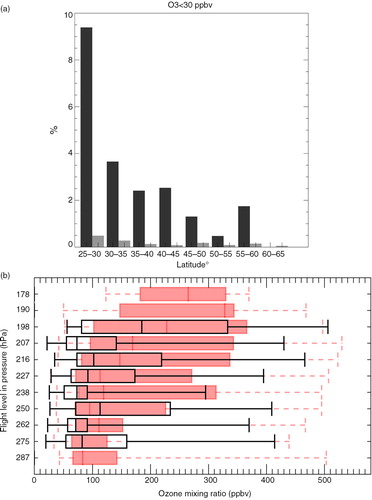
The histogram in a shows that in each latitude bin, a significant proportion of observations have O3<30 ppbv. In comparison with the Pacific, the probability of observing such low values over the Atlantic Ocean is very small (). This difference is not explained by the difference in flight patterns over the Atlantic compared with over the Pacific as a shows a much smaller number of observations O3<30 ppbv in all latitude bins and similarly at all flight-levels (b).
Fig. 12 (a) Histogram showing the percentage of measurements with ozone less than 30 ppbv over the Pacific (black) in July–August 2012 and the Atlantic (grey) July–August 2002–2009. (b) Ozone measured on flight-levels in hPa over the Pacific during July and August 2012 (black lines) and over the Atlantic (red) for July–August 2002–2009. The boxes represent the lower quartile, median, and upper quartile and the whiskers extend to the 1st to 99th percentiles.
In mid-latitudes, ozone-poor air may have been transported from the tropical marine boundary layer by the warm conveyor belt or synoptic scale uplifts (Grant et al., Citation2000), or ozone-depleted air may have been exported directly from the Asian continent. Our results suggest that such low ozone mixing ratios are encountered frequently in the Pacific basin, at the lower latitudes sampled by IAGOS (25–30°N) and also in the 40–45°N latitude bin indicative of the north Pacific storm tracks. As with the high CO values described above, climatologies of storm tracks may suggest when and where such low ozone values are likely to occur and would be an interesting area for further research with IAGOS data.
3.3. Stratospheric signatures
Finally, we discuss the vertical or stratospheric branch as seen in and , where ozone mixing ratios are high and CO mixing ratios are low. In a and b, we use ozone >400 ppbv (e.g. Pan et al., Citation2007), and a threshold of CO <40 ppbv to indicate stratospheric air. The percentage of observations with O3>400 ppbv and CO<40 ppbv measured over the Pacific and Atlantic (over the same latitude range) increases as the aircraft flies further north. This reflects that for the same cruise altitude, the aircraft is deeper within the stratosphere at higher latitudes and is consistent with the altitude of the tropopause decreasing with increasing latitude. At latitudes equatorward of 40°N over the Pacific the aircraft never encountered such high mixing ratios or such low CO mixing ratios. The ozone mixing ratios are on average higher at every flight-level over the Atlantic (b) and CO mixing ratios are lower (a). The median values of ozone also increase with increasing altitude, while the median values of CO decrease with altitude over the Atlantic (). These gradients are less pronounced over the Pacific, suggesting that we are further from the tropopause, or that the tropopause layer is more mixed.
Fig. 13 Histogram showing the percentage of measurements with (a) CO less than 40 ppbv; (b) ozone greater than 400 ppbv in each latitude bin for the Pacific in July and August 2012 (black) and the Atlantic for July and August 2002–2009 (grey), (c) potential vorticity (PVU: 1PVU = 10−6 m2 s−1 Kkg−1) calculated for each measurement on flight-levels in hPa over the Pacific during July and August 2012 (black lines) and over the Atlantic (red) for July–August 2002–2009. The boxes represent the lower quartile, median, and upper quartile and the whiskers extend to the 1st to 99th percentiles.
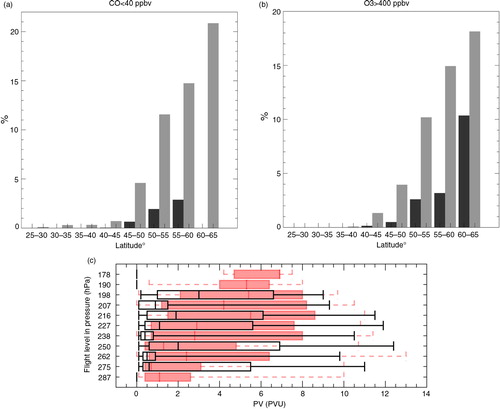
Further evidence for this is given by the PV of each observation, calculated by associating each measurement with the PV from the ECMWF's operational analysis via FLEXPART. c shows that, as with ozone (b), the median values of PV are higher over the Atlantic than over the Pacific on all flight-levels (except for 250 and 275 hPa), and on average over the five flight-levels, the PV over the Atlantic is 4.4 PVU compared with 2.6 PVU over the Pacific. This offers further indication that the Atlantic observations have an origin deeper in the stratosphere. The Pacific dataset is small for drawing firm conclusions. An investigation using PV equivalent latitudes (e.g. Clark et al., Citation2007) and using a larger dataset for the Pacific would be necessary to confirm these initial findings. Differences between the Atlantic and Pacific may be due to differences in Rossby Wave breaking events and the influence of the North Atlantic Oscillation (NAO) or El Nino and Southern Oscillation (ENSO) leading to varying amounts of mixing in the Ex-UTLS over the Atlantic and Pacific (Shuckburgh et al., Citation2009). In time, IAGOS will allow climatological differences between the Atlantic and Pacific to be more fully described.
4. Conclusions
This article described the first trans-Pacific flights of an IAGOS-equipped aircraft. Ozone, water vapour and CO are now measured regularly across the Pacific by an aircraft operated by China Airlines from Taipei to Vancouver.
The results reveal air with a range of ozone mixing ratios from 18 to >500 ppbv representing origins in the marine boundary layer and the lowermost stratosphere. Concentrations of CO range from 20 to 570 ppbv, with the higher concentrations representing polluted air masses. The corresponding water vapour signature, along with FLEXPART back-trajectories suggest that these high mixing ratios of CO originate from boreal wildfire plumes exported from Eurasia and Alaska. A statistical study of the air masses over the Pacific will be possible as more data are collected. In addition, the IAGOS database will soon contain additional added-value products, such as recent CO contributions, thanks to the automatic application coupling IAGOS, with FLEXPART and the ECCAD (Emissions of atmospheric Compounds and Compilation of Ancillary Data) emissions inventory database. This ongoing development of the database for the provision of IAGOS data and services will enable a better understanding of the origin of the observed CO plumes.
There are some notable differences between the Pacific and the Atlantic. The Pacific storm tracks export highly polluted air across the Pacific basin and CO mixing ratios are much higher than observed over the Atlantic. Mixing ratios of ozone are lower over the Pacific suggesting a more frequent export of air from the tropical marine boundary layer to mid-latitudes, and ozone mixing ratios are higher over the Atlantic, suggesting that for the same latitude, the sampled air over the Atlantic is deeper within the lowermost stratosphere. These differences may be related to the climatological position of the tropopause and storm tracks being different over the two basins. This will be an important area for further work as more IAGOS data becomes available and seasonal climatologies of CO and O3 can be derived over the Pacific. IAGOS is important to the scientific community in providing data in the UTLS region in regions where in situ data are often of limited temporal and spatial extent. The data will prove useful in the validation of satellite and models in this region and are available at www.iagos.org.
Acknowledgements
The programmes MOZAIC and CARIBIC, and the current Research Infrastructure IAGOS, are operated with support from the European Commission, national agencies in Germany (BMBF), France (MESR) and the UK (NERC), and the IAGOS member institutions (www.iagos.org/partners). The participating airlines (Lufthansa, Air France, Austrian, China Airlines, Iberia, Cathay Pacific, Air Namibia, Sabena) supported IAGOS by carrying the measurement equipment free of charge since 1994. The data are available at www.iagos.fr. Thanks to additional support from ETHER. J. W. Kaiser was funded in the EU H2020 project MACC-III (contract no. 633080).
Notes
This paper is part of a Special Issue on MOZAIC-IAGOS in Tellus B celebrating 20 years of an ongoing air chemistry climate research measurements from airbus commerical aircraft operated by an international consortium of countries. More papers from this issue can be found at http://www.tellusb.net
References
- Beswick K. , Baumgardner D. , Gallagher M. , Volz-Thomas A. , Nédélec P. , co-authors . The backscatter cloud probe: a compact low-profile autonomous optical spectrometer. Atmos. Meas. Tech. 2014; 7: 1443–1457. DOI: http://dx.doi.org/10.5194/amt-7-1443-2014 .
- Brioude J. , Cammas J.-P. , Cooper O. R. , Nédélec P . Characterization of the composition, structure, and seasonal variation of the mixing layer above the extratropical tropopause as revealed by MOZAIC measurements. J. Geophys. Res. 2008; 113: 00B01. DOI: http://dx.doi.org/10.1029/2007JD009184 .
- Browell E. V. , Fenn A. , Butler C. F. , Grant W. B. , Merrill J. T. , co-authors . Large-scale air mass characteristics observed over Western Pacific during summertime. J. Geophys. Res. 1996; 101: 1691–1712. DOI: http://dx.doi.org/10.1029/95JD02200 .
- Cammas J.-P. , Brioude J. , Chaboureau J.-P. , Duron J. , Mari C. , co-authors . Injection in the lower stratosphere of biomass fire emissions followed by long-range transport: a MOZAIC case study. Atmos. Chem. Phys. 2009; 9: 5829–5846.
- Clark H. L. , Cathala M.-L. , Teyssedre H. , Cammas J.-P. , Peuch V.-H . Cross-tropopause fluxes of ozone using assimilation of MOZAIC measurements in a global CTM. Tellus B. 2007; 59: 39–49.
- Cooper M. J. , Martin R. V. , Livesey N. J. , Degenstein D. A. , Walker K. A . Analysis of satellite remote sensing observations of low ozone events in the tropical upper troposphere and links with convection. Geophys. Res. Lett. 2013; 40: 3761–3765. DOI: http://dx.doi.org/10.1002/grl.50717 .
- Elguindi N. , Clark H. , Ordóñez C. , Thouret V. , Flemming J. , co-authors . Current status of the ability of the GEMS/MACC models to reproduce the tropospheric CO vertical distribution as measured by MOZAIC. Geosci. Model Dev. 2010; 3: 501–518.
- Emanuel K. A. , Zivkovic-Rothman M . Development and evaluation of a convection scheme for use in climate models. J. Atmos. Sci. 1999; 56: 1766–1782.
- Flemming J. , Peuch V.-H. , Engelen R. , Kaiser J . A European global- to-regional that combines modeling: a novel forecasting system for atmospheric composition operates daily to forecast global air pollution. EM: Air and Waste Management Associations Magazine for Environmental Managers. DOI: http://dx.doi.org/10.1029/1999JD901022 .
- Gettelman A. , Hoor P. , Pan L. , Randel W. J. , Hegglin M. I. , co-authors . The extratropical upper troposphere and lower stratosphere. Rev. Geophys. 2011; 49: 3003. DOI: http://dx.doi.org/10.1029/2011RG000355 .
- Grant W. B. , Browell E. V. , Butler C. F. , Fenn M. A. , Clayton M. B. , co-authors . A case study of transport of tropical marine boundary layer and lower tropospheric air masses to the northern midlatitude upper troposphere. J. Geophys. Res. 2000; 105: 3757–3769. DOI: http://dx.doi.org/10.1029/1999JD901022 .
- Gressent A. , Sauvage B. , Defer E. , Werner Pätz K. , Thomas K. , co-authors . Lightning NOx influence on large-scale NOy and O3 plumes observed over the northern mid-latitudes. Tellus B. 2014; 66: 25544. DOI: http://dx.doi.org/10.3402/tellusb.v66.25544 .
- Heald C. L. , Jacob D. J. , Fiore A. M. , Emmons L. K. , Gille J. C. , co-authors . Asian outflow and trans-Pacific transport of carbon monoxide and ozone pollution: an integrated satellite, aircraft, and model perspective. J. Geophys. Res. 2003; 108: 4804. DOI: http://dx.doi.org/10.1029/2003JD003507 .
- Hegglin M. I. , Boone C. D. , Manney G. L. , Walker K. A . A global view of the extratropical tropopause transition layer from Atmospheric Chemistry Experiment Fourier Transform Spectrometer O3, H2O, and CO. J. Geophys. Res. 2009; 114: 00B11. DOI: http://dx.doi.org/10.1029/2008JD009984 .
- Helten M. , Smit H. G. J. , Strater W. , Kley D. , Nédélec P. , co-authors . Calibration and performance of automatic compact instrumentation for the measurement of relative humidity from passenger aircraft. J. Geophys. Res. 1998; 103: 25643–25652. DOI: http://dx.doi.org/10.1029/98jd00536 .
- Holton J. R. , Haynes P. H. , McIntyre M. E. , Douglass A. R. , Rood R. B. , co-authors . Stratosphere–troposphere exchange. Rev. Geophys. 1995; 33: 403–439.
- Hoor P. , Fischer H. , Lange L. , Lelieveld J. , Brunner D . Seasonal variations of a mixing layer in the lowermost stratosphere as identified by the CO–O3 correlation from in situ measurements. J. Geophys. Res. 2002; 107(D5): 4044. DOI: http://dx.doi.org/10.1029/2000JD000289 .
- Jacob D. J. , Crawford J. H. , Kleb M. M. , Connors V. S. , Bendura R. J. , co-authors . Transport and chemical evolution over the Pacific (TRACE-P) aircraft mission: design, execution, and first results. J. Geophys. Res. 2003; 108: 9000. DOI: http://dx.doi.org/10.1029/2002JD003276 .
- Justice C. O. , Giglio L. , Korontzi S. , Owens J. , Morisette J. T. , co-authors . The MODIS fire products. Remote Sens. Environ. 2002; 83: 244–262.
- Kaiser J. W. , Heil A. , Andreae M. O. , Benedetti A. , Chubarova N. , co-authors . Biomass burning emissions estimated with a global fire assimilation system based on observed fire radiative power. Biogeosciences. 2012; 9: 527–554.
- Marenco A. , Thouret V. , Nédélec P. , Smit H. , Helten M. , co-authors . Measurements of ozone and water vapour by Airbus in-service aircraft: the MOZAIC airborne program, an overview. J. Geophys. Res. 1998; 103: 25631–25642.
- Mattis I. , Mller D. , Ansmann A. , Wandinger U. , Preissler J. , co-authors . Ten years of multiwavelength Raman lidar observations of free-tropospheric aerosol layers over central Europe: geometrical properties and annual cycle. J. Geophys. Res. 2008; 113: 20202. DOI: http://dx.doi.org/10.1029/2007jd009636 .
- Nédélec, P., Blot, R., Boulanger, D., Athier, G., Cousin, J. M. and co-authors. 2015. Instrumentation on commercial aircraft for monitoring the atmospheric composition on a global scale: the IAGOS system, technical overview of ozone and carbon monoxide measurements. Tellus B. 67, 27791. DOI: http://dx.doi.org/10.3402/tellusb.v67.27791 .
- Nédélec P. , Cammas J.-P. , Thouret V. , Athier G. , Cousin J.-M. , co-authors . An improved infrared carbon monoxide analyser for routine measurements aboard commercial Airbus aircraft: technical validation and first scientific results of the MOZAIC III programme. Atmos. Chem. Phys. 2003; 3: 1551–1564.
- Nédélec P. , Thouret V. , Brioude J. , Sauvage B. , Cammas J. , co-authors . Extreme CO concentrations in the upper troposphere over North-East Asia in June 2003 from the in-situ MOZAIC aircraft data. Geophys. Res. Lett. 2005; 32: 14807. DOI: http://dx.doi.org/10.1029/2005GL023141 .
- Neis P. , Smit H. G. J. , Rohs S. , Bundke U. , Krämer M. , co-authors . Quality assessment of MOZAIC and IAGOS capacitive hygrometers: insights from airborne field studies. Tellus B. 2015; 67
- Ordóñez C. , Elguindi N. , Stein O. , Huijnen V. , Flemming J. , co-authors . Global model simulations of air pollution during the 2003 European heat wave. Atmos. Chem. Phys. 2010; 10: 789–815.
- Pan L. L. , Randel W. J. , Gary B. L. , Mahoney M. J. , Hintsa E. J . Definitions and sharpness of the extratropical tropopause: a trace gas perspective. J. Geophys. Res. 2004; 109: 23103. DOI: http://dx.doi.org/10.1029/2004JD004982 .
- Pan L. L. , Wei J. C. , Kinnison D. E. , Garcia R. R. , Wuebbles D. J. , co-authors . A set of diagnostics for evaluating chemistry-climate models in the extratropical tropopause region. J. Geophys. Res. 2007; 112: 09316. DOI: http://dx.doi.org/10.1029/2006JD007792 .
- Parmar R. S. , Welling M. , Andreae M. O. , Helas G . Water vapor release from biomass combustion. Atmos. Chem. Phys. 2008; 8: 6147–6153.
- Paugam R. , Wooster M. , Atherton J. , Freitas S. R. , Schultz M. G. , co-authors . Development and optimization of a wildfire plume rise model based on remote sensing data input. Atmos. Chem. Phys. Discuss. 2015; 15: 9815–9895.
- Petzold A. , Fiebig M. , Flentje H. , Keil A. , Leiterer U. , co-authors . Vertical variability of aerosol properties observed at a continental site during the Lindenberg Aerosol Characterization Experiment (LACE 98). J. Geophys. Res. 2002; 107 LAC 10-1–LAC 10-18. DOI: http://dx.doi.org/10.1029/2001JD001043 .
- Petzold A. , Thouret V. , Gerbig C. , Zahn A. , Brenninkmeijer C. A. M. , co-authors . Global-scale atmosphere monitoring by in-service aircraft current achievements and future prospects of the European research infrastructure IAGOS. Tellus B. 2015; 67
- Petzold A. , Weinzierl B. , Huntrieser H. , Stohl A. , Real E. , co-authors . Perturbation of the European free troposphere aerosol by North American forest fire plumes during the ICARTT-ITOP Experiment in summer 2004. Atmos. Chem. Phys. 2007; 7: 5105–5127. DOI: http://dx.doi.org/SRef-ID:1680-7375/acpd/2007-7-4925 .
- Sauvage B. , Thouret V. , Cammas J.-P. , Gheusi F. , Athier G. , co-authors . Tropospheric ozone over Equatorial Africa: regional aspects from the MOZAIC data. Atmos. Chem. Phys. 2005; 5: 311–335.
- Shuckburgh E. , d'Ovidio F. , Legras B . Local mixing events in the upper troposphere and lower stratosphere. Part II: Seasonal and interannual variability. J. Atmos. Sci. 2009; 66: 3695–3706. DOI: http://dx.doi.org/10.1175/2009JAS2983.1 .
- Singh H. B. , Brune W. H. , Crawford J. H. , Flocke F. , Jacob D. J . Chemistry and transport over the Gulf of Mexico and the Pacific: spring 2006 INTEX-B campaign overview and first results. Atmos. Chem. Phys. 2009; 9: 2301–2318. DOI: http://dx.doi.org/10.5194/acp-9-2301-2009 .
- Stohl A. , Eckhardt S . Intercontinental transport of air pollution: an introduction. 2004; Berlin: Springer. 1–11. In: Intercontinental Transport of Air Pollution (ed. A. Stohl).
- Stohl A. , Forster C. , Frank A. , Seibert P. , Wotawa G . Technical note: the Lagrangian particle dispersion model FLEXPART version 6.2. Atmos. Chem. Phys. 2005; 5: 2461–2474.
- Stohl A. , Thomson D. J . A density correction for Lagrangian particle dispersion models. Boundary Layer Meteorol. 1999; 90: 155–167.
- Thouret V. , Cammas J.-P. , Sauvage B. , Athier G. , Zbinden R. , co-authors . Tropopause referenced ozone climatology and inter-annual variability (1994–2003) from the MOZAIC programme. Atmos. Chem. Phys. 2006; 6: 1033–1051.
- Thouret V. , Marenco A. , Logan J. A. , Nédélec P. , Grouhel C . Comparisons of ozone measurements from the MOZAIC airborne program and the ozone sounding network at eight locations. J. Geophys. Res. 1998; 103: 25695–25720.
- Tilmes S. , Pan L. L. , Hoor P. , Atlas E. , Avery M. A. , co-authors . An aircraft-based upper troposphere lower stratosphere O3, CO, and H2O climatology for the Northern Hemisphere. J. Geophys. Res. 2010; 115: 14303. DOI: http://dx.doi.org/10.1029/2009JD012731 .
- Tressol M. , Ordóñez C. , Zbinden R. , Thouret V. , Mari C. , co-authors . Air pollution during the 2003 European heat wave as seen by MOZAIC airliners. Atmos. Chem. Phys. 2008; 8: 2133–2150.
- Wernli H . A Lagrangian-based analysis of extratropical cyclones, II: a detailed case study. Q. J. Roy. Meteorol. Soc. 1997; 123: 1677–1706.
- Wooster M. J. , Zhang Y. H . Boreal forest fires burn less intensely in Russia than in North America. Geophys. Res. Lett. 2004; 31: 20.