
Abstract
The European Research Infrastructure IAGOS (In-service Aircraft for a Global Observing System) operates a global-scale monitoring system for atmospheric trace gases, aerosols and clouds utilising the existing global civil aircraft. This new monitoring infrastructure builds on the heritage of the former research projects MOZAIC (Measurement of Ozone and Water Vapour on Airbus In-service Aircraft) and CARIBIC (Civil Aircraft for the Regular Investigation of the Atmosphere Based on an Instrument Container). CARIBIC continues within IAGOS and acts as an important airborne measurement reference standard within the wider IAGOS fleet. IAGOS is a major contributor to the in-situ component of the Copernicus Atmosphere Monitoring Service (CAMS), the successor to the Global Monitoring for the Environment and Security – Atmospheric Service, and is providing data for users in science, weather services and atmospherically relevant policy. IAGOS is unique in collecting regular in-situ observations of reactive gases, greenhouse gases and aerosol concentrations in the upper troposphere and lowermost stratosphere (UTLS) at high spatial resolution. It also provides routine vertical profiles of these species in the troposphere over continental sites or regions, many of which are undersampled by other networks or sampling studies, particularly in Africa, Southeast Asia and South America. In combination with MOZAIC and CARIBIC, IAGOS has provided long-term observations of atmospheric chemical composition in the UTLS since 1994. The longest time series are 20 yr of temperature, H2O and O3, and 9–15 yr of aerosols, CO, NO y , CO2, CH4, N2O, SF6, Hg, acetone, ~30 HFCs and ~20 non-methane hydrocarbons. Among the scientific highlights which have emerged from these data sets are observations of extreme concentrations of O3 and CO over the Pacific basin that have never or rarely been recorded over the Atlantic region for the past 12 yr; detailed information on the temporal and regional distributions of O3, CO, H2O, NO y and aerosol particles in the UTLS, including the impacts of cross-tropopause transport, deep convection and lightning on the distribution of these species; characterisation of ice-supersaturated regions in the UTLS; and finally, improved understanding of the spatial distribution of upper tropospheric humidity including the finding that the UTLS is much more humid than previously assumed.
This paper is part of a Special Issue on MOZAIC/IAGOS in Tellus B celebrating 20 years of an ongoing air chemistry-climate research measurement from airbus commercial aircraft operated by an international consortium of countries. More papers from this issue can be found at http://www.tellusb.net
1. Preamble
In the year 2014, the Measurement of Ozone and Water Vapour on Airbus In-service Aircraft (MOZAIC) programme celebrated ‘20 Years of Atmospheric Composition Observations by Commercial Aircraft’. The celebration event was held at the Airbus premises in Toulouse, France, on 12 May, followed by a Scientific Symposium at the International Conference Centre of Météo France in Toulouse from 13 to 15 May. This article serves both as an overview on the European Research Infrastructure In-service Aircraft for a Global Observing System (IAGOS; www.iagos.org), which is the successor of MOZAIC, and as a survey of the scientific achievements of 20 yr of atmospheric research by commercial aircraft, many of which were presented at the scientific symposium.
We will first introduce the scientific rationale of IAGOS and its technical and organisational setup and emphasise its main building blocks as well as the associated fleet of equipped aircraft. Then, the IAGOS database is described, including the concept of data levels, near real-time (NRT) data provision, and data quality assurance and control measures. A major part of the article is dedicated to scientific highlights achieved from IAGOS observations over the past two decades. We will conclude with a discussion of achievements and future prospects and thus provide the framework for the detailed articles published in this special issue.
2. Introduction
Understanding, predicting and mitigating climate change along with its impact on air quality calls for accurate knowledge and long-term surveys of so-called essential climate variables (ECV) on 3-D global scales (IPCC, Citation2013). ECVs have been identified in the framework of the Global Climate Observing System (GCOS, Citation2010) as ‘variables critical for characterising the climate system and its changes’. It is further stated that ‘ECV datasets provide the empirical evidence needed to understand and predict the evolution of climate; to guide mitigation and adaptation measures; to assess risks and enable attribution of climatic events to underlying causes; and to underpin climate services’ (Bojinski et al., Citation2014).
ECVs of the atmosphere domain include atmospheric state parameters, such as temperature, water vapour (H2O), and cloud and aerosol properties as well as long-lived greenhouse gases (GHGs), and important chemically active trace gas species, such as ozone (O3), its precursors and aerosol species. To evaluate and improve important feedback parameterisations used in climate models and hence reduce predictive uncertainties, long-term, high-quality atmospheric observations of these ECVs are required. Indeed, observational capacity is essential for all aspects of atmospheric research, including the assessment of causes for past climate and composition changes as well as the prediction of future changes and their economic and social consequences (IPCC, Citation2014a, Citation2014b).
The European Research Infrastructure IAGOS was initiated in response to the increasing requests for long-term, routine, in-situ observational data with much greater spatial coverage, by using commercial passenger aircraft as measurement platforms. Since commercial aviation operates in the altitude band of 9–13 km, in-service aircraft equipped with small, compact and light-weight scientific instruments for measuring atmospheric trace constituents is a very cost-efficient platform, particularly for in-situ probing of the extratropical upper troposphere/lowermost stratosphere (UTLS). This concept ensures the efficient collection of high-precision, in-situ data with high temporal and spatial resolution at comparatively low operation costs for the infrastructure itself.
IAGOS data are complementary to those collected during sporadic measurement campaigns using research aircraft. However, in contrast to research aircraft, only a limited set of trace constituents can be measured from passenger aircraft due to space, weight and operational limitations. For example, no detailed cloud observations using sophisticated instruments housed in under-wing containers can be carried out, although it has been shown that the latter compare well with basic cloud instruments, for example, Beswick et al. (Citation2014). However, simply due to the high frequency of flights, the data are highly representative of the altitude band and flight corridors frequented by passenger aircraft. Equivalent sampling has not been achieved by research aircraft (Kunz et al., Citation2008). In addition, IAGOS complements space-borne and ground-based observations and adds to the evolving integrated global observing system.
The IAGOS overarching scientific priority is the long-term observation of atmospheric composition in the troposphere and stratosphere and, in particular, the detection of changes in the tropopause region. Since the radiative forcing or change of the atmospheric greenhouse effect is largely driven by changes in the mid-troposphere and UTLS (Solomon et al., Citation2010; Riese et al., Citation2012), this region is extremely important for climate change and dynamical processes governing stratosphere–troposphere exchange (Gettelman et al., Citation2011).
The impact of atmospheric long-range and trans-boundary transport processes on the global distribution of air pollutants and thus on global air quality is another high-priority topic calling for a global-scale observation infrastructure. Recently, the impact of trans-Pacific transport of polluted air masses from Asia on free tropospheric ozone above western North America was identified with the help of IAGOS data (Cooper et al., Citation2010). Therefore, IAGOS may play an important role in monitoring the impact of long-range ozone transport on lowered ozone air quality standards (Cooper et al., Citation2015). Furthermore, the role of deep convection for the transport of gases and aerosol particles into the UTLS in a changing climate is of growing relevance (Randel et al., Citation2010) and may be further investigated with the help of IAGOS observations; see for example, the detection of extreme CO values from boreal fires in the upper troposphere (UT) over Northeast Asia (Nédélec et al., Citation2005) and in the lowermost stratosphere (LS) over North America (Cammas et al., Citation2009).
Long-term observations of ECVs are also needed to better understand the complex feedback mechanisms in the climate system, for example, the amplification of the CO2-induced greenhouse effect by water vapour (Dessler and Sherwood, Citation2009; Lacis et al., Citation2010; Dessler et al., Citation2013) and potential impacts on atmospheric circulation (Voigt and Shaw, Citation2015). The identification of processes controlling the distribution of water vapour in the UTLS by means of long-term IAGOS measurements (Gierens et al., Citation1999; Zahn et al., Citation2014) adds significantly to this subject of research.
According to a recently published cost–benefit analysis for observing systems (Eyre and Reid, Citation2014), using in-service aircraft for atmospheric observations has one of the highest impacts per cost of all observing systems. This approach is realised in the WMO AMDAR (Aircraft Meteorological Data Relay; www.wmo.int/pages/prog/www/GOS/ABO/AMDAR) observing system and will be broadened and complemented by IAGOS.
3. Setup of IAGOS
The European Research Infrastructure IAGOS builds on the experience gained in former research projects MOZAIC and Civil Aircraft for the Regular Investigation of the Atmosphere Based on an Instrument Container (CARIBIC). In 2008, these separate programmes were merged into IAGOS, which now serves as a single infrastructure designed for sustainable long-term and global operation (Volz-Thomas et al., Citation2009). The history of IAGOS and its predecessor programmes MOZAIC (www.iagos.fr/mozaic) and CARIBIC (www.caribic-atmospheric.com) is illustrated in , whereas summarises the objectives of IAGOS and the expected scientific value.
Fig. 1 Evolution of airborne observations using instrumented passenger aircraft from programmes MOZAIC and CARIBIC to IAGOS: the aircraft represent the number of equipped units in operation, with the larger aircraft symbol representing IAGOS-CARIBIC. Observation parameters are indicated for the various evolution stages of the programme.
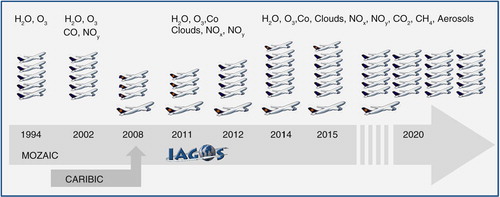
Table 1. Objectives and scientific value of IAGOS research infrastructure
In 2014, the European Research Infrastructure IAGOS was transformed into an International Non-Profit Association under Belgian Law (AISBL) which now manages the operation of IAGOS. The founding members of IAGOS-AISBL are
Forschungszentrum Jülich GmbH (FZJ), Germany,
Centre National de la Recherche Scientifique (CNRS), France,
Max-Planck Gesellschaft zur Förderung der Wissenschaften e.V. (MPG), München, Germany,
Karlsruher Institut für Technologie (KIT), Karlsruhe, Germany,
Deutsches Zentrum für Luft- und Raumfahrt (DLR), Oberpfaffenhofen, Germany,
Leibniz-Institut für Troposphärenforschung e.V. (TROPOS), Leipzig, Germany,
Météo France (MF), Toulouse, France and
University of Manchester (Univ. MAN), Manchester, UK.
Particularly in IAGOS-CARIBIC, further partners are involved, for example, KNMI (de Bilt, the Netherlands), University of East Anglia (UK), Lund University (Sweden), University of Heidelberg (Germany) and LSCE (Gif-Sur-Yvette, France), who may become AISBL members at a later date.
Technically and scientifically, the resulting infrastructure is built from two complementary approaches: the IAGOS-CORE component (see Section 3.1) comprises the implementation and operation of autonomous instruments installed on long-range aircraft of internationally operating airlines for continuous, global-scale and daily measurements of reactive gases and GHGs (e.g. CO2, CH4 and water vapour), as well as aerosol particles, dust and cloud particles. The instruments are designed for fully automated operation aboard the aircraft in unattended mode for several weeks and the data are transmitted automatically to the IAGOS data centre (Volz-Thomas and IAGOS team, Citation2007).
The complementary IAGOS-CARIBIC component (see Section 3.2) consists of a modified cargo container equipped with 15 instruments (status 2015) for measuring a large suite of trace gases and aerosol parameters (Brenninkmeijer and CARIBIC-team, Citation2007; Brenninkmeijer et al., Citation2007). This container is deployed once per month for four inter-continental flights.
The high quality of the entire IAGOS data set is ensured by additional quality issues usually not encountered in more limited sampling efforts. The procedures for data quality assurance and control (QA/QC) and added-value products are linked into the QA/QC programmes of, for example, WMO/GAW, to ensure compatibility with the requirements of Global Atmosphere Watch (GAW) World Data Centres. For this purpose and for preparing the use of IAGOS data in Copernicus Atmosphere Monitoring Service (CAMS) applications, the EU project IGAS [IAGOS for the Global Monitoring of the Environment and Security (GMES) Atmospheric Service] was launched (see Section 3.3).
The dual setup of IAGOS combined with the data QA/QC component of IGAS aims at providing global-scale coverage of key observables on a day-to-day basis, complemented with a more complex set of observations with reduced spatial and temporal coverage. The IAGOS aircraft, their home bases and main destinations are compiled in .
Table 2. Current IAGOS fleet
3.1. IAGOS-CORE
3.1.1. Instrumentation
The atmospheric trace species and properties measured by the IAGOS-CORE instrumentation, applied measurement techniques and respective references are compiled in . The fully equipped IAGOS-CORE instrument rack weight is 100 kg including Package 1 plus optional 60 kg for one version of Package 2 (see below for further details) and is mounted in the avionics bay of Airbus A340/A330 aircraft. shows a photograph of the first IAGOS-CORE aircraft operated by Lufthansa, and shows the IAGOS installation aboard this aircraft. Finally, illustrates the possible configurations for IAGOS-CORE aircraft installations.
Fig. 2 IAGOS-CORE installation position aboard the Lufthansa A340-300 ‘Viersen’ (photograph by courtesy of A. Karmazin); the inset shows details of the IAGOS Inlet Plate, which carries the inlet probes for trace gas sampling (photograph by courtesy of Lufthansa).

Fig. 3 Installation of IAGOS-CORE instrumentation in the avionics bay of Lufthansa D-AIGT.
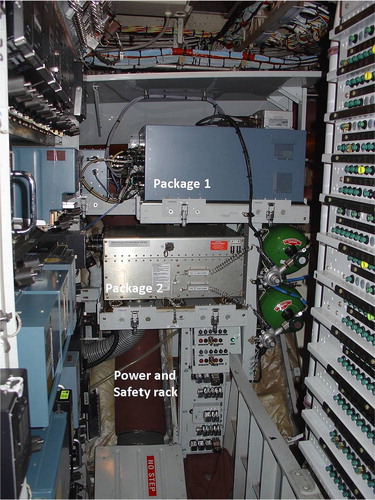
Fig. 4 Available configurations for IAGOS-CORE instrumentation.
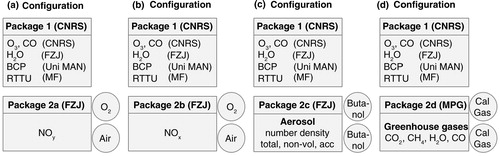
Table 3. IAGOS-CORE instrumentation
The suite of instruments operated on IAGOS-CORE aircraft is based on a modular design. One unit (Package 1) operates on all IAGOS-CORE aircraft and builds on the former MOZAIC setup. It measures ozone, water vapour, carbon monoxide and cloud particle number concentration. The concept of the second unit (Package 2) was introduced during the transition from MOZAIC to IAGOS and includes compact and highly specialised instruments for measuring specific species and properties such as nitrogen-containing compounds (Package 2a: NO y , Package 2b: NO x ), aerosol particle properties (Package 2c) or GHGs (Package 2d: mainly CO2, CH4). In the final configuration of the infrastructure, one option of this second unit (Package 2, options a–d) will be installed on each aircraft. Aiming at a fleet of 20 long-haul aircraft and four different Package 2 units, the final configuration will be five instruments of each Package 2 option on average, ensuring global-scale coverage for each parameter measured.
3.1.2. Fleet and destinations
One of the keys to the success of IAGOS is the participation of airlines which cover the operational costs of including instruments in the aircraft payload. Currently, Deutsche Lufthansa (DLH), Air-France (AF), China Airlines (CAL), Cathay Pacific Airways (CX) and Iberia (IB) support the research infrastructure. At the beginning of 2015, the IAGOS-CORE fleet consisted of four Airbus A340-A300 and two Airbus A330-A300 aircraft.
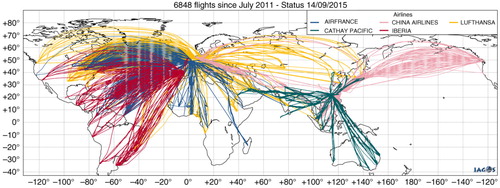
Each aircraft conducts on average 500 flights per year and the entire MOZAIC/IAGOS fleet has visited almost 200 airports since the beginning of the programme. illustrates the number of aircraft and number of flights conducted per year for MOAZIC and then IAGOS-CORE, along with the number of peer-reviewed publications originating from this data set. The global distribution of destinations and the major flight routes are shown in .
Fig. 5 Number of aircraft in operation (bottom panel), number of flights (mid-panel) and cumulative number of scientific publications (top panel) for MOZAIC (until 2014), IAGOS-CORE (from 2011) and IAGOS-CARIBIC.
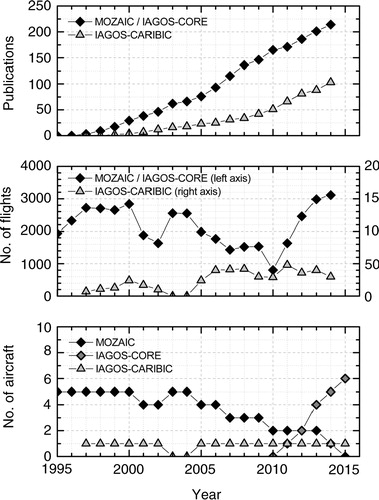
Fig. 6 Map of IAGOS-CORE flights from July 2011 to August 2015.
3.2. IAGOS-CARIBIC
3.2.1. Instrumentation
IAGOS-CARIBIC is based on the former CARIBIC project, flying an instrumented airfreight container once per month for usually four long-distance flights on a passenger aircraft (Brenninkmeijer et al., Citation1999). The IAGOS-CARIBIC aircraft is an Airbus A340–600 of Deutsche Lufthansa (). It is equipped with a complex multipurpose air inlet system (see ) and a measurement container with a total weight of 1.6 t, which houses 15 instruments for in-situ measurements, DOAS remote-sensing and sampling for laboratory post-flight analysis of trace gases and aerosol parameters (Brenninkmeijer et al., Citation2007). A list of measured parameters is compiled in . Data are analysed and quality-checked after flight and are provided to the IAGOS and CARIBIC databases within a few weeks. Regularly, the instrumentation in the container is updated and new/modified instruments are installed. In 2010, the IAGOS-CARIBIC container was fully revised and recertified following European Aviation Safety Agency (EASA) rules. The next container modification is envisaged for 2016.
Fig. 7 IAGOS-CARIBIC aircraft, air inlet system and measurement container (Brenninkmeijer et al., 2007).
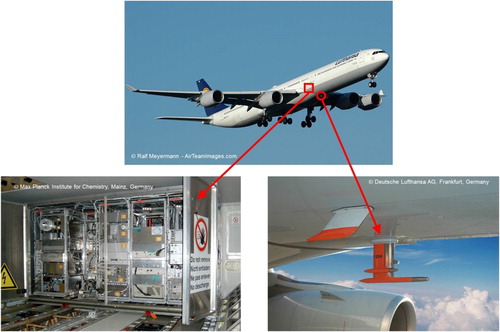
Table 4. IAGOS-CARIBIC instrumentation (as of 2015)
3.2.2. Destinations
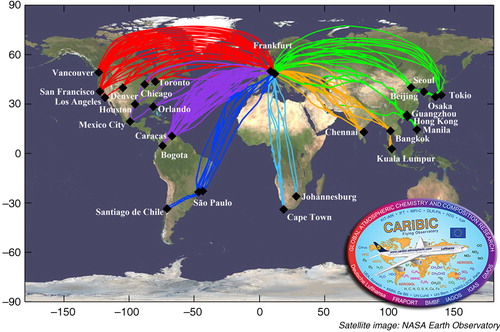
Destinations covered by IAGOS-CARIBIC are Europe-centred as the container is loaded and unloaded in Frankfurt (previously) or Munich (since August 2014), Germany. The majority of flights have destinations in North America, South America and Asia, with a few flights to South Africa and South America. A map of recent destinations is shown in ; see also www.caribic-atmospheric.com for further information. As for MOZAIC and IAGOS-CORE, also illustrates the number of flights and resulting publications for the IAGOS-CARIBIC data set.
Fig. 8 IAGOS-CARIBIC map of flights (May 2005–August 2015).
3.3. IGAS
The project IGAS (www.igas-project.org/), funded by the Seventh EU Framework Programme and launched in 2013, prepares the data collected in IAGOS for direct use in CAMS, including adequate treatment of data QA/QC. As such, it supports the transition of IAGOS into a fully operational system. As a key pre-requisite for long-term monitoring, IGAS develops and implements database tools to increase accessibility and interoperability, as well as to evaluate, harmonise and document the data quality.
For each instrument, standard operating procedures (SOP) are prepared in accordance with, e.g., WMO/GAW Report 153 on Aerosol Measurement Procedures, Guidelines and Recommendations (WMO TD No. 1178, September 2003), and based on existing best practice documents. Currently, best practice approaches require the storage of calibration protocols and raw data as well as data analysis algorithms, so that the reanalysis of long-term data sets is possible whenever necessary. Furthermore, traceable calibration of instruments is an indispensable requirement.
As an example, the reanalysis of MOZAIC water vapour data was successfully conducted after an error in the analysis of calibration data was discovered; see CitationSmit et al. (2014) for details. In the course of this reanalysis, the consistency of sensor calibration parameters over a period of 15 yr was demonstrated.
Another tool for maintaining high data quality is the investigation of Lagrangian matches of air masses probed by different IAGOS aircraft. If a Lagrangian air mass match has been identified, then the data are analysed with respect to data consistency between similar instruments operated on different IAGOS aircraft. Applying this IGAS tool permits the quantification of instrument's reproducibility and consistency.
Once the SOPs for the instruments operated in IAGOS-CORE and IAGOS-CARIBIC are harmonised and agreed upon, they will be published on the IAGOS website. Furthermore, they will be subject to continuous review and improvement, to ensure the high quality and consistency of the data during the period of operation of the infrastructure.
Another core objective of IGAS is to prepare the provision of data streams in both NRT (i.e. within about 6 h) and delayed mode (within 6 months) to CAMS. To ensure NRT transmission, the implementation of a Real-Time Transmission Unit (RTTU) is foreseen to interface with the IAGOS-CORE data acquisition system and to transmit data in flight via satellite communication (Satcom) to the WMO Information System (WIS), where weather forecast centres and CAMS have direct data access.
An alternative solution focuses on after-flight data transmission via GSM (Global System for Mobile communications) to the IAGOS central database; however, this solution does not guarantee the NRT transmission of data collected early in the long-haul flight. Within IGAS, the aeronautical certification, first integration and operation of the first RTTU are planned, paving the way for expansion of the system for the full fleet. The NRT transmission involves BUFR (Binary Universal Form for the Representation of meteorological data) encoding of profile data collected during ascent and descent. To allow for encoding additional parameters collected by the IAGOS-CORE fleet, such as trace gas mixing ratios and size-resolved aerosol concentrations, the BUFR format has been extended in collaboration with WMO.
The use of IAGOS-CORE GHG and aerosol data for both monitoring of the CAMS forecast system and improvement of bias correction of the data assimilated in CAMS is being implemented. Furthermore, IGAS also seeks to enhance IAGOS-CORE and IAGOS-CARIBIC measurement capabilities through dedicated instrument developments for the measurement of aerosols and particularly volcanic ash particles; total water and water vapour; and volatile organic compounds (VOCs).
4. The IAGOS database
4.1. Concept
The IAGOS central database is the main access point for observations measured by the IAGOS fleet. More than 44 000 flights have been carried out since August 1994. The database includes data from the former MOZAIC project (38 494 flights from August 1994 to December 2014), data from the CARIBIC project (390 flights since May 2005) and data, named IAGOS-CORE, from more than 6800 IAGOS flights since July 2011; see for an overview.
The IAGOS data access is handled by an unrestricted access policy after a registration procedure based on the submission of research requests, which are reviewed by the principle investigators (PI). The database is currently accessed by about 500 users consisting of individual scientists and/or institutions and research projects. Database developments are performed by CNRS-LA with support from the French atmospheric chemistry data centre Ether, sponsored by the Centre National d'Etudes Spatiales (CNES) and CNRS.
4.2. Data flow
Unprocessed IAGOS-CORE data first undergo automated validation procedures before being inserted into the database (see ). They are available in NRT within 12 h after landing for operational users such as climate monitoring services (e.g. CAMS). Raw data (L0A) are automatically analysed using pre-flight or in-flight calibrations (L0B). They are further validated by the responsible PI and become available as preliminary data (L1). Final data (L2) are produced after removal of the instrument from the aircraft and post-flight calibration by the responsible PI in the laboratory. Final calibrated IAGOS-CARIBIC data are transmitted from Max-Planck-Institut für Chemie (MPI-C) to the reception server. Climatological data (L3) are then calculated from the final data and added-value products (L4) are processed on computer clusters. The final data are available to end users through the web interface within a maximum of 6 months after they were acquired, depending on the operation period of the instrument. summarises the data levels and their respective descriptions as used in the IAGOS database.
Fig. 9 Data processing path from the aircraft raw state to the user available state. Data levels refer to raw data (L0A), to automatically analysed data using pre-flight or in-flight calibrations (L0B), to data validated by the responsible PI and published as preliminary data (L1) and to final data (L2) after removal of instrument from the aircraft and post-flight calibration. Climatological data (L3) and added-value products (L4) are also available, whereas near real-time (NRT) data are made available for data assimilation and model evaluation.
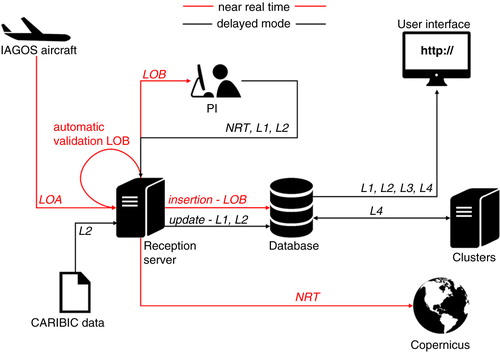
Table 5. IAGOS data levels
4.3. Database content
The IAGOS database contains observations, instrumental parameters and metadata. Each version of a data set (L0, L1, L2 and L4) is stored in the database in order to record the history of maintenance and validation operations. Here, each species measured during one flight is considered a data set with its own data level and version number.
4.3.1. Observations
The database stores in-situ atmospheric chemical and physical observations conducted by MOZAIC, IAGOS-CORE and IAGOS-CARIBIC instruments (see ), the location of the observations and the meteorological parameters measured by the aircraft (see ). Two types of data set are stored in the database. The first one is the time series: observations are provided at 4-s intervals along the flight track from take-off until landing; a typical 10-h flight file contains 9000 lines. The second type is profile data: separated files are created just for flight ascent and descent parts. Format and frequency are the same as for time series. IAGOS-CARIBIC reports time series data with the instrument-specific time response and as merged data with a 10-s time step.
Table 6. IAGOS database measurement products
Table 7. Atmospheric state and aircraft parameters provided by the A340/A330 aircraft system
4.3.2. Metadata
Metadata are standardised to comply with the ISO 19115, INSPIRE norms for representation and the Climate and Forecast (CF) convention for parameter naming; see cfconventions.org for details. It includes
general information about data (contacts, references, scientific objectives),
temporal and geographical extent,
information about parameters,
methodological information (sensors’ characteristics),
data availability (data format, terms of use) and
data quality (methods of validation and calibration).
4.3.3. Added-value products
To help analyse the observations, a tool was developed based on the Stohl et al. (Citation2003) methodology which links the observed atmospheric trace constituents to their sources. This tool simulates recent anthropogenic and biomass burning contributions to the measured carbon monoxide mixing ratio along each IAGOS flight. It is built on the Lagrangian particle dispersion model FLEXPART (version 9.0) and uses European Centre for Medium-range Weather Forecasts (ECMWF) operational analysis data for meteorological fields (1×1°, 31 levels in 1994 to 137 levels in 2013, every 6 h), coupled to emissions from the ECCAD database (www.eccad.sedoo.fr). The main goal is to supply an added-value product to the IAGOS database showing geographical origins and emission types for respective trace species. In addition to each observation, we will therefore provide tropopause heights, potential vorticity (PV) and the pollutant origin. Seasonal O3 and CO averaged horizontal distribution maps are also provided on the Monitoring Atmospheric Composition and Climate (MACC) web pages (www.iagos.fr/macc) and linked to the JOIN interface (www.join.iek.fz-juelich.de/). For IAGOS-CARIBIC, multifaceted additional data along the flight tracks (30 meteorological parameters based on ECMWF data) and back-trajectory calculations are available.
4.4. Web interface
The public website at www.iagos.fr allows users to get the status of the database through many tools (diagrams, maps, tables). Data can be accessed through a private web interface which allows, depending on user roles, the actions itemised below:
manage metadata (for administrator),
validate data and manage instruments (for PIs),
choose the type of data set and the output format,
display flight tracks on a map,
retrieve data within a location bounding box and a time period,
retrieve data related to an airport location and a time period,
generate quick interactive visualisations: vertical profiles, time series and maps,
direct link to download matching data from the Deutsches Zentrum für Luft- und Raumfahrt (DLR) HALO database and
direct link to the JOIN interface in FZJ for intercomparison with MACC data.
Data are provided to the users in standard formats. The output files contain metadata information and are either plain text files respecting the CSV format NASA AMES 1001 or NetCDF binary files compliant with the CF convention.
5. Scientific highlights
Scientific highlights resulting from the exploration of the MOZAIC–CARIBIC–IAGOS database were presented at the Scientific Symposium on ‘20 Years of Atmospheric Composition Observations by Commercial Aircraft’. A report of the symposium was published in the SPARC Newsletter 44 by Thouret and Petzold (2015). This section provides an overview of key scientific topics, to which MOZAIC, CARIBIC and IAGOS contribute significantly, respective scientific achievements and highlights presented at the symposium.
5.1. First sampling of the Pacific area
With the first non-European airline (CAL) equipped with IAGOS instruments starting in July 2012, the IAGOS database has been enriched by the first data covering the northern Pacific region due to regular flights between Taipei and Vancouver. This in-situ data set is now the densest for the region, complementing aircraft-dedicated campaigns (INTEX-A and B, PEM WEST A and B). Clark et al. (Citation2015) present an analysis of the first 2 months of operation based on the complete, fully validated data set (ozone, CO, H2O, cloud particles). The most interesting feature of July and August 2012 data shows two main characteristics: very high CO mixing ratios (CO > 400 ppb) and low ozone mixing ratios (<30 ppb) in the UTLS (cruise altitude, between 9 and 12 km) for latitudes ranging from 30°N to 65°N. As a comparison, such extreme values for ozone and CO have never or rarely been recorded over the Atlantic region over the past 12 yr (the period of common ozone and CO measurements).
5.2. Canadian forest fires in July 2013 – an example for IAGOS large-scale observations
In July 2013, an opportunity emerged to demonstrate the strength of IAGOS observations as part of an integrated global observing system, when smoke plumes from Canadian forest fires reached Europe within a few days in the anti-cyclonic flow around the Azores high-pressure system and resided in the free troposphere over central Europe for several weeks. Elevated levels of carbon monoxide were observed over Europe and North America.
Similar to , IAGOS-equipped aircraft detected high concentrations of CO at cruise altitude across the Atlantic Ocean, in the boundary layer at airports in eastern North America and in the mid-troposphere over Europe. Elevated levels of CO were, for example, found over Detroit on 19 and 20 June 2013 below 2 km where the Canadian fire plume was observed. Four to five days later profiles of CO over Paris and Frankfurt showed an increase of CO in the mid-troposphere between 4 and 8 km. The CO plumes persisted over western Europe for several days, still being evident over Frankfurt until 13 July. shows example profiles from descents into Frankfurt airport, combined with a LIDAR profile over Jülich which captured the fire plume at the same altitude as the IAGOS aircraft, and a forecast map provided by MACC.
Fig. 10 Flights on 5 July 2013 showing enhanced CO at cruise altitude, in the boundary layer over the source region (North America) and in the mid-troposphere over Europe.
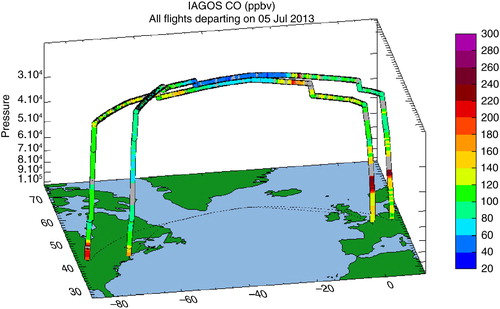
Fig. 11 Top panel: dispersion of Canadian fire plumes over Europe on 8 July 2013. Bottom panel: comparison of the vertical profiles of CO from the MACC-2 forecasts for the July 2013 episode to IAGOS measurements obtained over Frankfurt; the bottom right panel shows a LIDAR backscatter profile taken over Jülich on 12 July 2013 (adapted from Thouret and Petzold, Citation2015).
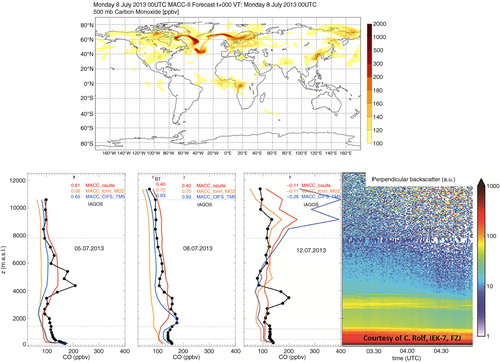
The MACC model partially captured the fire plume during its evolution. In the majority of investigated profiles, enhanced CO is seen at the correct altitude but is not of sufficient magnitude. In other cases, the peak of observed CO is captured by the models but with a delay of 1 or 2 d and it is overestimated. This set of IAGOS data was then widely used for NRT validation of model forecasts on a daily basis; see next section for details.
5.3. NRT data for automatic model forecast validation in preparation to CAMS
One of the main technical improvements from MOZAIC to IAGOS is the transmission of data right after landing, and the objective of delivering a validated (though not calibrated) data set within 3 d, on a ‘best effort basis’. The NRT processing and data transmission capabilities of IAGOS will also make it possible to include the corresponding data stream into operational processing, similar to the aircraft meteorological data relay that is used for numerical weather prediction. So far, ozone and CO measurements are available in NRT, while the provision of water vapour data has been tested and will be operational by the end of 2015. Routine use of MOZAIC-IAGOS data has been particularly useful for an independent validation of the model products developed in the projects GEMS and MACC, the preparatory phases of CAMS; visit www.iagos.fr/macc for details.
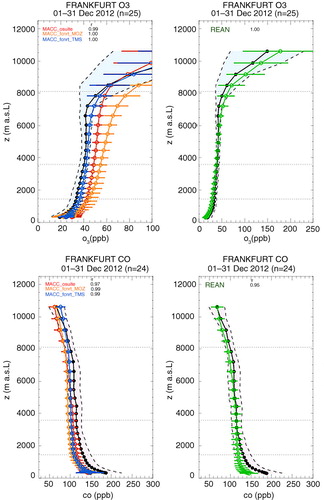
For example, displays the different validation products (different model runs in forecast mode and reanalysis) performed routinely with NRT and final MOZAIC-IAGOS data. This is an example for a monthly mean vertical profile over Frankfurt in December 2012. NRT runs are validated with NRT IAGOS data (available since July 2011) while the reanalysis run is validated with final, fully calibrated MOZAIC and IAGOS data. A complete evaluation of this MACC reanalysis with MOZAIC-IAGOS data is presented by Gaudel et al. (Citation2015). Because of its sampling of the entire troposphere and UTLS, MOZAIC-IAGOS data are of particular interest to further describe large-scale pollution episodes (e.g. biomass burning plumes from Siberia in 2012 and Canada in 2013/2015).
Fig. 12 Monthly mean vertical profiles of ozone (top panels) and CO (bottom panels) over Frankfurt in December 2012, as observed from MOZAIC-IAGOS (black lines) and modelled by different versions of the MACC model (coloured lines) in forecast mode (left panels) and reanalysis mode (right panel). Further examples and details may be found in www.iagos.fr/macc.
5.4. Ozone and CO distribution in the UTLS
Seasonal O3 and CO averaged horizontal distributions are shown in for the period 2001–2011, corresponding to the 10 yr of MOZAIC ozone and CO simultaneous measurements. In contrast to what is observed in the boundary layer (maximum in winter), the seasonal distributions of CO in the UT at northern mid-latitudes show a spring maximum characterising thus the balance between high mixing ratios close to the surface and the most favourable vertical transport processes. This seasonal maximum extends until summer over eastern Asia and northern Canada because of boreal fires. Generally, high CO concentrations in the UT are recorded over regions where intense biomass burning is occurring (e.g. Nédélec et al., Citation2005; Elguindi et al., Citation2010). CO mixing ratios in the LS are on average below 55 ppbv and characterised by the quasi-absence of any seasonal cycle, in contrast to the UT.
Fig. 13 CO (left panels) and ozone (right panels) seasonally averaged distributions in the UT (bottom panels) and in the LS (top panels) as recorded at cruise level by MOZAIC aircraft over the period 2001–2011. Data are averaged on 5°×5° grid cells. Lines UT display data observed between 15 and 45 hPa below the local tropopause (defined as the isoPV surface 2 pvu). Lines LS display data observed above −45 hPa above the local tropopause. Figures are adapted from Thouret et al. (2006) and extended to 2011.
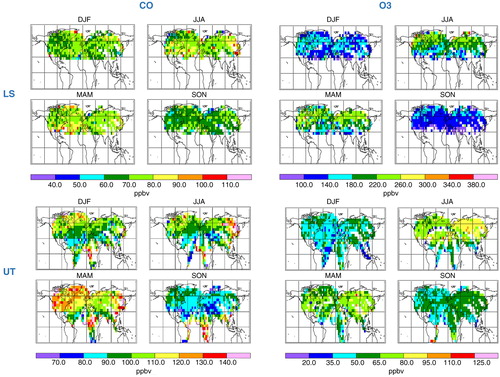
The seasonal distributions of ozone in the UT clearly exhibit a summer maximum characterising the maximum photochemical activity. The photochemical O3 production can be quantified based on the correlation of O3 and CO. Positive correlations in the extratropics in summer or throughout the year in the tropics indicate a net O3 production rate of ~18×1010 O3 molecules cm−2 s−1 over the Arabian Sea and Middle East (Zahn et al., Citation2002). MOZAIC has observed more ozone over the northeastern hemisphere compared to the northwestern one. Highest ozone concentrations are observed over the Mediterranean basin, while minima are sampled over Southeast Asia and Indonesia. High ozone over South America from September through November probably reflects the influence of biomass burning occurring there at this time of year (Yamasoe et al., Citation2015).
The seasonal distributions of ozone in the LS clearly exhibit a spring maximum. Lowest ozone concentrations south of 40°N probably reflect the influence of tropical tropospheric air masses. Further details on the ozone and CO seasonal cycles in the UT and LS for the years 2003–2010 over Europe may be found in Gaudel et al. (Citation2015).
5.5. NO y distribution in the UTLS and the impact of lightning
IAGOS-CARIBIC provides the longest time series of nitrogen oxide measurements in the UTLS so far, starting in 2005 (Stratmann et al.: NO and NOy in the tropopause region: Nine years of CARIBIC measurements onboard a passenger aircraft. Submitted to Atmospheric Environment). Although the concentration of nitrogen oxides is highly variable, this data set lays the foundation for climatology of nitrogen oxides in the UTLS, at least for regions that are regularly covered by IAGOS-CARIBIC flights.
The observations show distinct regional and seasonal differences. A pronounced seasonal cycle is observed for NO and NO y for tropospheric and stratospheric air with maxima in summer and minima in winter in the UT. Over Europe, the median NO y concentration is about 0.95 ppbv in summer and about 0.30 ppbv in winter. In contrast, the maximum median concentration in the LS is observed in spring. Similar seasonal variability is also found for regions like the North Atlantic and northern Asia. Indications are also found for specific sources of nitrogen oxides like biomass burning and air traffic emissions.
For about 5 yr, one aircraft of Lufthansa flew one NO y analyser as part of MOZAIC, which is described in detail by Volz-Thomas et al. (Citation2005) and Pätz et al. (Citation2006). MOZAIC-NO y data have been gathered during 1533 flights, comprising 8500 h of data (Thomas et al., Citation2015). Coincidental measurements of NO y and O3 are available from 1433 flights. Coincidental data of NO y , O3 and CO are available from 1125 flights between January 2002 and May 2005.
The distribution of NO y concentrations measured by the MOZAIC instrument is almost identical to that measured in CARIBIC with a spring maximum in the lower stratosphere and a summer maximum in the UT. The highest concentrations observed in spring over northern Canada are influenced by fire plumes in association with thermal convection (Cammas et al., Citation2009). High mixing ratios are frequently observed over the United States and off the US East Coast. As discussed by Gressent et al. (Citation2014), these plumes are mostly associated with NO production from lightning in combination with large-scale convective transport into the UT.
5.6. H2O distribution in the UTLS
Upper tropospheric humidity (UTH) is one of the still poorly understood climate variables, and the knowledge regarding potential trends and feedback mechanisms of UT water vapour is low because of its large natural variability in the troposphere and relatively short records of observations (IPCC, Citation2013). MOZAIC-IAGOS provides 20 yr of continuous measurements of UTH, using capacitive hygrometers which have been subject to careful evaluation in airborne field studies (Neis et al., Citation2015a, Citation2015b) and reanalysis of the calibration procedure (Smit et al., Citation2014).
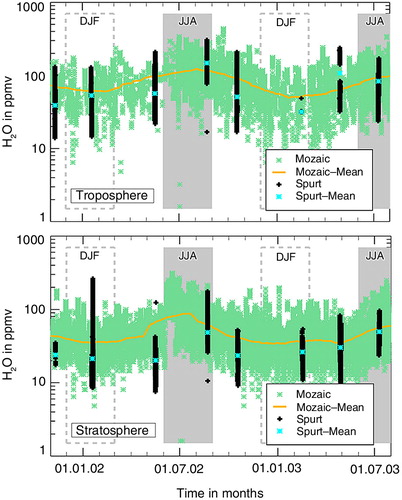
The first climatologies of UTH showed that the UT is much more humid than previously assumed (Gierens et al., Citation1997; Luo et al., Citation2007), and respective corrections have been implemented in the ECMWF integrated forecast system (Tompkins et al., Citation2007). MOZAIC UTH data were also used to infer statistical distributions of ice-supersaturated regions in the UTLS (Gierens and Spichtinger, Citation2000) and of relative humidity in cirrus clouds (Spichtinger et al., Citation2004). An intercomparison of water vapour observations in the UTLS from dedicated research flights during the Spurenstofftransport in der Tropopausenregion (trace gas transport in the tropopause region; SPURT) study and from MOZAIC demonstrated the strong need for regular observations when building climatologies (Kunz et al., Citation2008; Kunz, Citation2010). shows the comparison of SPURT and MOZAIC data, after they had been harmonised according to sensor characteristics and sampling pressure levels; see Kunz (Citation2010) for details. The new IAGOS measurement system with its carefully evaluated compact sensors for water vapour (Neis et al., Citation2015a, Citation2015b) and cloud particles (Beswick et al., Citation2014) offers the opportunity for a combined analysis of UTH data and cloud occurrence information, which is a major step forward in cirrus cloud research; see Clark et al. (Citation2015) and Beswick et al. (Citation2015) as examples.
Fig. 14 Climatology of water vapour in the upper troposphere (top panel) and lowermost stratosphere (bottom panel) from SPURT and MOZAIC; courtesy of A. Kunz (2010).
The IAGOS-CARIBIC H2O instrument is the only instrument of its kind for measuring UTLS water vapour and cloud water/ice with high resolution and accuracy on a regular basis. Comparisons of IAGOS-CARIBIC water vapour, relative humidity and temperature data with the ECMWF forecast and analysis models indicate good agreement for temperature, with a small cold model bias of 0.45K above −40°C (Dyroff et al., Citation2015). Distributions of water vapour and relative humidity also agree well in the UT. In the dry LS, however, both models show a considerable moist bias by 100–150% in summer/autumn and 50–100% in winter/spring ~2 km above the tropopause.
Zahn et al. (Citation2014) studied the transport pathways of water vapour to 9–12 km altitude and the coldest temperatures the air masses had experienced at the Lagrangian cold point (LCP). The LCP sets (by freeze-drying) the H2O mixing ratio that is then conserved until sampling. The fairly representative distributions of water vapour and UTH relative to the tropopause reflect the three dominant transport pathways with surprising clarity: (1) the tropical Hadley circulation, (2) warm conveyor belts and (3) the subsidence of dry stratospheric air within the Brewer–Dobson circulation. With the aid of back-trajectories, the time since the occurrence of the LCP along these pathways is estimated to be 1–2 weeks (pathway 1), 1–2 d (pathway 2) and more than 6 months (pathway 3).
5.7. Trends of ozone, carbon monoxide and water vapour
With over 20 yr of observations, the MOZAIC-IAGOS programme provides the longest in-situ ozone and water vapour data time series using the same instruments, calibration and maintenance procedures (in contrast to the ozone sounding network). With the first 10 yr of regular data, Thouret et al. (Citation2006) and Zbinden et al. (Citation2006) presented the first decadal trends of ozone in the UTLS at cruise altitude over the North Atlantic Ocean and in the troposphere over the most visited airports, showing a slight increase. MOZAIC is the densest data set available and can provide the statistical significance sometimes missing in trend analyses. For example, the results from Cooper et al. (Citation2010) demonstrating the association between Asian emissions and the increase of ozone in the free troposphere above western North America gained statistical significance by adding the MOZAIC data set to the less frequent sounding data. Later, Logan et al. (Citation2012) combined the different available data sets (surface stations, ozone soundings and MOZAIC) for Europe to analyse the consistency of these long time series and their value in deriving significant and coherent trends. Main results are that the various data sets are not consistent before 1998 and that there is no significant trend in tropospheric ozone over Europe since the year 2000. Recently, Tanimoto et al. (Citation2015) investigated the consistency of tropospheric ozone observations from different platforms and techniques and its implications for trend analyses.
Nédélec et al. (Citation2015) describe the new IAGOS ozone and CO instruments and argue for the continued utilisation of the MOZAIC and IAGOS data sets. Indeed, Petetin et al. (Citation2015) utilise the longest uninterrupted time series from MOZAIC and IAGOS covering the years 1994 until 2013, and evaluate ozone and CO trends over Frankfurt. In the same direction, Cooper et al. (Citation2015) highlight the potential role of IAGOS in monitoring the baseline ozone that flows into the western United States and impacts surface air quality in light of a lowered US ozone air quality standard.
The first trend analyses of UTH above the tropical Atlantic are now available, based on the first 10 yr of MOZAIC observations (Kley et al., Citation2007; Luo et al., Citation2007) highlighting climatologies of UTH distribution and the role of deep convection. The analysis of two decades of UTH measurements is currently being studied based on the reanalysed MOZAIC water vapour data set (Smit et al., Citation2014) and subsequent IAGOS observations.
Because of its global coverage and consistent instrumentation over the past 20 yr, MOZAIC-IAGOS undoubtedly constitutes one of the most important data sets for evaluation of ozone and water vapour trends.
5.8. Pollution patterns in the UTLS
One of the scientific strengths of a programme like IAGOS relies on the ‘missing a priori’ sampling strategy. In contrast to dedicated aircraft campaigns which are organised and conducted to sample specific events to investigate specific processes, IAGOS flights have no a priori objective other than to reach the scheduled destination. IAGOS PIs have no influence on the flight operations which are the responsibility of the airlines. Airlines have chosen to build a global network and, therefore, IAGOS is a vast exploratory programme at a global scale. As a result of this approach, Nédélec et al. (Citation2005) reported for the first time very high CO mixing ratios (up to 800 ppb) observed in the UT over northern Asia due to intense boreal fires in Siberia in June 2003. The impact of boreal fires from Alaska or Canada has also been observed in the UTLS over the North Atlantic Ocean as a CO plume of about 250 ppb in summer 2004 (Cammas et al., Citation2009).
The more sophisticated IAGOS-CARIBIC instrumentation allowed for a detailed measurement of pollution patterns (CO, NO y , CH3CN, acetone, ethane, propane, benzene) with significant differences over Europe, central Asia and East Asia (Baker et al., Citation2014). The trace gas concentrations and CO enhancement ratios document different source signatures, for example, stronger influence of long-range import of pollutants over Europe and more local influence of biomass burning lofted by convection over East Asia. The detailed composite of non-methane hydrocarbons (NMHCs) was successfully used to interpret their ratios as a photochemical clock. This technique was applied to the Indian monsoon to infer mean transport times of 4–10 d to the 10–12 km altitude or the partitioning between chemical processing and mixing/dilution (CitationBaker et al., 2011b) and to differentiate between the radical chemistry by OH and chlorine in the plume emitted by the Eyjafjallajökull volcano in Iceland in 2010 (CitationBaker et al., 2011a).
5.9. Characterisation of the extratropical tropopause mixing layer
The IAGOS fleet cruises in stratospheric air up to ~50% of the flight time, depending on flight destination and season, and thus collects a large multitracer data set from the extratropical tropopause mixing layer (ExTL). In the 1–4 km thick ExTL (Hegglin et al., Citation2009) tropospheric and stratospheric air masses are irreversibly mixed. As outlined in a review paper by Gettelman et al. (Citation2011), the balance of processes that govern the chemical composition of the ExTL, their variation in space and time and the types of air masses mixing are not well understood. Using MOZAIC data from 2003, Brioude et al. (Citation2008) identified such a mixing layer in the tropopause region in summer. They found a strong O3–CO anti-correlation, particularly near the wind speed maximum. They concluded that the stirring effect generated by upper level jet streams is likely the main process which influences the distribution of O3 and CO in the tropopause region.
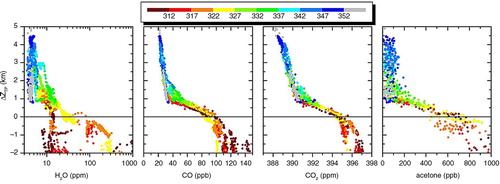
With the large set of tracers measured by IAGOS-CARIBIC that have chemical lifetimes from days to more than 1000 yr, the mixing times and the intrusion depths of tropospheric air into the stratosphere can be inferred. Sprung and Zahn (Citation2010) analysed the distribution of acetone around the mid-latitude tropopause and ascertained mean intrusion heights of 2.2 km (with some seasonality) and ExTL turnover times of 6 weeks. Vertical profiles of acetylene showing a chemical lifetime of ~2 weeks let us conclude that the mixing times increase above the mid-latitude troposphere and are only ~3 weeks within the first kilometre above the tropopause. Example profiles are shown in for H2O, CO, CO2 and acetone relative to the tropopause during a flight from Seoul (Korea) to Frankfurt (Germany) on 28 March 2012. All trace gases decrease in the LS with a distinct kink near 1 km above the tropopause which marks the upper boundary of the ExTL. The correlation changes are dependent on potential temperature (θ). At θ > 352 K (grey symbols), all trace gases show a very compact correlation with height, indicative of aged lower stratospheric air masses not recently affected by mixing with tropospheric air.
Fig. 15 Vertical profiles of H2O, CO, CO2 and acetone relative to the tropopause along a flight from Seoul (Korea) to Frankfurt (Germany) on 28 March 2012. Colour coding: potential temperature in Kelvin.
5.10. Ozone and CO over tropical areas
MOZAIC has provided regular data over regions undersampled by other networks or sampling studies. The most striking example concerns the data over Africa (West Africa and Equatorial Africa in particular), where Air-France and Air Namibia aircraft have enriched the MOZAIC database with highly valuable data. Sauvage et al. (Citation2005) provided the first climatology of ozone and CO over West and Equatorial Africa describing the impact of tropical biomass burning seasons from the two hemispheres on seasonal ozone distributions throughout the troposphere. As a result, this new picture explains the previously so-called ozone paradox (Thompson et al., Citation2000) by highlighting a contribution from Northern Hemisphere fires to the ozone maximum in the Northern Hemisphere, previously undetected by satellites as the plumes were confined to the lower troposphere due to the governing atmospheric dynamical situation (Sauvage et al., Citation2006).
Sauvage et al. (Citation2007) further explained the interhemispheric transport pathway, which results in the observed ozone and CO profiles on both sides of the equator. These detailed analyses of West African data supported the preparation and analysis of the atmospheric composition data recorded in the framework of the international African Monsoon Multidisciplinary Analyses (AMMA) programme (Mari et al., Citation2011) that took place in 2005–2006. MOZAIC helped provide the long-term and regional perspective to place the AMMA data into a wider spatial and temporal context (Thouret et al., Citation2009). Beyond Africa, interesting data have been recorded over South America and are presented by Yamasoe et al. (Citation2015). The data set is not as dense and regular as over Africa but since February 2014 an Iberia aircraft is providing regular IAGOS measurements between Spain and South America (see ).
5.11. UTLS aerosol particle distribution
In-situ measurements of aerosol particles in the UTLS are sparse and IAGOS-CARIBIC has already more than doubled the amount of available data worldwide. This data flow will strongly increase with the start of the IAGOS-CORE aerosol measurements. The first latitudinal distributions of nucleation and Aitken mode particles in the UTLS were presented by Hermann et al. (Citation2003), showing the strong influence of the global vertical circulation pattern (e.g. Hadley cell) on the particle concentrations and already indicating the important role of vertical transport by deep convection. Heintzenberg et al. (Citation2011) used the available aerosol data to generate the first UTLS particle number concentration maps for the Northern Hemisphere. These data were used for comparison with and validation of global models (Ekman et al., Citation2012).
5.12. UTLS aerosol particle elemental composition
Besides aerosol mass spectrometer measurements from research aircraft, IAGOS-CARIBIC is the only larger source of chemical/elemental UTLS particle composition data worldwide. Martinsson et al. (Citation2005) analysed the seasonal behaviour and gradients over the tropopause for sulphur, potassium and iron. Moreover, they used the data to calculate the particulate sulphur production rate in the stratosphere. Using Proton Elastic Scattering Analysis (PESA) as an additional method, Martinsson's group also provided the first statistically sound measurements of particulate organics in the LS and showed that organic carbon is a substantial fraction of the aerosol particle mass (Friberg et al., Citation2014). Using the ratio of Fe to K, biomass burning could be excluded as a major source of this organic material.
5.13. UTLS aerosol particle sources
Two case studies based on research aircraft measurements indicate that deep convective clouds are a source for new particle formation in the UT. Weigelt et al. (Citation2009) analysed several hundred cloud encounters in five geographic regions using IAGOS-CARIBIC data and showed that deep convective clouds in the tropics act as a particle source. Another important source for UTLS aerosols is volcanic eruptions (Andersson et al., Citation2013) with significant impacts on the radiation budget of the LS (Andersson et al., Citation2015) and on cirrus cloud coverage (Friberg et al., Citation2015). Andersson et al. (Citation2013) also calculated the residence time (1/e) of SO2 in two volcanic clouds to be about 45 d.
5.14. Unique data set for satellite and model validation
Finally, MOZAIC and IAGOS provide a unique data set for satellite and model validation, and about one-third of the publications using MOZAIC data refer to validation studies. Law et al. (Citation2000) presented one of the first global studies, while de Laat et al. (Citation2014) recently published a study regarding the validation of MOPITT CO data; an exhaustive list of publications is available on www.iagos.fr. Two other recent examples are published in this issue. Tocquer et al. (Citation2015) present an analysis of high ozone events over India as seen by MOZAIC and IASI. Gaudel et al. (Citation2015) give an overview on the way MOZAIC ozone and CO data in the UTLS are used to validate the MACC reanalysis on a long-term period.
6. Achievements and future prospects
IAGOS originally started in 1993 as a 3-yr European project (MOZAIC) with partners from Germany, France and UK, while CARIBIC was first launched as a European research project in 1997. Twenty years later in 2014, these former research projects of limited duration were successfully transformed into an operational and sustainable European Research Infrastructure. In terms of spatial and temporal coverage and the diversity of the measured parameters, IAGOS complements other observation and monitoring programmes and existing ground- or space-based approaches, and fundamentally contributes to a global observational network by providing a unique instrument platform. The infrastructure is designed to be used in atmospheric research and climate research, including training and further education measures for a period of at least 20 yr. The data are essential for the ‘Atmosphere Monitoring Service’ of the European Copernicus (formerly GMES) programme.
With a fleet of already six permanently equipped aircraft and one laboratory container, IAGOS is currently the only programme providing regular in-situ observations in the UTLS over mid-latitudes at high spatial resolution and regular profiles of GHGs, reactive gases and aerosol concentration in the troposphere over continental sites. In the future, the IAGOS time series of ozone, CO and H2O will retain their high level of data quality because the same instruments will fly for the next 15–20 yr.
The future deployment of a larger fleet of IAGOS-equipped aircraft measuring this wide variety of atmospheric constituents, delivered in near to real time is the most important on-going goal for IAGOS. Furthermore, the potential use of IAGOS in data assimilation (either as an ‘anchor’ for bias-correction schemes or in ‘active’ assimilation) which has been explored in the framework of the MACC projects in preparation for CAMS may become a reality once the fleet is large enough. Interoperability of databases and harmonisation of data products and services for the users with the other European Research Infrastructures is also an important objective for the next 5 yr.
The founding partners of MOZAIC and CARIBIC envisioned that the programmes would significantly enhance the atmospheric observation data available at a global scale, in particular in the UTLS. They expected that the climatologies produced from the data sets would become invaluable for the investigation of seasonal and geographic variability of the observed trace species, and that findings reported by the investigators would provide important new insights into our understanding of atmospheric chemistry (Marenco et al., Citation1998; Brenninkmeijer et al., Citation1999). After 20 yr of operation, the visions have become reality since both research projects have merged into an operational infrastructure which is on its way to become a regular data provider for the validation of atmospheric models and satellite retrievals, and even for numerical weather prediction systems.
7. Acknowledgements
IAGOS gratefully acknowledges financial support during its preparation, implementation and operation phase from the European Commission in FP6 and FP7 programmes, national research programmes in Germany (BMBF), France (INSU-CNRS, MESR, CNES) and UK (NERC), in addition to institutional resources in Germany (Helmholtz Association, Max-Planck-Society, Leibniz Association), France (Université de Toulouse, Météo-France) and the UK (University of Manchester, University of Cambridge), and the continuing support by participating airlines (Deutsche Lufthansa, Air-France, Iberia in Europe, China Airlines and Cathay Pacific in Asia). IGAS has received funding from the European Community's Seventh Framework Programme (FP7/2007–2013) under grant agreement no. 312311. IAGOS wishes to emphasise the excellence of the industrial partners involved in the technical development and realisation: Sabena Technics Bordeaux and Lufthansa Technik Frankfurt for aircraft system definition and certification, LGM Ingénierie for the instrument realisation and aeronautic qualification, and enviscope GmbH Frankfurt for operating the maintenance centre of IAGOS and supporting aeronautic qualification of instruments. The IAGOS team appreciates the detailed comments by two anonymous reviewers which helped improve the manuscript significantly.
IAGOS team
A. Petzold, A. Volz-Thomas, H. G. J. Smit, K. Thomas, S. Rohs, U. Bundke, P. Neis, F. Berkes, N. Houben, M. Berg, M. Tappertzhofen, T. Blomel, W. Pätz (FZJ)
C. Gerbig, J. Marshall, A. Filges, F. Boschetti, S. Verma, S. Baum (MPI-BGC)
V. Thouret, J.-P. Cammas, P. Nédélec, D. Boulanger, G. Athier, J.-M. Cousin, B. Sauvage, R. Blot, H. Clark, A. Gaudel, A. Gressent, A. Auby, A. Fontaine, B. Gautron, Y. Bennouna, and H. Petetin (CNRS/UPS)
M. Pontaud, F. Karcher, C. Abonnel, P. Dandin (Météo-France)
M. Gallagher and K. Beswick (University of Manchester)
K.-Y. Wang (National Central University Taiwan)
C. A. M. Brenninkmeijer, A. Rauthe-Schöch, A. K. Baker, H. Riede, S. Gromov, P. Zimmermann, U. Thorenz, D. Scharffe, C. Koeppel, F. Slemr, T. J. Schuck, T. Umezawa, J. Ditas, Y. Cheng, J. Schneider, J. Williams (MPI-C Mainz)
A. Zahn, M. Neumaier, E. Christner, G. Fischbeck, L. Safadi, A. Petrelli, T. Gehrlein,
S. Heger, C. Dyroff, S. Weber (KIT)
M. Hermann, D. Assmann, F. Rubach, A. Weigelt (TROPOS)
H. Ziereis, G. Stratmann, P. Stock (DLR)
U. Friess, L. Penth, D. Walter, K.-P. Heue (University of Heidelberg)
Y. Allouche C. Marizy (Airbus France), J. Hermira (British Airways/Iberia), Sabrina Bringtown (Air France), G. Saueressig, N. Seidel, M. Huf, A. Waibel (Deutsche Lufthansa AG), H. Franke, C. Klaus, R. Stosius (enviscope GmbH), D. Baumgardner (DMT)
G. Braathen (WMO), M. Paulin (CNES), N. Garnett (NERC)
Notes
This paper is part of a Special Issue on MOZAIC/IAGOS in Tellus B celebrating 20 years of an ongoing air chemistry-climate research measurement from airbus commercial aircraft operated by an international consortium of countries. More papers from this issue can be found at http://www.tellusb.net
References
- Andersson S. M. , Martinsson B. G. , Friberg J. , Brenninkmeijer C. A. M. , Rauthe-Schöch A. , co-authors . Composition and evolution of volcanic aerosol from eruptions of Kasatochi, Sarychev and Eyjafjallajökull in 2008–2010 based on CARIBIC observations. Atmos. Chem. Phys. 2013; 13: 1781–1796. DOI: http://dx.doi.org/10.5194/acp-13-1781-2013 .
- Andersson S. M. , Martinsson B. G. , Vernier J.-P. , Friberg J. , Brenninkmeijer C. A. M. , co-authors . Significant radiative impact of volcanic aerosol in the lowermost stratosphere. Nat. Commun. 2015; 6: 7692. DOI: http://dx.doi.org/10.1038/ncomms8692 .
- Baker A. K. , Rauthe-Schöch A. , Schuck T. J. , Brenninkmeijer C. A. M. , van Velthoven P. F. J. , co-authors . Investigation of chlorine radical chemistry in the Eyjafjallajökull volcanic plume using observed depletions in non-methane hydrocarbons. Geophys. Res. Lett. 2011a; 38: 13801. DOI: http://dx.doi.org/10.1029/2011GL047571 .
- Baker A. K. , Schuck T. J. , Slemr F. , van Velthoven P. , Zahn A. , co-authors . Characterization of non-methane hydrocarbons in Asian summer monsoon outflow observed by the CARIBIC aircraft. Atmos. Chem. Phys. 2011b; 11: 503–518. DOI: http://dx.doi.org/10.5194/acp-11-503-2011 .
- Baker A. K. , Slemr F. , Brenninkmeijer C. A. M . Analysis of non-methane hydrocarbons in air samples collected aboard the CARIBIC passenger aircraft. Atmos. Meas. Tech. 2010; 3: 311–321.
- Baker A. K. , Traud S. , Brenninkmeijer C. A. M. , Hoor P. , Neumaier M. , co-authors . Pollution patterns in the upper troposphere over Europe and Asia observed by CARIBIC. Atmos. Environ. 2014; 96: 245–256. DOI: http://dx.doi.org/10.1016/j.atmosenv.2014.06.010 .
- Beswick K. , Baumgardner D. , Gallagher M. , Raga G. B. , Minnis P. , co-authors . Cirrus properties from commercial aircraft measurements and implications for flight operations. Tellus B. 2015; 67: 27876. DOI: http://dx.doi.org/10.3402/tellusb.v67.27876 .
- Beswick K. , Baumgardner D. , Gallagher M. , Volz-Thomas A. , Nédélec P. , co-authors . The backscatter cloud probe: a compact low-profile autonomous optical spectrometer. Atmos. Meas. Tech. 2014; 7: 1443–1457. DOI: http://dx.doi.org/10.5194/amt-7-1443-2014 .
- Bojinski S. , Verstraete M. , Peterson T. C. , Richter C. , Simmons A. , co-authors . The concept of essential climate variables in support of climate research, applications and policy. Bull. Am. Meteorol. Soc. 2014; 95: 1431–1443. DOI: http://dx.doi.org/10.1175/bams-d-13-00047.1 .
- Brenninkmeijer C. , CARIBIC-team . The CARIBIC aircraft system for detailed, long-term, global-scale measurement of trace gases and aerosol in a changing atmosphere. IGAC Newslett. 2007; 37: 2–9.
- Brenninkmeijer C. A. M. , Crutzen P. , Boumard F. , Dauer T. , Dix B. , co-authors . Civil aircraft for the regular investigation of the atmosphere based on an instrumented container: the new CARIBIC system. Atmos. Chem. Phys. 2007; 7: 4953–4976.
- Brenninkmeijer C. A. M. , Crutzen P. J. , Fischer H. , Gusten H. , Hans W. , co-authors . CARIBIC – civil aircraft for global measurement of trace gases and aerosols in the tropopause region. J. Ocean. Atmos. Technol. 1999; 16: 1373–1383. DOI: http://dx.doi.org/10.1175/1520-0426(1999)016<1373:ccafgm>2.0.co;2 .
- Brioude J. , Cammas J. P. , Cooper O. R. , Nédélec P . Characterization of the composition, structure, and seasonal variation of the mixing layer above the extratropical tropopause as revealed by MOZAIC measurements. J. Geophys. Res. Atmos. 2008; 113: 00b01. DOI: http://dx.doi.org/10.1029/2007jd009184 .
- Bundke U. , Berg M. , Ibrahim A. , Tettich F. , Klaus C. , co-authors . Instrument design, operation and performance of a fully automated aerosol- measuring instrument for operation aboard IAGOS in-service aircraft. Tellus B. 2015; 67: 28339. DOI: http://dx.doi.org/10.3402/tellusb.v67.28339 .
- Cammas J. P. , Brioude J. , Chaboureau J. P. , Duron J. , Mari C. , co-authors . Injection in the lower stratosphere of biomass fire emissions followed by long-range transport: a MOZAIC case study. Atmos. Chem. Phys. 2009; 9: 5829–5846.
- Clark H. L. , Sauvage B. , Thouret V. , Nédélec P. , Blot R. , co-authors . The first regular measurements of ozone, water vapour and carbon monoxide in the Pacific UTLS by IAGOS. Tellus B. 2015; 67: 28385. DOI: http://dx.doi.org/10.3402/tellusb.v67.28385 .
- Cooper O. R. , Langford A. O. , Parrish D. D. , Fahey D. W . Challenges of a lowered U.S. ozone standard. Science. 2015; 348: 1096–1097. DOI: http://dx.doi.org/10.1126/science.aaa5748 .
- Cooper O. R. , Parrish D. D. , Stohl A. , Trainer M. , Nédélec P. , co-authors . Increasing springtime ozone mixing ratios in the free troposphere over western North America. Nature. 2010; 463: 344–348. DOI: http://dx.doi.org/10.1038/nature08708 .
- de Laat A. T. J. , Aben I. , Deeter M. , Nédélec P. , Eskes H. , co-authors . Validation of nine years of MOPITT V5 NIR using MOZAIC/IAGOS measurements: biases and long-term stability. Atmos. Meas. Tech. 2014; 7: 3783–3799. DOI: http://dx.doi.org/10.5194/amt-7-3783-2014 .
- Dessler A. E. , Schoeberl M. R. , Wang T. , Davis S. M. , Rosenlof K. H . Stratospheric water vapor feedback. Proc. Natl. Acad. Sci. USA. 2013; 110: 18087–18091. DOI: http://dx.doi.org/10.1073/pnas.1310344110 .
- Dessler A. E. , Sherwood S. C . A matter of humidity. Science. 2009; 323: 1020–1021. DOI: http://dx.doi.org/10.1126/science.1171264 .
- Dix B. , Brenninkmeijer C. A. M. , Friess U. , Wagner T. , Platt U . Airborne multi-axis DOAS measurements of atmospheric trace gases on CARIBIC long-distance flights. Atmos. Meas. Tech. 2009; 2: 639–652.
- Dyroff C. , Zahn A. , Christner E. , Forbes R. , Tompkins A. M. , co-authors . Comparison of ECMWF analysis and forecast humidity data with CARIBIC upper troposphere and lower stratosphere observations. Q. J. Roy. Meteorol. Soc. 2015; 141: 833–844. DOI: http://dx.doi.org/10.1002/qj.2400 .
- Ekman A. M. L. , Hermann M. , Gross P. , Heintzenberg J. , Kim D. , co-authors . Sub-micrometer aerosol particles in the upper troposphere/lowermost stratosphere as measured by CARIBIC and modeled using the MIT-CAM3 global climate model. J. Geophys. Res. 2012; 117: 11202. DOI: http://dx.doi.org/10.1029/2011jd016777 .
- Elguindi N. , Clark H. , Ordonez C. , Thouret V. , Flemming J. , co-authors . Current status of the ability of the GEMS/MACC models to reproduce the tropospheric CO vertical distribution as measured by MOZAIC. Geosc. Model Dev. 2010; 3: 501–518. DOI: http://dx.doi.org/10.5194/gmd-3-501-2010 .
- Eyre J. , Reid R . Cost–Benefit Studies for Observing Systems. DOI: http://dx.doi.org/10.1002/2015ea000110 .
- Filges A. , Gerbig C. , Chen H. , Franke H. , Klaus C. , co-authors . The IAGOS-CORE Greenhouse Gas (GHG) package: a measurement system for continuous airborne observations of CO2, CH4, H2O and CO. Tellus B. 2015; 67: 27989. DOI: http://dx.doi.org/10.3402/tellusb.v67.27989 .
- Friberg J. , Martinsson B. G. , Andersson S. M. , Brenninkmeijer C. A. M. , Hermann M. , co-authors . Sources of increase in lowermost stratospheric sulphurous and carbonaceous aerosol background concentrations during 1999–2008 derived from CARIBIC flights. Tellus B. 2014; 66: 23428. DOI: http://dx.doi.org/10.3402/tellusb.v66.23428 .
- Friberg J. , Martinsson B. G. , Sporre M. K. , Andersson S. M. , Brenninkmeijer C. A. M. , co-authors . Influence of volcanic eruptions on midlatitude upper tropospheric aerosol and consequences for cirrus clouds. Earth Space Sci. 2015; 2: 285–300. DOI: http://dx.doi.org/10.1002/2015ea000110 .
- Gaudel A. , Clark H. , Thouret V. , Jones L. , Inness A. , co-authors . On the use of MOZAIC-IAGOS data to assess the ability of the MACC reanalysis to reproduce the distribution of O3 and CO in the UTLS over Europe. Tellus B. 2015; 67: 27955. DOI: http://dx.doi.org/10.3402/tellusb.v67.27955 .
- GCOS. Implementation Plan for the Global Observing System for Climate in Support of the UNFCCC. DOI: http://dx.doi.org/10.1007/s005850050846 .
- Gettelman A., Hoor P., Pan L. L., Randel W. J., Hegglin M. I., co-authors. The extratropical upper troposphere and lower stratosphere. Rev. Geophys. 2011; 49: 3003. DOI: http://dx.doi.org/10.1029/2011rg000355.
- Gierens K., Schumann U., Helten M., Smit H., Marenco A. A distribution law for relative humidity in the upper troposphere and lower stratosphere derived from three years of MOZAIC measurements. Ann. Geophys. 1999; 17: 1218–1226. DOI: http://dx.doi.org/10.1007/s005850050846.
- Gierens K. , Spichtinger P . On the size distribution of ice-supersaturated regions in the upper troposphere and lowermost stratosphere. Ann. Geophys. 2000; 18: 499–504. DOI: http://dx.doi.org/10.1007/s005850050907 .
- Gierens K. M. , Schumann U. , Smit H. G. J. , Helten M. , Zangl G . Determination of humidity and temperature fluctuations based on MOZAIC data and parametrisation of persistent contrail coverage for general circulation models. Ann. Geophys. 1997; 15: 1057–1066. DOI: http://dx.doi.org/10.1007/s00585-997-1057-3 .
- Gressent A. , Sauvage B. , Defer E. , Werner Pätz H. , Thomas K. , co-authors . Lightning NOx influence on large-scale NOy and O3 plumes observed over the northern mid-latitudes. Tellus B. 2014; 66: 25544. DOI: http://dx.doi.org/10.3402/tellusb.v66.25544 .
- Hegglin M. I. , Boone C. D. , Manney G. L. , Walker K. A . A global view of the extratropical tropopause transition layer from atmospheric chemistry experiment Fourier transform spectrometer O3, H2O, and CO. J. Geophys. Res. 2009; 114: 00b11. DOI: http://dx.doi.org/10.1029/2008jd009984 .
- Heintzenberg J. , Hermann M. , Weigelt A. , Clarke A. , Kapustin V. , co-authors . Near-global aerosol mapping in the upper troposphere and lowermost stratosphere with data from the CARIBIC project. Tellus B. 2011; 63: 875–890. DOI: http://dx.doi.org/10.1111/j.1600-0889.2011.00578.x .
- Helten M. , Smit H. G. J. , Strater W. , Kley D. , Nédélec P. , co-authors . Calibration and performance of automatic compact instrumentation for the measurement of relative humidity from passenger aircraft. J. Geophys. Res. 1998; 103: 25643–25652. DOI: http://dx.doi.org/10.1029/98jd00536 .
- Hermann M. , Heintzenberg J. , Wiedensohler A. , Zahn A. , Heinrich G. , co-authors . Meridional distributions of aerosol particle number concentrations in the upper troposphere and lower stratosphere obtained by Civil Aircraft for Regular Investigation of the Atmosphere Based on an Instrument Container (CARIBIC) flights. J. Geophys. Res. 2003; 108: 4114. DOI: http://dx.doi.org/10.1029/2001jd001077 .
- Hermann M. , Wiedensohler A . Counting efficiency of condensation particle counters at low-pressures with illustrative data from the upper troposphere. J. Aerosol Sci. 2001; 32: 975–991.
- IPCC. The Physical Science Basis. Contribution of Working Group I to the Fifth Assessment Report of the Intergovernmental Panel on Climate Change. 2013; Cambridge: Cambridge University Press.
- IPCC. Climate Change 2014: Impacts, Adaptation, and Vulnerability. Part A: Global and Sectoral Aspects. Contribution of Working Group II to the Fifth Assessment Report of the Intergovernmental Panel on Climate Change. 2014a; Cambridge: Cambridge University Press.
- IPCC. Climate Change 2014: Impacts, Adaptation, and Vulnerability. Part B: Regional Aspects. Contribution of Working Group II to the Fifth Assessment Report of the Intergovernmental Panel on Climate Change. 2014b; Cambridge: Cambridge University Press.
- Kley D. , Smit H. G. J. , Nawrath S. , Luo Z. , Nédélec P. , co-authors . Tropical Atlantic convection as revealed by ozone and relative humidity measurements. J. Geophys. Res. Atmos. 2007; 112: 23109. DOI: http://dx.doi.org/10.1029/2007jd008599 .
- Kunz A . Observation- and Model-Based Study of the Extratropical UT/LS. 2010; Germany: Forschungszentrum Jülich. PhD Thesis.
- Kunz A. , Schiller C. , Rohrer F. , Smit H. G. J. , Nédélec P. , co-authors . Statistical analysis of water vapour and ozone in the UT/LS observed during SPURT and MOZAIC. Atmos. Chem. Phys. 2008; 8: 6603–6615.
- Lacis A. A. , Schmidt G. A. , Rind D. , Ruedy R. A . Atmospheric CO2: principal control knob governing earth's temperature. Science. 2010; 330: 356–359. DOI: http://dx.doi.org/10.1126/science.1190653 .
- Law K. S. , Plantevin P. H. , Thouret V. , Marenco A. , Asman W. A. H. , co-authors . Comparison between global chemistry transport model results and Measurement of Ozone and Water Vapor by Airbus In-Service Aircraft (MOZAIC) data. J. Geophys. Res. 2000; 105: 1503–1525. DOI: http://dx.doi.org/10.1029/1999jd900474 .
- Logan J. A. , Staehelin J. , Megretskaia I. A. , Cammas J. P. , Thouret V. , co-authors . Changes in ozone over Europe: analysis of ozone measurements from sondes, regular aircraft (MOZAIC) and alpine surface sites. J. Geophys. Res. Atmos. 2012; 117: 09301. DOI: http://dx.doi.org/10.1029/2011jd016952 .
- Luo Z. Z. , Kley D. , Johnson R. H. , Smit H . Ten years of measurements of tropical upper-tropospheric water vapor by MOZAIC. Part I: climatology, variability, transport, and relation to deep convection. J. Clim. 2007; 20: 418–435. DOI: http://dx.doi.org/10.1175/jcli3997.1 .
- Marenco A. , Thouret V. , Nédélec P. , Smit H. , Helten M. , co-authors . Measurement of Ozone and Water Vapor by Airbus In-service Aircraft: the MOZAIC airborne program: an overview. J. Geophys. Res. 1998; 103: 25631–25642. DOI: http://dx.doi.org/10.1029/98jd00977 .
- Mari C. H. , Reeves C. E. , Law K. S. , Ancellet G. , Andres-Hernandez M. D. , co-authors . Atmospheric composition of West Africa: highlights from the AMMA international program. Atmos. Sci. Lett. 2011; 12: 13–18. DOI: http://dx.doi.org/10.1002/asl.289 .
- Martinsson B. G. , Nguyen H. N. , Brenninkmeijer C. A. M. , Zahn A. , Heintzenberg J. , co-authors . Characteristics and origin of lowermost stratospheric aerosol at northern midlatitudes under volcanically quiescent conditions based on CARIBIC observations. J. Geophys. Res. 2005; 110: 12201. DOI: http://dx.doi.org/10.1029/2004jd005644 .
- Nédélec P. , Blot R. , Boulanger D. , Athier G. , Cousin J.-M. , co-authors . Instrumentation on commercial aircraft for monitoring the atmospheric composition on a global scale: the IAGOS system, technical overview of ozone and carbon monoxide measurements. Tellus B. 2015; 67: 27791. DOI: http://dx.doi.org/10.3402/tellusb.v67.27791 .
- Nédélec P. , Cammas J. P. , Thouret V. , Athier G. , Cousin J. M. , co-authors . An improved infra-red carbon monoxide analyser for routine measurements aboard commercial airbus aircraft: technical validation and first scientific results of the MOZAIC program. Atmos. Chem. Phys. 2003; 3: 1551–1564.
- Nédélec P. , Thouret V. , Brioude J. , Sauvage B. , Cammas J. P. , co-authors . Extreme CO concentrations in the upper troposphere over northeast Asia in June 2003 from the in situ MOZAIC aircraft data. Geophys. Res. Lett. 2005; 32: 14807. DOI: http://dx.doi.org/10.1029/2005gl023141 .
- Neis P. , Smit H. G. J. , Krämer M. , Spelten N. , Petzold A . Evaluation of the MOZAIC capacitive hygrometer during the airborne field study CIRRUS-III. Atmos. Meas. Tech. 2015a; 8: 1233–1243. DOI: http://dx.doi.org/10.5194/amt-8-1233-2015 .
- Neis P. , Smit H. G. J. , Rohs S. , Bundke U. , Krämer M. , co-authors . Quality assessment of MOZAIC and IAGOS capacitive hygrometers: insights from airborne field studies. Tellus B. 2015b; 67: 28320. DOI: http://dx.doi.org/10.3402/tellusb.v67.28320 .
- Nguyen H. N. , Gudmundsson A. , Martinsson B. G . Design and calibration of a multi-channel aerosol sampler for tropopause region studies from the CARIBIC platform. Aerosol Sci. Technol. 2006; 40: 649–655. DOI: http://dx.doi.org/10.1080/02786820600767807 .
- Nguyen H. N. , Martinsson B. G . Analysis of C, N and O in aerosol collected on an organic backing using internal blank measurements and variable beam size. Nucl. Instr. Meth. B. 2007; 264: 96–102. DOI: http://dx.doi.org/10.1016/j.nimb.2007.08.001 .
- O'Sullivan D . Temporal and Spatial Variability of Halogenated Compounds and Other Trace Gases. 2008; UK: University of East Anglia. PhD Thesis.
- Pätz H. W. , Volz-Thomas A. , Hegglin M. I. , Brunner D. , Fischer H. , co-authors . In-situ comparison of the NOy instruments flown in MOZAIC and SPURT. Atmos. Chem. Phys. 2006; 6: 2401–2410.
- Petetin H. , Thouret V. , Fontaine A. , Sauvage B. , Athier G. , co-authors . Characterizing tropospheric ozone and CO around Frankfurt between 1994–2012 based on MOZAIC-IAGOS aircraft measurements. Atmos. Chem. Phys. Discuss. 2015; 15: 23841–23891.
- Randel W. J. , Park M. , Emmons L. , Kinnison D. , Bernath P. , co-authors . Asian monsoon transport of pollution to the stratosphere. 2010; 328: 611–613. DOI: http://dx.doi.org/10.1126/science.1182274 .
- Riese M. , Ploeger F. , Rap A. , Vogel B. , Konopka P. , co-authors . Impact of uncertainties in atmospheric mixing on simulated UTLS composition and related radiative effects. J. Geophys. Res. Atmos. 2012; 117: 16305. DOI: http://dx.doi.org/10.1029/2012jd017751 .
- Sauvage B. , Gheusi F. , Thouret V. , Cammas J. P. , Duron J. , co-authors . Medium-range mid-tropospheric transport of ozone and precursors over Africa: two numerical case studies in dry and wet seasons. Atmos. Chem. Phys. 2007; 7: 5357–5370.
- Sauvage B. , Thouret V. , Cammas J. P. , Gheusi F. , Athier G. , co-authors . Tropospheric ozone over Equatorial Africa: regional aspects from the MOZAIC data. Atmos. Chem. Phys. 2005; 5: 311–335.
- Sauvage B. , Thouret V. , Thompson A. M. , Witte J. C. , Cammas J. P. , co-authors . Enhanced view of the “tropical Atlantic ozone paradox” and “zonal wave one” from the in situ MOZAIC and SHADOZ data. J. Geophys. Res. 2006; 111: 01301. DOI: http://dx.doi.org/10.1029/2005jd006241 .
- Scharffe D. , Slemr F. , Brenninkmeijer C. A. M. , Zahn A . Carbon monoxide measurements onboard the CARIBIC passenger aircraft using UV resonance fluorescence. Atmos. Meas. Tech. 2012; 5: 1753–1760. DOI: http://dx.doi.org/10.5194/amt-5-1753-2012 .
- Schuck T. J. , Brenninkmeijer C. A. M. , Slemr F. , Xueref-Remy I. , Zahn A . Greenhouse gas analysis of air samples collected onboard the CARIBIC passenger aircraft. Atmos. Meas. Tech. 2009; 2: 449–464.
- Schwarz J. P. , Gao R. S. , Fahey D. W. , Thomson D. S. , Watts L. A. , co-authors . Single-particle measurements of midlatitude black carbon and light-scattering aerosols from the boundary layer to the lower stratosphere. J. Geophys. Res. 2006; 111: 16207. DOI: http://dx.doi.org/10.1029/2006jd007076 .
- Slemr F. , Ebinghaus R. , Brenninkmeijer C. A. M. , Hermann M. , Kock H. H. , co-authors . Gaseous mercury distribution in the upper troposphere and lower stratosphere observed onboard the CARIBIC passenger aircraft. Atmos. Chem. Phys. 2009; 9: 1957–1969.
- Smit H. G. J. , Rohs S. , Neis P. , Boulanger D. , Krämer M. , co-authors . Technical note: reanalysis of upper troposphere humidity data from the MOZAIC programme for the period 1994 to 2009. Atmos. Chem. Phys. 2014; 14: 13241–13255. DOI: http://dx.doi.org/10.5194/acp-14-13241-2014 .
- Solomon S. , Rosenlof K. H. , Portmann R. W. , Daniel J. S. , Davis S. M. , co-authors . Contributions of stratospheric water vapor to decadal changes in the rate of global warming. Science. 2010; 327: 1219–1223. DOI: http://dx.doi.org/10.1126/science.1182488 .
- Spichtinger P. , Gierens K. , Smit H. G. J. , Ovarlez J. , Gayet J. F . On the distribution of relative humidity in cirrus clouds. Atmos. Chem. Phys. 2004; 4: 639–647.
- Sprung D. , Zahn A . Acetone in the upper troposphere/lowermost stratosphere measured by the CARIBIC passenger aircraft: distribution, seasonal cycle, and variability. J. Geophys. Res. 2010; 115: 16301. DOI: http://dx.doi.org/10.1029/2009jd012099 .
- Stohl A. , Forster C. , Eckhardt S. , Spichtinger N. , Huntrieser H. , co-authors . A backward modeling study of intercontinental pollution transport using aircraft measurements. J. Geophys. Res. 2003; 108: 4370. DOI: http://dx.doi.org/10.1029/2002JD002862 .
- Tanimoto H. , Zbinden R. , Thouret V. , Nédélec P . Consistency of tropospheric ozone observations by different platforms and techniques in the global databases: implications for trend analysis. Tellus B. 2015; 67: 27073. DOI: http://dx.doi.org/10.3402/tellusb.v67.27073 .
- Thomas K. , Berg M. , Boulanger D. , Houben N. , Gressent A. , co-authors . Climatology of NOy in the troposphere and UTLS from measurements made in MOZAIC. Tellus B. 2015; 67: 28793. DOI: http://dx.doi.org/10.3402/tellusb.v67.28793 .
- Thompson A. M. , Doddridge B. G. , Witte J. C. , Hudson R. D. , Luke W. T. , co-authors . A tropical Atlantic paradox: shipboard and satellite views of a tropospheric ozone maximum and wave-one in January–February 1999. Geophys. Res. Lett. 2000; 27: 3317–3320. DOI: http://dx.doi.org/10.1029/1999gl011273 .
- Thouret V. , Cammas J. P. , Sauvage B. , Athier G. , Zbinden R. , co-authors . Tropopause referenced ozone climatology and inter-annual variability (1994–2003) from the MOZAIC programme. Atmos. Chem. Phys. 2006; 6: 1033–1051. DOI: http://dx.doi.org/10.5194/acp-6-1033-2006 .
- Thouret V. , Marenco A. , Logan J. A. , Nédélec P. , Grouhel C . Comparisons of ozone measurements from the MOZAIC airborne program and the ozone sounding network at eight locations. J. Geophys. Res. Atmos. 1998; 103: 25695–25720.
- Thouret V. , Petzold A . Report on the MOZAIC–IAGOS Scientific Symposium on Atmospheric Composition Observations by Commercial Aircraft: 20th Anniversary. 2015; Toulouse, France: SPARC Newsletter 44. 18–24. 12–15 May 2014.
- Thouret V. , Saunois M. , Minga A. , Mariscal A. , Sauvage B. , co-authors . An overview of two years of ozone radio soundings over Cotonou as part of AMMA. Atmos. Chem. Phys. 2009; 9: 6157–6174.
- Tocquer F. , Barret B. , Mari C. , Le Flochmoen E. , Cammas J. P. , co-authors . An upper tropospheric ‘ozone river’ from Africa to India during the 2008 Asian post-monsoon season. Tellus B. 2015; 67: 25350. DOI: http://dx.doi.org/10.3402/tellusb.v67.25350 .
- Tompkins A. M. , Gierens K. , Radel G . Ice supersaturation in the ECMWF integrated forecast system. Q. J. Roy. Meteorol. Soc. 2007; 133: 53–63. DOI: http://dx.doi.org/10.1002/qj.14 .
- Voigt A. , Shaw T. A . Circulation response to warming shaped by radiative changes of clouds and water vapour. Nat. Geosci. 2015; 8: 102–106. DOI: http://dx.doi.org/10.1038/ngeo2345 .
- Volz-Thomas A. , Berg M. , Heil T. , Houben N. , Lerner A. , co-authors . Measurements of total odd nitrogen (NOy) aboard MOZAIC in-service aircraft: instrument design, operation and performance. Atmos. Chem. Phys. 2005; 5: 583–595.
- Volz-Thomas A. , Cammas J.-P. , Brenninkmeijer C. A. M. , Machida T. , Cooper O. , co-authors . Civil aviation monitors air quality and climate. EM Magazine, Air & Waste Management Association. 2009; 16–19. October 2009.
- Volz-Thomas A. , IAGOS-team . In-service aircraft for global observations – the future. IGAC Newslett. 2007; 37: 18–22.
- Weigelt A. , Hermann M. , van Velthoven P. F. J. , Brenninkmeijer C. A. M. , Schlaf G. , co-authors . Influence of clouds on aerosol particle number concentrations in the upper troposphere. J. Geophys. Res. Atmos. 2009; 114: 01204. DOI: http://dx.doi.org/10.1029/2008jd009805 .
- WMO. Aircraft Meteorological Data Relay (AMDAR) Reference Manual. 2003; Geneva, Switzerland: World Meteorological Organization. WMO Report No. 958.
- Yamasoe M. , Sauvage B. , Thouret V. , Nédélec P. , LeFlochmoen E. , co-authors . Analysis of tropospheric ozone and carbon monoxide profiles over South America based on MOZAIC/IAGOS database and model simulations. Tellus B. 2015; 67: 27884. DOI: http://dx.doi.org/10.3402/tellusb.v67.27884 .
- Zahn A. , Brenninkmeijer C. A. M. , Crutzen P. J. , Heinrich G. , Fischer H. , co-authors . Distributions and relationships of O3 and CO in the upper troposphere: the CARIBIC aircraft results 1997–2001. J. Geophys. Res. 2002; 107: 4337. DOI: http://dx.doi.org/10.1029/2001JD001529 .
- Zahn A. , Christner E. , van Velthoven P. F. J. , Rauthe-Schoech A. , Brenninkmeijer C. A. M . Processes controlling water vapor in the upper troposphere/lowermost stratosphere: an analysis of 8 years of monthly measurements by the IAGOS-CARIBIC observatory. J. Geophys. Res. Atmos. 2014; 119: 11505–11525. DOI: http://dx.doi.org/10.1002/2014jd021687 .
- Zahn A. , Weppner J. , Widmann H. , Schlote-Holubek K. , Burger B. , co-authors . A fast and precise chemiluminescence ozone detector for eddy flux and airborne application. Atmos. Meas. Tech. 2012; 5: 363–375. DOI: http://dx.doi.org/10.5194/amt-5-363-2012 .
- Zbinden R. M. , Cammas J. P. , Thouret V. , Nédélec P. , Karcher F. , co-authors . Mid-latitude tropospheric ozone columns from the MOZAIC program: climatology and interannual variability. Atmos. Chem. Phys. 2006; 6: 1053–1073.
- Ziereis H. , Schlager H. , Schulte P. , van Velthoven P. F. J. , Slemr F . Distributions of NO, NOx, and NOy in the upper troposphere and lower stratosphere between 28° and 61° N during POLINAT 2. J. Geophys. Res. 2000; 105: 3653–3664. DOI: http://dx.doi.org/10.1029/1999jd900870 .