
Abstract
In December 2000, a fully automatic NOy instrument was installed on one of the five Airbus A340 aircraft used in the MOZAIC project (Measurement of Ozone and Water Vapour by Airbus in-service Aircraft) for measurements of O3 and H2O since 1994. This long-range aircraft was operated by Lufthansa, mainly out of Frankfurt and Munich. After an initial testing period, regular data collection started in May 2001. Until May 2005, 1533 flights have been recorded, corresponding to 8500 flight hours of NOy measurements. Concurrent data of NOy and O3 are available from 1433 flights and concurrent data for CO, O3 and NOy exist from 1125 flights since 2002. The paper describes the data availability in terms of geographical, vertical and seasonal distribution and discusses the quality and limitations of the data, including interference by HCN. The vast majority of vertical profiles were measured over Frankfurt, followed by Munich and North American airports. While most of the data were collected in the upper troposphere and lower stratosphere over the North Atlantic, significant data sets exist also from flights to Far and Middle East, whereas data from the tropics and the Southern Hemisphere are relatively sparse.
This paper is part of a Special Issue on MOZAIC/IAGOS in Tellus B celebrating 20 years of an ongoing air chemistry-climate research measurement from airbus commercial aircraft operated by an international consortium of countries. More papers from this issue can be found at http://www.tellusb.net
To access the supplementary material to this article, please see Supplementary files under ‘Article Tools’.
1. Introduction
Nitrogen oxides play a key role in atmospheric photochemistry by catalysing the recycling of free radicals and the formation of ozone (e.g. Crutzen, Citation1973). The distribution and variability of nitrogen oxides is still not well known, particularly in the upper troposphere and lower stratosphere (UT/LS). Existing data from several field campaigns suggest a large variability and significant differences in the partitioning of NOy into active compounds, that is, NOx (NO+NO2) and reservoir species such as HNO3, HNO4, PAN and other organic nitrates (e.g. Talbot et al., Citation1999; Neuman et al., Citation2001; Bertram et al., Citation2007; Hudman et al., Citation2007). The different sources of NOy to the upper troposphere include lightning (Schumann and Huntrieser, Citation2007) and emissions by aircraft (cf. Schumann et al., Citation2000, and references therein), uplifting of surface emissions (cf. Gressent et al., Citation2014) and downward transport from the stratosphere (cf. Neuman et al., Citation2001).
In addition to research aircraft, commercial aircraft have been used for measurements of nitrogen oxides as part of the European projects NOXAR (Nitrogen Oxides and Ozone along Air Routes; cf. Brunner et al., Citation1998), POLINAT-2 (Pollution from Aircraft Emissions in the North Atlantic Flight Corridor; cf. Ziereis et al., Citation2000) and CARIBIC (Civil Aircraft for the regular investigation of the atmosphere based on an instrumented Container; cf. Brenninkmeijer et al., Citation2007). Measurements made from commercial aircraft are complementary to those made from research aircraft during dedicated field campaigns. They are particularly valuable for establishing information on the climatology of trace species in the UT/LS and on their vertical distribution in the troposphere, including their annual and inter-annual variability. Other than research aircraft, commercial aircraft fly basically every day and hence provide data in much larger quantities than can be obtained with research aircraft. An important aspect is that the cruise altitude of commercial long-range aircraft of the type Airbus A340 as used for MOZAIC coincides with the average tropopause (TP) height at mid-latitudes. The measurements made in MOZAIC thus help to gain a better understanding of the downward transport of O3 from the stratosphere (cf. Murphy et al., Citation1993; Murphy and Fahey, Citation1994), and, together with measurements of O3 and CO, to discriminate the impact of lightning and aircraft emissions on the UT/LS from the influence of convective transport of surface emissions into the UT/LS (cf. Gressent et al., Citation2014). Drawbacks of using commercial aircraft for atmospheric research are significant limitations in size, weight and accessibility of the instruments (see below). Moreover, influence on flight routes is very limited, which can introduce a significant bias in the data sets. For example, commercial aircraft try to avoid storms and strong head winds. Other important limitations are that many areas of the world are not served by A340 aircraft and that the vertical profiles are almost exclusively obtained over large cities.
MOZAIC started in 1994 with measurements of O3 and H2O (cf. Helten et al., Citation1998; Marenco et al., Citation1998; Thouret et al., Citation1998) made on five Airbus A340 aircraft operated by Lufthansa, Air France, Sabena and Austrian. The Sabena aircraft was later operated by Lufthansa and Air Namibia. In the second phase of MOZAIC, a NOy instrument was build and integrated in 2000 on one of the two MOZAIC aircraft operated by Lufthansa (Volz-Thomas et al., Citation2005) and a CO instrument was added in 2002 on all five MOZAIC aircraft (Nédélec et al., Citation2003). In this paper, we describe the installation of the MOZAIC NOy instrument and present the data obtained in the troposphere and lower stratosphere during 1533 flights (8500 h) between May 2001 and May 2005. Besides a discussion of the data quality and the statistics of the data set in terms of geographical coverage and vertical distribution, examples are presented on the distribution of NOy in the UT/LS, including the correlation of NOy with O3.
2. Experimental
The MOZAIC NOy instrument is described in detail by Volz-Thomas et al. (Citation2005). Briefly, total odd nitrogen (NOy) is measured by catalytic reduction of the different NOy compounds on a gold surface at 300°C to NO using H2 (0.1–0.2 ml/min) as reducing agent, followed by detection of the NO by chemiluminescence with O3 (cf. Drummond et al., Citation1985; Fahey et al., Citation1985; Kliner et al., Citation1997). The O3 is produced by a silent discharge in oxygen (10 ml/min; purity 5.0). The chemiluminescence detector (CLD) employs photon counting and a chemical procedure for determining the background of the photo multiplier (PMT) and chemiluminescence arising from impurities and other atmospheric species, as described in detail by Drummond et al. (Citation1985). This so-called zero mode is enabled every 28 s for 4 s.
Because of limitations in weight, size, and the supply of O2 and H2 for long-term (4–8 weeks) unattended operation, the instrument employs a very low sample flow (90 sccm) and thus has a substantially lower sensitivity (0.4–0.7 cps/ppt) than what is normally achieved in instruments flown on research aircraft (e.g. Ridley et al., Citation1994; Kondo et al., Citation1997; Ziereis et al., Citation2000). Another limitation imposed by the requirement for unattended operation is that the gold converter is cleaned by heating to 450°C during the first 30 min of each flight before being reset to 300°C for ambient measurements. Consequently, vertical profiles of NOy are only available during descent. Furthermore, the instrument is switched into stand-by mode at an altitude corresponding to 800 hPa. During stand-by, the instrument is continuously back-flushed with a small flow of O2 which is exhausted through the inlet line in order to avoid contamination of the instrument on the airport. In April 2004, the setting was changed to 900 hPa in order to obtain more data from the lower troposphere.
The raw signal of the CLD is recorded at a resolution of 0.1 s in order to minimise transients between measure and zero mode and to discriminate signals due to NO from close-by aircraft emissions.
2.1. Installation and operation
In December 2000, the NOy instrument was installed in an Airbus A340–300 operated by Lufthansa (registration: D-AIGI), one of the five aircraft equipped since 1994 with the MOZAIC rack for measurements of O3 and relative humidity (cf. Helten et al., Citation1998; Marenco et al., Citation1998), and carbon monoxide since 2002 (Nédélec et al., Citation2003). Installation of the NOy instrument was designed in cooperation with enviscope GmbH and Lufthansa Technik AG, who certified the design and conducted the maintenance required for continued airworthiness of the equipment. The instrument was installed on the port-side of the avionics compartment (see ), as closely as possible to the flange carrying the MOZAIC inlet probes. The flange was modified by fitting a second Rosemount (Model 102BX) housing, identical to the one used for MOZAIC humidity measurements, as well as a backward facing outlet for venting the exhaust gases of the NOy instrument. Another outlet was added for connection of the discharge line required for safe operation of oxygen cylinders aboard passenger aircraft.
Fig. 1 MOZAIC NOy instrument installed in the avionic bay of the Airbus A340–300 D-AIGI operated by Lufthansa. The lower part shows the MOZAIC Inlet Plate with the different inlet probes, mounted at the fuselage of the aircraft. The fat arrow denotes the position of the inlet plate inside the aircraft.
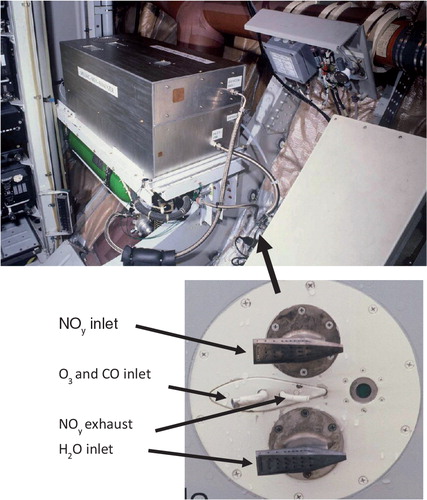
The inlet line of the NOy instrument consists of a 1/8″ OD, 80 cm long FEP (fluorinated ethylene propylene copolymer) tube. The front end of the tube is inserted 11 cm into the Rosemount housing. This section is heated to >20°C in order to reduce the memory for HNO3 (Neuman et al., Citation1999). The inlet line is an integral part of the NOy instrument and is removed from the aircraft with the instrument for maintenance.
For operation, the NOy instrument was transported from Jülich to the home base of the D-AIGT (Frankfurt, Munich or Düsseldorf) where it was installed during a regular maintenance check of the aircraft. Thereafter, it remained on board for a period of 4–8 weeks (50–150 long-haul flights), operating fully automatically. After this period, the instrument was removed from the aircraft and brought back to the laboratory for several days up to several weeks for recalibration and maintenance before re-installation. In December 2001, a second identical instrument (SN2) had been built for alternating deployment. The deployment periods are depicted in Supplementary Fig. A1.
2.2. Calibration
The NOy instrument is calibrated in the laboratory before and after each deployment. Calibration during maintenance includes the following steps:
The sensitivity of the CLD is determined by applying an excess flow of a mixture with known NO mixing ratios to the inlet of the instrument. The mixture is produced by dynamic dilution of a secondary standard [10 ppm NO in ultrapure (6.0) N2] with zero air [a mixture of 21% O2 (5.0), 79% N2 (6.0)] in order to generate NO mixing ratios in the range of 1–20 ppb. The flow rates are maintained by capillaries and thermal mass-flow controllers and are quantified with calibrated volumetric flow meters.
The conversion efficiency of the converter is determined with NO2 produced by gas phase titration (GPT) of the NO calibration gas with O3 generated in a small flow of oxygen by UV radiation. The O3 mixing ratio is adjusted to convert 70–80% of the NO mixing ratio to NO2.
The conversion efficiency for HNO3 is checked during maintenance using a permeation source. The permeation rate is quantified by absorption of the outflow of the permeation source in water followed by ion chromatographic analysis of the absorbed NO3 − against a weighted reference solution.
Additional calibration checks are made several times during each flight. The latter employ the addition of a NO calibration gas for determination of the sensitivity of the CLD and of NO2 for determination of the converter efficiency (cf. Volz-Thomas et al., Citation2005). The NO2 is produced in-situ from the NO calibration gas by GPT with O3 in the same way as at ground. The calibration gas (10 ppm NO in high-purity N2) is contained in a 400 ml stainless steel cylinder inside the instrument. The cylinder is filled before each deployment and the NO mixing ratio is determined after filling by comparison to the laboratory standard. The calibration gas flow is controlled by capillaries at a flow rate of approximately 0.2 sccm and is added to the sample flow at the inlet manifold. The calibration gas flow is enabled 10 min before each calibration. During this phase, calibration gas flows continuously to the inlet manifold, where it is pumped away through a critical orifice together with a small excess of sample air. Calibration is enabled by closing the magnetic valve on the pumping line. This procedure ensures a short transient time (<1 min) before the calibration signal reaches a stable value. In between calibrations, the instrument is switched back to ambient air. The calibration signal is then determined from the difference between the signal measured during calibration and the ambient air signal before and after each calibration. In addition, the background of the instrument for NOy (denoted artefact NOy signal) is checked several times during each flight by overflowing the inlet line with oxygen.
2.3. Data processing
Data processing comprises the following steps:
1. Interpolation of the zero mode signals (S_ZM(t)) of the CLD.1
The constants A and B are determined from least squares fits to all data from one flight. The model behind eq. (1) is that the CLD background is composed of a slowly varying part (A(t)), which includes the background of the PMT and chemiluminescence produced by impurities, and a second part (B*S_MM(t)) which is due to the chemiluminescence from the fraction of ambient NO remaining behind the pre-reaction volume. The fraction B is constant during each flight and is determined from the data obtained during calibrations, where S_MM(t)≫S_ZM(t). B is typically in the range of 0.01–0.1.
2. Calculation of the net NO signal2
where S_ZM(t) is the interpolated zero mode signal at the time of S_MM(t).
3. Determination of the artefact NOy signal (S_BG(t)) by interpolation of the measurements made by overflowing the inlet line with oxygen.
4. Conversion of the net ambient NOy signal (S_NO(t) – S_BG(t)) to mixing ratio with the sensitivity of the CLD (S) and the converter efficiency (E) determined from the calibrations before and after deployment, and from the in-flight calibration checks.3
5. Calculation of 4 s averages of µ_NOy and synchronisation of the time of the NOy data to that of the main MOZAIC data set. The latter is achieved by adjusting the time of the NOy data to match distinct changes in the pressure measured in the inlet line of the NOy instrument, that is, when the aircraft changes altitude, to the pressure changes recorded by the MOZAIC data acquisition system. The time resolution of 4 s used in MOZAIC corresponds to a horizontal resolution of approximately 1 km at cruise speed.
2.4. Performance
During MOZAIC operation, the CLD had a sensitivity of 200–600 cps/ppb and the gold converter usually had a conversion efficiency of >95% for NO2 and HNO3. During some periods, however, the conversion efficiency was found to deteriorate significantly. In these cases, the data were not sent to the database (see grey-shaded areas in Supplementary Fig. A1). The conversion efficiency of the converter for NO2 and HNO3 was found to be independent of pressure between 150 and 1000 hPa. This is due to the fact that the converter is longer than theoretically required for the flow rate applied and the relatively homogeneous temperature profile of the converter (cf. Pätz et al., Citation2006). As detailed in Volz-Thomas et al. (Citation2005), conversion of HNO3 was always found to be equal or better than that for NO2. Conversion of NH3 and CH3CN was found negligible (<1% and >0.2%, respectively). The conversion of N2O was found to be <5×10⁻⁵%, corresponding to an interference of <0.2 ppt by ambient N2O levels. An important interference of the MOZAIC instrument is HCN, which is converted with an efficiency of 100%, similar to the results obtained by Kliner et al. (Citation1997) for using H2 as reducing agent. As discussed below, a significant fraction of the NOy mixing ratios observed in the troposphere can thus be due to the presence of HCN. While the use of CO as reducing agent would have reduced the interference to 40% or less (Fahey et al., Citation1985; Kondo et al., Citation1997; Bradshaw et al., Citation1998; Weinheimer et al., Citation1998; Volz-Thomas et al., Citation2005), this was prohibited in the MOZAIC installation because of the toxicity of CO.
The performance of the MOZAIC NOy instrument was investigated by comparison to an ECO Physics Model 790 SR instrument operated by ETH Zürich and MPI Mainz aboard a Learjet A35 during the German project SPURT (Engel et al., Citation2006; Hegglin et al., Citation2006). As detailed in Pätz et al. (Citation2006), the comparison confirmed the characteristics of the MOZAIC instrument (see above) in terms of precision and accuracy. The overall uncertainty was ±6.5% (2 sigma) from calibration errors and ±100 ppt (2 sigma) from instrumental background. The offset of 43±2 ppt in the correlation between the data of the two instruments also gave an, albeit weak, indication for the presence of interferences by atmospheric HCN for the MOZAIC instrument.
The memory for HNO3 caused by the inlet line of the MOZAIC instrument (20 s for 67% recovery of a step change; 90–150 s for 90% recovery; see Volz-Thomas et al., Citation2005) was also confirmed by the comparison. The MOZAIC instrument exhibited a symmetric memory when entering or leaving the stratosphere, as seen from the correlation with O3. The SPURT instrument, which had the gold converter mounted outside of the fuselage, exhibited basically no memory when entering the stratosphere. When leaving the stratosphere, however, the memory was similar to that of the MOZAIC instrument. The explanation for this observation was the accumulation of HNO3 at the (cold) tip of the converter during the time spent in the stratosphere (see Pätz et al., Citation2006 for details). The conclusion was that the memory of the inlet line of the MOZAIC instrument, on average, does not bias the NOy data, whereas instrumental configurations with the converter mounted outside of the aircraft can indeed lead to a positive bias of the tropospheric data due to artificial transport of HNO3 from the stratosphere by the instrument itself.
CitationStratmann (2013) compare the NOy data collected in MOZAIC with those collected in the CARIBIC project. They find good agreement between the seasonal mixing ratios over Europe, both in terms of median and width of the distributions. The deviations between the medians of the two data sets are <10%, except for the fall season, where the MOZAIC data set exhibits 20% lower mixing ratios than the CARIBIC data set.
3. Results and discussion
3.1. Data availability
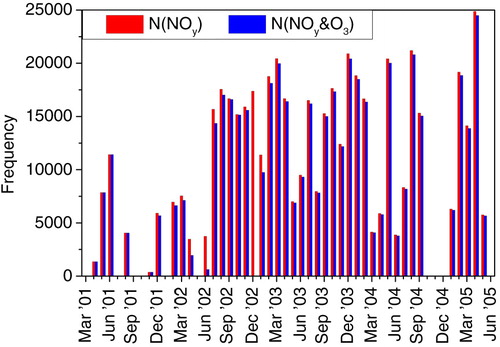
NOy data were recorded between April 2001 and May 2005 with longer gaps in 07/2001, 09–10/2001, 01/2002, 05/2002, and 10–12/2004, as is seen in , which shows the number of NOy data for each month. Reasons for data gaps were failures of the NOy instrument or inadequate performance due to contamination as described above, and sometimes missing information on aircraft position due to failure of the MOZAIC data acquisition system. After 2005, the instrument was operated for several periods without converter and was then used for testing of a new version with a photolytic converter in the European FP6 project IAGOS-DS (Integration of routine Aircraft measurements into a Global Observing System; Thomas and Volz-Thomas, Citation2010). The data from these periods are not subject of this publication.
Fig. 2 Time series of the number of NOy measurements (1 min averages) obtained per month (red bars) and the number of concurrent NOy and O3 measurements (blue bars).
The MOZAIC data have been included in the database of the new research infrastructure IAGOS (In-service Aircraft for a Global Observing System) and are accessible at www.iagos.fr. The database contains the data at two different time resolutions, (1) the 4 s data as provided by the principal investigators (see above) and (2) 1 min averages calculated from the 4 s data. In the following, we are using the 1 min averaged data. The 10 Hz data recorded by the NOy instrument are not available in the database.
The annual data availability is summarised in . In total, valid NOy data have been gathered during 1533 flights, comprising 8500 h of data. Coincidental measurements of NOy and O3 are available from 1433 flights. Coincidental data of NOy, O3 and CO data are available from 1125 flights between January 2002 and May 2005. NOy profiles are only available above 800 hPa (900 hPa after 04/2004) and only during descent, that is, one vertical profile for each flight. This restriction had been imposed by the need of keeping the NOy converter clean during unattended operation over several weeks (see Section 2).
Table 1. Flight statistics for the MOZAIC NOy instrument
3.2. Data quality
Each NOy value in the MOZAIC database has associated a 1 sigma uncertainty (in ppb), which has been calculated by error propagation of the individual contributions from the following:
Precision of the PMT signal calculated from the counting statistics of the difference between measure and zero mode (S_MM(t) – S_ZM(t)) of the CLD. This contribution is only significant for the raw data recorded at 10 Hz resolution. It is insignificant, however, for the data in the database, which are averaged over 4 s or 1 min.
Uncertainty due to the variance ΔBG of the artefact NOy signal over a flight.
Uncertainty ΔS of the sensitivity of the CLD over the deployment period (including the uncertainty of the secondary standard) and the uncertainty ΔE of the conversion efficiency of the gold converter.
shows the relevant contributions to the overall uncertainty of the NOy data in the form of frequency distributions calculated from all flights in the MOZAIC database. The upper panel shows the contribution arising from ΔBG, which is independent of the prevailing NOy mixing ratio. It ranges between 40 and 120 ppt, on average and represents the main contribution to overall uncertainty at low NOy concentrations.
Fig. 3 Frequency distributions of the relevant contributions to the overall uncertainty calculated from all flights with valid NOy data. Lower panel: uncertainties in calibration, i.e., sqrt((ΔS/S)2+(ΔE/E)2); upper panel: uncertainty of the artefact NOy signal, ΔBG.
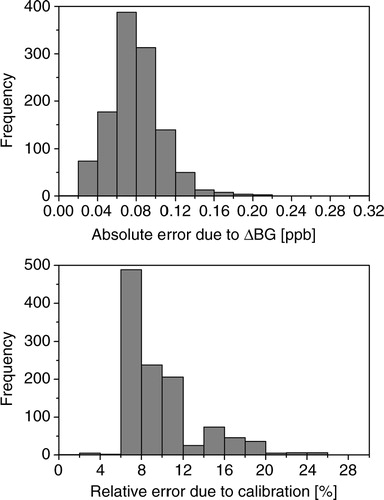
The lower panel displays the error due to calibration, that is, the combined contribution of ΔS and ΔE, which is proportional to the prevailing NOy mixing ratio and dominates the total uncertainty at high NOy mixing ratios. It ranges between 6 and 12% for most of the flights. The larger errors are due to decreasing sensitivity and/or conversion efficiency during deployment. The results of the calibrations for S and E performed before, after and during each deployment period of the MOZAIC NOy instruments are detailed in Supplementary Fig. A1.
As stated above, the interference by HCN, which is not part of the family of species summarised under the acronym NOy (i.e. NO and its atmospheric oxidation products), also adds to the overall uncertainty of the MOZAIC NOy data. Since the first measurements of HCN in the atmosphere by Coffey et al. (Citation1981), HCN measurements have been made at many different locations and from different platforms. Most data sets represent total columns measured by infrared spectroscopy. The in-situ measurements (Spreng and Arnold, Citation1994; Schneider et al., Citation1997; Singh et al., Citation2003; Hornbrook et al., Citation2011; Simpson et al., Citation2011; Le Breton et al., Citation2013) made in unpolluted air show, on average, HCN mixing ratios between 150 and 250 ppt without significant vertical gradient. The HCN column densities from spectroscopic measurements at, for example, Jungfraujoch, Switzerland (Rinsland et al., Citation2002), and Lauder, New Zealand (Zeng et al., Citation2012), give similar concentrations when a constant vertical profile is assumed, Slightly higher values are observed over Japan (Zhao et al., Citation2002). The seasonal variation has a maximum in late spring/early summer with corresponding mixing ratios up to 300–400 ppt and minimum values around 150–200 ppt during fall and winter.
The HCN data from Jungfraujoch are compared in Supplementary Fig. A2 to the average seasonal variation of NOy from MOZAIC data collected in the troposphere over Europe. In conclusion, a small but significant fraction of the NOy mixing ratios observed in the troposphere can in fact be due to HCN. The interference is larger in winter than in summer. In the lower stratosphere, the fraction of NOy potentially contributed by HCN is generally below 10% because of the higher concentrations of HNO3 and the slightly lower values of HCN.
Large HCN mixing ratios have been observed in the outflow of large agglomerations, for example, Mexico City (Crounse et al., Citation2009), and in biomass burning plumes (e.g. Hecobian et al., Citation2011; Tereszchuk et al., Citation2013). In these experiments, HCN was found to be correlated with other tracers of combustion, such as CO (e.g. Li et al., Citation2003; Paton-Walsh et al., Citation2010; Viatte et al., Citation2013), with slopes in the range of 2–5 ppt HCN/ppb CO. Therefore, the CO measurements made in MOZAIC could be used to identify and correct at first approximation for the HCN interference in the MOZAIC NOy data.
3.3. Geographical distribution of NOy data
The geographical coverage of the MOZAIC NOy data is shown in . Most of the data have been recorded during flights over the North Atlantic between Europe and North America (867 flights), followed by flights between Europe and Near East (337 flights) and Far East (113 flights). Only few data exist from flights into the Tropics and the Southern Hemisphere, except for 45 flights to Caracas, 33 flights to Northwest Africa and 20 flights to Mideast. The availability of NOy measurements is summarised in for the different regions.
Fig. 4 Upper panel: geographical distribution of flights with NOy measurements. Lower panel: airports with NOy profiles and definition of regions used in the analysis. The colour bar denotes the number of profiles collected over the different airports.
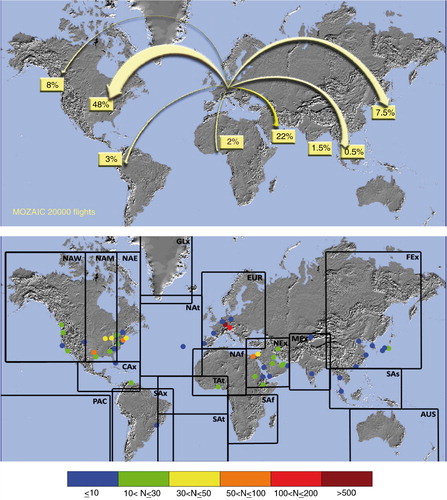
Table 2. Availability of MOZAIC NOy data and vertical profiles in the different geographical regions defined in
also shows the locations of airports, where vertical profiles of NOy have been collected (in total 1533 NOy profiles). As is shown in , most profiles have been collected over Europe (mainly Frankfurt and Munich), followed by North America (particularly New York), Middle East and Far East, and about 20 profiles over Central America and Southwest Africa. The number of profiles available for each airport is given in Supplementary Table A2.
3.4. Vertical distribution of the NOy data
3.4.1. Tropospheric profiles
The vertical distribution of NOy in the troposphere over Frankfurt, where the vast majority of the profiles have been collected, is shown in . Displayed are all data obtained during the last 25 min of descent and at altitudes below 8 km. The first condition is necessary in order to limit the horizontal extent of the profiles to 200 km in longitude and 100 km in latitude. Each profile is displayed as a vertical bar with the NOy concentration given by the colour coding. It is obvious that the cut-off altitude of 8 km is not reached in all flights, because the aircraft sometimes start the descent far away from the destination. The absence of profiles after 2004 is due to the fact that the aircraft was then operated out of Munich.
Fig. 5 Vertical profiles of NOy over Frankfurt. The lower boundary is determined by the pressure at which the instrument is switched into stand-by (initially at 800 hPa, changed to 900 hPa in April 2004). Colour bar: NOy mixing ratio in ppb.
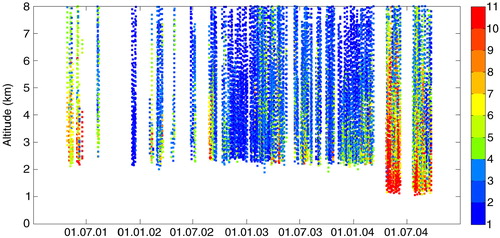
Concentrations in the free troposphere around Frankfurt are usually below 5 ppb, except for a few profiles which exhibit a concentration of up to 10 ppb. The profiles collected after April 2004, when the setting of the pressure level for entering stand-by had been changed, extend further into the lower troposphere. There, NOy concentrations are generally higher than in the free troposphere above, reflecting the influence of surface emissions from the Rhine-Main area and of aircraft emissions in the flight corridors around the heavily frequented airport, where aircraft are sometimes approaching within a few minutes after each other.
3.4.2. Upper troposphere and lower stratosphere
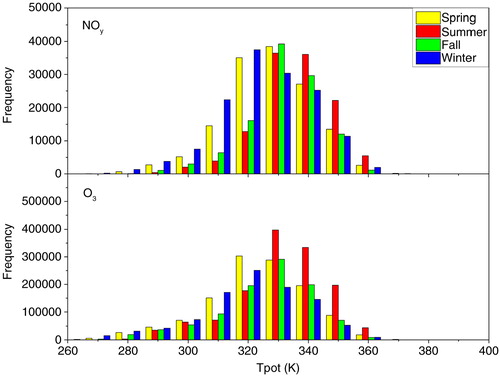
The vast majority of the MOZAIC data has been collected at cruise altitude, that is, at pressure levels between 200 and 260 hPa. shows the sampling frequency of the MOZAIC NOy data as a function of potential temperature (T pot) for the four seasons. The maximum frequency varies between 320 K in winter and 335 K in summer. The sampling frequency of O3 measurements (lower panel) has a similar distribution, indicating that the aircraft carrying the NOy instrument has a similar sampling bias with respect to T pot as the five other MOZAIC aircraft.
Fig. 6 Frequency distribution of NOy and O3 as a function of potential temperature (T pot) for each season (spring: MAM; summer: JJA; fall: SON; winter: DJF).
shows the NOy and O3 data as a function of the potential vorticity (PV), which has been calculated from meteorological fields for each MOZAIC measurement (cf. Thouret et al., Citation2006) and is available in the database.
Fig. 7 Frequency of measurements, mean mixing ratio and standard deviation of NOy (left) and O3 (right) as a function of potential vorticity (PV) for each season.
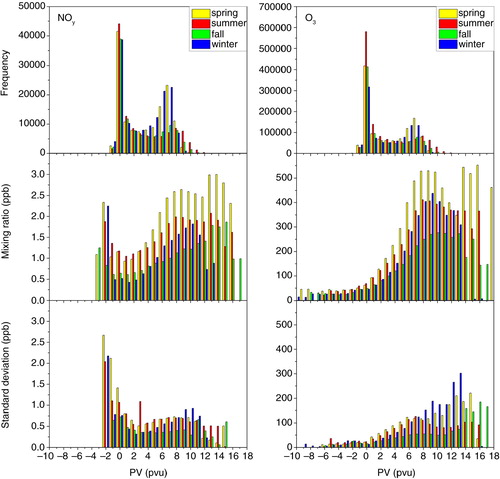
The upper panel of shows the sampling frequency. Both distributions exhibit two maxima, one around 0 PV units (pvu), sampled in the lower troposphere after take-off and before landing, and one between 5 and 8 pvu, sampled during cruise altitude. Individual data were collected at potential vorticities up to 15 pvu.
The middle panel shows the PV dependence of the mixing ratio of NOy and O3 in bins of 1 pvu for the four seasons. The NOy mixing ratios show, like O3, a gradual increase between 2 and 8 pvu in the lower stratosphere. The highest mixing ratios are observed in spring and summer. The data above 10 pvu are not representative because of the limited sampling statistics. In the troposphere (PV<2 pvu, see below), O3 mixing ratios tend to further decrease, whereas NOy mixing ratios show a distinct maximum in the troposphere around −2 pvu, which is indicative of NOy sources from surface emissions, in addition to lightning (cf. Gressent et al., Citation2014) and aircraft emissions. This is corroborated by the maximum in the standard deviation of the NOy data at −2 pvu. The O3 concentrations observed below −2 pvu are from very few individual measurements obtained during take-off and landing. They are not present in the NOy data set because the instrument is turned off at 800 (900) hPa, that is, above the altitude of most airports served by the MOZAIC aircraft. Exceptions are Sanaa and Addis Ababa, where 2 and 11 profiles are available, respectively.
Separation of the MOZAIC data into samples of primarily tropospheric or stratospheric origin has been made by several authors using different criteria. The simplest criterion used in the early days of MOZAIC was a threshold of approx. 100 ppb O3. Later, a dynamic threshold was used, based on PV, either by simply using a local threshold of 2 pvu for the separation, or by implementing more complex schemes, depending on how rigid a criterion was required for the question of interest. For example, Thouret et al. (Citation2006) defined the TP region as a 30 hPa thick layer around the local TP defined as the 2 pvu surface. Gressent et al. (2014) used a local criterion of PV<2 pvu for selecting tropospheric air masses and, in addition, discarded all data for which PV values of >2 pvu had been encountered by the sampled air masses during the previous 3 days, based on back-trajectories calculated with FLEXPART (Stohl et al., Citation2005). The additional criterion served to remove a small but significant fraction of data with potentially stratospheric signature.
For the following analysis, we adopted the scheme by Thouret et al. (Citation2006) by defining the TP region as a 30 hPa thick layer around the local TP defined as the 2 pvu surface at the time of measurement. In an analogue manner, UT and LS1 were defined as 30 hPa thick layers below and above the TP region, respectively (see definitions below). While discarding a large number of the available data, application of these criteria results in more homogeneous distributions in the selected compartments. When using the entire data set collected above the TP (defined below as LS), the strong vertical gradient of NOy (and O3) would significantly broaden the distribution, thereby limiting the quality of comparisons with numerical model calculations. The data set defined as LS is used, however, for analysis of the correlation between NOy and O3 ().
shows, for each season, maps of the geographical distribution of NOy in the lower stratosphere (LS1) and in the UT. Each symbol represents a 1° by 1° average of all data from the entire sampling period that fulfils the above defined criteria.
Fig. 8 Mean mixing ratios of NOy for the four seasons (MAM, JJA, SON, DJF) in the vertical layers LS1 (upper panel) and UT (lower panel). Each data point represents a 1°×1° average. The colour code denotes the NOy mixing ratio in ppb.
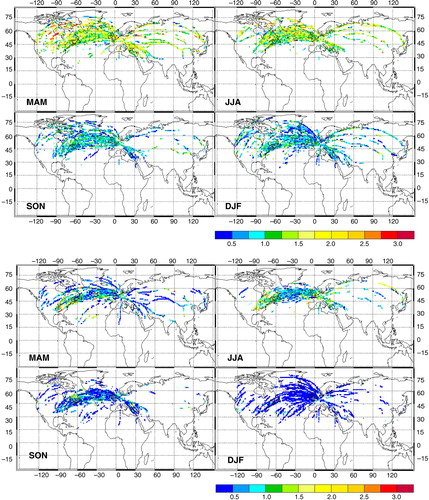
NOy concentrations in LS1 exhibit a maximum in spring (MAM) and summer (JJA) and a minimum during fall (SON) and winter (DJF). The highest concentrations observed in spring over Northern Canada are influenced by fire plumes in association with thermal convection (Cammas et al., Citation2009).
In the UT, the seasonal maximum is shifted towards early summer. Particularly, high mixing ratios are observed over the United States and off the US East coast. As discussed by CitationGressent et al. (2014), these plumes are mostly associated with NO production from lightning in combination with large-scale convective transport into the UT. High NOy concentrations are also observed in summer over Europe and over Siberia.
In winter, NOy concentrations are homogeneously distributed with concentrations below 0.5 ppb. The absence of higher concentrations over the North Atlantic in winter is indicative of the absence of a strong influence from direct aircraft emissions to the NOy concentrations in the flight corridor and clearly confirms the influence of surface emissions and lightning on the high concentrations observed in spring and summer. This is further highlighted in , which shows the frequency distributions of NOy for each season in the three vertical layers UT, TP and LS1. The distribution in the UT in winter has a median value of approx. 0.3 ppb and is much narrower than the distributions in the other seasons. In summer, the median of the distribution is more than a factor of two higher than in winter. In the layer LS1, concentrations are higher and distributions are broader due to the increase of NOy mixing ratios with altitude in the lower stratosphere.
Fig. 9 Frequency distribution of the mean mixing ratio of NOy for the layers UT, TP, and LS1 and for each season (all data without geographical selection). The parameters of the distributions are listed in Supplementary Table A3.
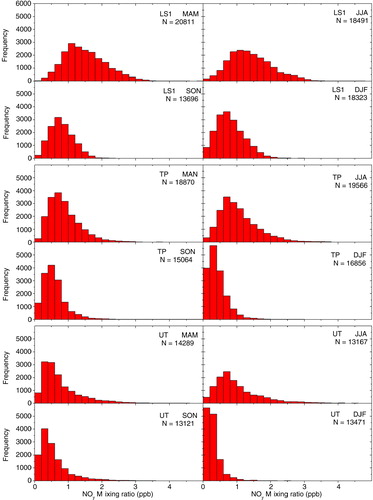
Details of the distributions shown in are listed in Supplementary Table A3. While in the UT and TP, median, P25 and P75 exhibit maxima in summer, the maxima are shifted towards spring in the lower stratosphere (LS1), similar to the distribution of O3. Supplementary Fig. A3 shows the monthly mean NOy concentrations for UT, TP and all 30 hPa altitude bins (LS1–LS5) above the dynamical TP over selected geographical areas in comparison to O3.
shows the correlation between NOy and O3 mixing ratios in the form of scatter plots. The data points are coloured by potential temperature. There are two distinct branches, (1) a tropospheric branch with variable NOy at O3 mixing ratios<100 ppb and T pot<320 K and (2) a stratospheric branch showing the well-known correlation between NOy and O3, as first discussed by Murphy et al. (Citation1993). In the MOZAIC data, the largest dynamic range is observed in winter and spring, when the aircraft fly higher into the stratosphere because of the lower TP. The smallest dynamic range is observed in fall.
Fig. 10 Scatter plots of the NOy mixing ratios against O3 for the four seasons. The colour of the data points gives the concurrent potential temperature in K. The solid lines are linear fits to all data collected in the lower stratosphere (LS see definition above). The ellipses indicate individual data points with enhanced NOy concentrations in the LS.
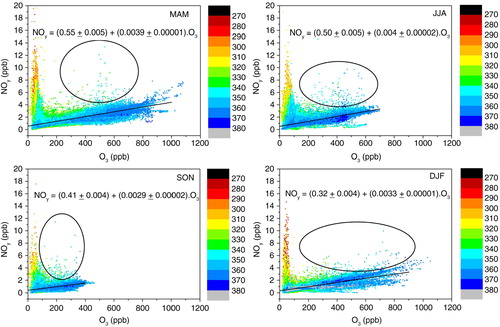
In winter, separation between the two branches is most distinct, indicating little exchange between LS and TP, whereas significant mixing is observed in the other seasons, particularly in summer and fall. There are a few very high NOy mixing ratios observed in the lower stratosphere (indicated by ellipses) which are indicative of pyro-convective plumes influencing the lower stratosphere as discussed by, e.g. Fromm et al. (Citation2000); Fromm and Servranckx (Citation2003).
When confining the MOZAIC data to the lower stratosphere (LS see above), the tropospheric branch disappears and the slope of the NOy-O3 correlation ranges between 2.9±0.02 (ppt NOy/ppb O3) in fall and 4.0±0.02 in summer (3.3±0.01 in winter and 3.9±0.01 in spring). These ratios are similar to those observed by Murphy et al. (Citation1993) from flights with the ER-2 in the extra-tropics (2.5–4 ppt/ppb).
4. Conclusions and outlook
The MOZAIC NOy instrument, flown between 2001 and 2005 on board of an Airbus A340 operated by Lufthansa, provided data of known quality from more than 1500 long distance flights, comprising 8500 h of NOy measurements in the troposphere and lower stratosphere.
We have summarised the quality and shortcomings in the NOy data set and gave examples of the distribution of NOy in order to demonstrate the potential of the data for future scientific applications.
In the lower stratosphere, NOy shows a strong increase with altitude and is highly correlated with O3, whereas NOy mixing ratios in the UT are highly variable, particularly in spring and summer, where very large NOy mixing ratios are frequently observed over Northern Canada, Siberia, Europe and the North American East Coast. In winter, NOy mixing ratios in the UT are lower and relatively uniformly distributed, without significant enhancements over the North Atlantic flight corridor.
The NOy data complement the MOZAIC data set on ozone, water vapour and carbon monoxide and have already been used in other publications for, for example, assessing the impact of fire emissions (Cammas et al., Citation2009) and for investigating the influence of lightning on the persistence of large-scale plumes of NOy in the free troposphere (Gressent et al., Citation2014).
The work performed in MOZAIC has demonstrated the feasibility to operate complex instruments aboard commercial aircraft in unattended mode over periods of several weeks and has served as precursor for new instruments developed for wider deployment aboard commercial aircraft in the European Research Infrastructure IAGOS (In-service Aircraft for a Global Observing System) which has been developed from MOZAIC and CARIBIC (cf. Nédélec et al., Citation2015; Petzold et al., Citation2015).
Supplementary Tables and figures
Download PDF (567.2 KB)5. Acknowledgements
MOZAIC was co-funded by the European Commission between 1993 and 2003. The authors gratefully acknowledge the strong support by Deutsche Lufthansa AG for free transportation of the instruments and the technical support by Lufthansa Technik AG and enviscope GmbH during installation and operation. The authors also thank Fernand Karcher and his colleagues of Météo France, Toulouse, for hosting the MOZAIC database and for providing information on potential vorticity.
Notes
This paper is part of a Special Issue on MOZAIC/IAGOS in Tellus B celebrating 20 years of an ongoing air chemistry-climate research measurement from airbus commercial aircraft operated by an international consortium of countries. More papers from this issue can be found at http://www.tellusb.net
To access the supplementary material to this article, please see Supplementary files under ‘Article Tools’.
References
- Bertram T. H. , Perring A. E. , Wooldridge P. J. , Crounse J. D. , Kwan A. J. , co-authors . Direct measurements of the convective recycling of the upper troposphere. Science. 2007; 315: 816–820. DOI: http://dx.doi.org/10.1126/science.1134548 [PubMed Abstract].
- Bradshaw J. , Sandholm S. , Talbot R . An update on reactive odd-nitrogen measurements made during recent NASA Global Tropospheric Experiment programs. J. Geophys. Res. 1998; 103: 19129–19148. DOI: http://dx.doi.org/10.1029/98JD00621 .
- Brenninkmeijer C. A. M. , Crutzen P. , Boumard F. , Dauer T. , Dix B. , co-authors . Civil aircraft for the regular investigation of the atmosphere based on an instrumented container: the new CARIBIC system. Atmos. Chem. Phys. 2007; 7: 4953–4976. DOI: http://dx.doi.org/10.5194/acp-7-4953-2007 .
- Brunner D. , Staehelin J. , Jeker D . Large-scale nitrogen oxide plumes in the tropopause region and implications for ozone. Science. 1998; 282: 1305–1309. DOI: http://dx.doi.org/10.1126/science.282.5392.1305 [PubMed Abstract].
- Cammas J.-P. , Brioude J. , Chaboureau J.-P. , Duron J. , Mari C. , co-authors . Injection in the lower stratosphere of biomass fire emissions followed by long-range transport: a MOZAIC case study. Atmos. Chem. Phys. 2009; 9: 5829–5846. DOI: http://dx.doi.org/10.5194/acp-9-5829-2009 .
- Coffey M. T. , Mankin W. G. , Cicerone R. J . Spectroscopic detection of stratospheric hydrogen cyanide. Science. 1981; 214: 333–335. DOI: http://dx.doi.org/10.1126/science.214.4518.333 [PubMed Abstract].
- Crounse J. D. , DeCarlo P. F. , Blake D. R. , Emmons L. K. , Campos T. L. , co-authors . Biomass burning and urban air pollution over the Central Mexican Plateau. Atmos. Chem. Phys. 2009; 9: 4929–4944. DOI: http://dx.doi.org/10.5194/acp-9-4929-2009 .
- Crutzen P . A discussion of the chemistry of some minor constituents in the stratosphere and troposphere. Pure Appl. Geophys. 1973; 106: 1385–1399. DOI: http://dx.doi.org/10.1007/BF00881092 .
- Drummond J. W. , Volz A. , Ehhalt D. H . An optimized chemiluminescence detector for tropospheric NO measurements. J. Atmos. Chem. 1985; 2: 287–306. DOI: http://dx.doi.org/10.1007/BF00051078 .
- Engel A. , Bönisch H. , Brunner D. , Fischer H. , Franke H. , co-authors . Highly resolved observations of trace gases in the lowermost stratosphere and upper troposphere from the Spurt project: an overview. Atmos. Chem. Phys. 2006; 6: 283–301. DOI: http://dx.doi.org/1680-7324/acp/2006-6-283 .
- Fahey D. W. , Eubank C. S. , Hübler G. , Fehsenfeld F. C . Evaluation of a catalytic reduction technique for the measurement of total reactive odd-nitrogen NOy in the atmosphere. J. Atmos. Chem. 1985; 3: 435–468. DOI: http://dx.doi.org/10.1007/BF00053871 .
- Fromm M. D. , Servranckx R . Transport of forest fire smoke above the tropopause by supercell convection. Geophys. Res. Lett. 2003; 30: 1542. DOI: http://dx.doi.org/10.1029/2002GL016820 .
- Fromm M. D. , Alfred J. , Hoppel K. , Hornstein J. , Bevilacqua R. , co-authors . Observations of boreal forest fire smoke in the stratosphere by POAM III, SAGE II, and lidar in 1998. Geophys. Res. Lett. 2000; 27: 1407–1410. DOI: http://dx.doi.org/10.1029/1999GL011200 .
- Gressent A. , Sauvage B. , Defer E. , Pätz H. W. , Thomas K. , co-authors . Lightning NOx influence on large-scale NOy and O3 plumes observed over the northern mid-latitudes. Tellus B. 2014; 66 25544. DOI: http://dx.doi.org/10.3402/tellusb.v66.25544 .
- Hecobian A. , Liu Z. , Hennigan C. J. , Huey L. G. , Jimenez J. L. , co-authors . Comparison of chemical characteristics of 495 biomass burning plumes intercepted by the NASA DC-8 aircraft during the ARCTAS/CARB-2008 field campaign. Atmos. Chem. Phys. 2011; 11: 13325–13337. DOI: http://dx.doi.org/10.5194/acp-11-13325-2011 .
- Hegglin M. I. , Brunner D. , Peter T. , Hoor P. , Fischer H. , co-authors . Measurements of NO, NOy, N2O, and O3 during SPURT: implications for transport and chemistry in the lowermost stratosphere. Atmos. Chem. Phys. 2006; 6: 1331–1350. DOI: http://dx.doi.org/10.5194/acp-6-1331-2006 .
- Helten M. , Smit H. , Sträter W. , Kley D. , Nédélec P. , co-authors . Calibration and performance of automatic compact instrumentation for the measurement of relative humidity from passenger aircraft. J. Geophys. Res. 1998; 103: 25643–25652. DOI: http://dx.doi.org/10.1029/98JD00536 .
- Hornbrook R. S. , Blake D. R. , Diskin G. S. , Fried A. , Fuelberg H. E. , co-authors . Observations of nonmethane organic compounds during ARCTAS – part 1: biomass burning emissions and plume enhancements. Atmos. Chem. Phys. 2011; 11: 11103–11130. DOI: http://dx.doi.org/10.5194/acp-11-11103-2011 .
- Hudman R. C. , Jacob D. J. , Turquety S. , Leibensperger E. M. , Murray L. T. , co-authors . Surface and lightning sources of nitrogen oxides over the United States: magnitudes, chemical evolution, and outflow. J. Geophys. Res. 2007; 112 D12S05. DOI: http://dx.doi.org/10.1029/2006JD007912 .
- Kliner D. A. V. , Daube B. C. , Burley J. D. , Wofsy S. C . Laboratory investigation of the catalytic reduction technique for measurement of atmospheric NOy . J. Geophys. Res. 1997; 102: 10759–10776. DOI: http://dx.doi.org/10.1029/96JD03816 .
- Kondo Y. , Kawakami S. , Koike M. , Fahey D. W. , Nakajima H. , co-authors . Performance of an aircraft instrument for the measurement of NOy . J. Geophys. Res. 1997; 102: 28663–28671. DOI: http://dx.doi.org/10.1029/96JD03819 .
- Le Breton M. , Bacak A. , Muller J. B. A. , O'Shea S. J. , Xiao P. , co-authors . Airborne hydrogen cyanide measurements using a chemical ionisation mass spectrometer for the plume identification of biomass burning forest fires. Atmos. Chem. Phys. 2013; 13: 9217–9232. DOI: http://dx.doi.org/10.5194/acp-13-9217-2013 .
- Li Q. , Jacob D. J. , Yantosca R. , Heald C. , Singh H. , co-authors . A global three-dimensional model analysis of the atmospheric budgets of HCN and CH3CN: constraints from aircraft and ground measurements. J. Geophys. Res. 2003; 108: 8827. DOI: http://dx.doi.org/10.1029/2002JD003075 .
- Marenco A. , Thouret V. , Nédélec P. , Smit H. , Helten M. , co-authors . Measurement of ozone and water vapor by Airbus in-service aircraft: the MOZAIC airborne program, an overview. J. Geophys. Res. 1998; 103: 25631–25642. DOI: http://dx.doi.org/10.1029/98JD00977 .
- Murphy D. M. , Fahey D. W . An estimate of the flux of stratospheric reactive nitrogen and ozone into the troposphere. J. Geophys. Res. 1994; 99: 5325–5332. DOI: http://dx.doi.org/10.1029/93JD03558 .
- Murphy D. M. , Fahey D. W. , Proffitt M. H. , Liu S. C. , Chan K. R. , co-authors . Reactive nitrogen and its correlation with ozone in the lower stratosphere and upper troposphere. J. Geophys. Res. 1993; 98: 8751–8773. DOI: http://dx.doi.org/10.1029/92JD00681 .
- Nédélec P. , Cammas J. P. , Thouret V. , Athier G. , Cousin J. M. , co-authors . An improved infrared carbon monoxide analyser for routine measurements aboard commercial Airbus aircraft: technical validation and first scientific results of the MOZAIC III programme. Atmos. Chem. Phys. 2003; 3: 1551–1564. DOI: http://dx.doi.org/10.5194/acp-3-1551-2003 .
- Nédélec P. , Blot D. , Boulanger D. , Athier G. , Cousin J.-M. , co-authors . Instrumentation on commercial aircraft for monitoring the atmospheric composition on a global scale: the IAGOS system, technical overview of ozone and carbon monoxide measurements. Tellus B. 2015; 67 27791. DOI: http://dx.doi.org/10.3402/tellusb.v67.27791 .
- Neuman J. A. , Huey L. G. , Ryerson T. B. , Fahey D. W . Study of inlet materials for sampling atmospheric nitric acid. Environ. Sci. Technol. 1999; 33: 1133–1136. DOI: http://dx.doi.org/10.1021/es980767f .
- Neuman J. A. , Gao R. S. , Fahey D. W. , Holecek J. C. , Ridley B. A. , co-authors . In situ measurements of HNO3, NOy, NO, and O3 in the lower stratosphere and upper troposphere. Atmos. Environ. 2001; 35: 5789–5797. DOI: http://dx.doi.org/10.1016/S1352-2310(01)00354-5 .
- Paton-Walsh C. , Deutscher N. M. , Griffith D. W. , Forgan B. W. , co-authors . Trace gas emissions from savanna fires in northern Australia. J. Geophys. Res. 2010; 115 D16314. DOI: http://dx.doi.org/10.1029/2009JD013309 .
- Pätz H.-W. , Volz-Thomas A. , Hegglin M. I. , Brunner D. , Fischer H. , co-authors . In-situ comparison of the NOy instruments flown in MOZAIC and SPURT. Atmos. Chem. Phys. 2006; 6: 2401–2410. DOI: http://dx.doi.org/10.5194/acp-6-2401-2006 .
- Petzold A. , Thouret V. , Gerbig C. , Zahn A. , Brenninkmeijer C. A. M. , co-authors . Global-scale atmosphere monitoring by in-service aircraft – current achievements and future prospects of the European research infrastructure. Tellus B. 2015; 67 28452. DOI: http://dx.doi.org/10.3402/tellusb.v67.28452 .
- Ridley B. A. , Walega J. G. , Dye J. E. , Grahek F. E . Distributions of NO, NOx, NOy, and O3 to 12 km altitude during the summer monsoon season over New Mexico. J. Geophys. Res. 1994; 99: 25519–25534. DOI: http://dx.doi.org/10.1029/94JD02210 .
- Rinsland C. P. , Jones N. B. , Connor B. J. , Wood S. W. , Goldman A. , co-authors . Multiyear infrared solar spectroscopic measurements of HCN, CO, C2H6, and C2H2 tropospheric columns above Lauder, New Zealand (45°S latitude). J. Geophys. Res. 2002; 107 4185. DOI: http://dx.doi.org/10.1029/2001JD001150 .
- Schneider J. , Bürger V. , Arnold F . Methyl cyanide and hydrogen cyanide measurements in the lower stratosphere: implications for methyl cyanide sources and sinks. J. Geophys. Res. 1997; 102: 25501–25506. DOI: http://dx.doi.org/10.1029/97JD02364 .
- Schumann U. , Huntrieser H . The global lightning-induced nitrogen oxides source. Atmos. Chem. Phys. 2007; 7: 3823–3907. DOI: http://dx.doi.org/10.5194/acp-7-3823-2007 .
- Schumann U. , Schlager H. , Arnold F. , Ovarlez J. , Kelder H. , co-authors . Pollution from aircraft emissions in the North Atlantic flight corridor: overview on the POLINAT projects. J. Geophys. Res. 2000; 105: 3605–3631. DOI: http://dx.doi.org/10.1029/1999JD900941 .
- Simpson I. J. , Akagi S. K. , Barletta B. , Blake N. J. , Choi Y. , co-authors . Boreal forest fire emissions in fresh Canadian smoke plumes: C1–C10 volatile organic compounds (VOCs), CO2, CO, NO2, NO, HCN and CH3CN. Atmos. Chem. Phys. 2011; 11: 6445–6463. DOI: http://dx.doi.org/10.5194/acp-11-6445-2011 .
- Singh H. B. , Salas L. , Herlth D. , Kolyer R. , Czech E. , co-authors . In situ measurements of HCN and CH3CN over the Pacific Ocean: sources, sinks, and budgets. J. Geophys. Res. 2003; 108 8795. DOI: http://dx.doi.org/10.1029/2002JD003006 .
- Spreng S. , Arnold F . Balloon-borne mass spectrometer measurements of HNO3 and HCN in the winter Arctic stratosphere – evidence for HNO3 processing by aerosols. Geophys. Res. Lett. 1994; 21: 1251–1254. DOI: http://dx.doi.org/10.1029/93GL03229 .
- Stohl A. , Forster C. , Frank A. , Seibert P. , Wotawa G . Technical note: the Lagrangian particle dispersion model, FLEXPART version 6.2. Atmos. Chem. Phys. 2005; 5: 2461–2474. DOI: http://dx.doi.org/10.5194/acp-5-2461-2005 .
- Stratmann G . Stickoxidmessungen in der Tropopausenregion an Bord eines Linienflugzeugs: Großräumige Verteilung und Einfluss des Luftverkehrs. 2013. PhD Thesis. Technische Universität München, Lehrstuhl Atmosphärische Umweltforschung. Online at: http://nbn-resolving.de/urn/resolver.pl?urn:nbn:de:bvb:91-diss-20131118-1144600-0-5 .
- Talbot R. W. , Dibb J. E. , Scheuer E. M. , Kondo Y. , Koike M. , co-authors . Reactive nitrogen budget during the NASA SONEX mission. Geophys. Res. Lett. 1999; 26: 3057–3060. DOI: http://dx.doi.org/10.1029/1999GL900589 .
- Tereszchuk K. A. , González Abad G. , Clerbaux C. , Hadji-Lazaro J. , Hurtmans D. , co-authors . ACE-FTS observations of pyrogenic trace species in boreal biomass burning plumes during BORTAS. Atmos. Chem. Phys. 2013; 13: 4529–4541. DOI: http://dx.doi.org/10.5194/acp-13-4529-2013 .
- Thomas K. , Volz-Thomas A. (eds . Integration of Routine Aircraft Measurements into a Global Observing System, Design Study for Research Infrastructures Implemented as Specific Support Action. 2010. Contract No.: 011902-DS, Final Report. Online at: http://www.iagos.org/lw_resource/datapool/_items/item_517/iagos-ds_final-report_v6.pdf .
- Thouret V. , Marenco A. , Nédélec P. , Grouhel C . Ozone climatologies at 9–12 km altitude as seen by the MOZAIC airborne program between September 1994 and August 1996. J. Geophys. Res. 1998; 103: 25653–25679. DOI: http://dx.doi.org/10.1029/98JD01807 .
- Thouret V. , Cammas J.-P. , Sauvage B. , Athier G. , Zbinden R. , co-authors . Tropopause referenced ozone climatology and inter-annual variability (1994–2003) from the MOZAIC programme. Atmos. Chem. Phys. 2006; 6: 1033–1051. DOI: http://dx.doi.org/10.5194/acp-6-1033-2006 .
- Viatte C. , Strong K. , Paton-Walsh C. , Mendonca J. , O'Neill N. T. , co-authors . 2013 Measurements of CO, HCN, and C2H6 total columns in smoke plumes transported from the 2010 Russian boreal forest fires to the Canadian high Arctic. Atmos. Ocean. 51: 522–531. DOI: http://dx.doi.org/10.1080/07055900.2013.823373 .
- Volz-Thomas A. , Berg M. , Heil T. , Houben N. , Lerner A. , co-authors . Measurements of total odd nitrogen (NOy) aboard MOZAIC in-service aircraft: instrument design, operation and performance. Atmos. Chem. Phys. 2005; 5: 583–595. DOI: http://dx.doi.org/10.5194/acp-5-583-2005 .
- Weinheimer A. J. , Campos T. L. , Ridley B. A . The in-flight sensitivity of gold-tube NOy converters to HCN. Geophys. Res. Lett. 1998; 25: 3943–3946. DOI: http://dx.doi.org/10.1029/1998GL900066 .
- Zeng G. , Wood S. W. , Morgenstern O. , Jones N. B. , Robinson J. , co-authors . Trends and variations in CO, C2H6, and HCN in the Southern Hemisphere point to the declining anthropogenic emissions of CO and C2H6 . Atmos. Chem. Phys. 2012; 12: 7543–7555. DOI: http://dx.doi.org/10.5194/acp-12-7543-2012 .
- Zhao Y. , Strong K. , Kondo Y. , Koike M. , Matsumi Y. , co-authors . Spectroscopic measurements of tropospheric CO, C2H6, C2H2, and HCN in northern Japan. J. Geophys. Res. 2002; 107 4343. DOI: http://dx.doi.org/10.1029/2001JD000748 .
- Ziereis H. , Schlager H. , Schulte P. , van Velthoven P. F. J. , Slemr F . Distributions of NO, NOx, and NOy in the upper troposphere and lower stratosphere between 28° and 61°N during POLINAT 2. J. Geophys. Res. 2000; 105: 3653–3664. DOI: http://dx.doi.org/10.1029/1999JD900870 .