
Abstract
Approximately one-third of the Earth's arid areas are distributed across central Asia. The stable isotope composition of precipitation in this region is affected by its aridity, therefore subject to high evaporation and low precipitation amount. To investigate the factors controlling stable water isotopes in precipitation in arid central Asia, an observation network was established around the Tianshan Mountains in 2012. Based on the 1052 event-based precipitation samples collected at 23 stations during 2012–2013, the spatial distribution and seasonal variation of δD and δ18O in precipitation were investigated. The values of δD and δ18O are relatively more enriched in the rainfall dominant summer months (from April to October) and depleted in the drier winter months (from November to March) with low D-excess due to subcloud evaporation observed at many of the driest low elevation stations. The local meteoric water line (LMWL) was calculated to be δD=7.36δ18O – 0.50 (r2=0.97, p<0.01) based on the event-based samples, and δD=7.60δ18O+2.66 (r2=0.98, p<0.01) based on the monthly precipitation-weighted values. In winter, the data indicate an isotopic rain shadow effect whereby rainout leads to depletion of precipitation in the most arid region to the south of the Tianshan Mountains. The values of δ18O significantly correlate with air temperature for each station, and the best-fit equation is established as δ18O=0.78T – 16.01 (r2=0.73, p<0.01). Using daily air temperature and precipitation derived from a 0.5° (latitude)×0.5° (longitude) gridded data set, an isoscape of δ18O in precipitation was produced based on this observed temperature effect.
1. Introduction
The stable hydrogen and oxygen isotopes in precipitation (δD and δ 18O) have been widely applied in studies of the hydrological cycle (Araguás-Araguás et al., Citation2000), for example, tracing moisture sources (e.g. Sodemann et al., Citation2008; Crawford et al., Citation2013; Jouzel et al., Citation2013), estimating evaporation (e.g. Jasechko et al., Citation2013, Citation2014) and reconstructing paleoclimate (e.g. Uemura et al., Citation2012; Thompson et al., Citation2013; Mariani et al., Citation2014). To investigate the basic spatio-temporal patterns of water isotopes, an in-situ observation network is a valuable resource. The Global Network of Isotopes in Precipitation (GNIP) has been operated by the International Atomic Energy Agency (IAEA) and the World Meteorological Organization (WMO) since 1961 (IAEA/WMO, Citation2014); as of 2014, more than 1300 observation stations around the globe have contributed to the GNIP database. The isotopic data in the GNIP database, especially in the stations operated for several years, serve as an indispensable resource in many scientific disciplines on global and regional scales (e.g. Divine et al., Citation2011; Hughes and Crawford, Citation2012; Pfahl and Sodemann, Citation2014).
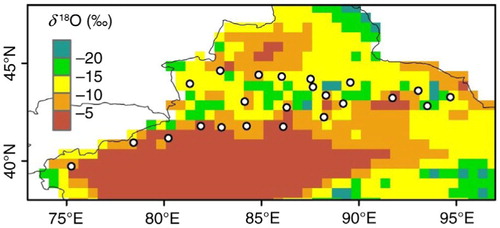
Approximately one-third of the arid area of the world is located in central Asia (), and the annual mean precipitation of this region is <150 mm (Chen, Citation2012). The Tianshan Mountains, also known as the Tien Shan, span from Uzbekistan to northwest China, and are considered a ‘wet island’ in arid central Asia. During the past decades, the Tianshan Mountains and surrounding oases have been a hot spot for environmental isotope studies in arid central Asia (e.g. Hou et al., Citation1999; Yao et al., Citation1999; Zhang et al., Citation2003; Pang et al., Citation2011; Feng et al., Citation2013; Kong et al., Citation2013). This region provides an important platform to investigate hydrological processes occurring in an endorheic drainage basin in an arid climate; a good understanding of the isotopes in rainfall of the region is helpful for paleoclimate reconstruction using ice cores and speleothems as well as local water resource management during water shortages.
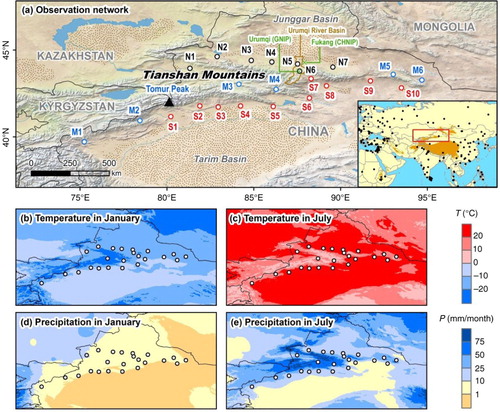
Fig. 1 (a) Map showing the locations of sampling stations (empty circles) around the Tianshan Mountains, arid central Asia. The sampling stations are labelled as follows: Northern slope: Yining (N1), Jinghe (N2), Kuytun (N3), Shihezi (N4), Caijiahu (N5), Urumqi (N6) and Qitai (N7); Mountains: Wuqia (M1), Akqi (M2), Bayanbulak (M3), Balguntay (M4), Barkol (M5) and Yiwu (M6); and Southern slope: Aksu (S1), Baicheng (S2), Kuqa (S3), Luntai (S4), Korla (S5), Kumux (S6), Dabancheng (S7), Turpan (S8), Shisanjianfang (S9) and Hami (S10). The satellite-derived land cover is acquired from Natural Earth (www.naturalearthdata.com), and the distribution of deserts (scattered area) is modified from Wang et al. (Citation2005). The small map shows the spatial distribution of existing isotope stations in the GNIP database (observation period no less than 12 months for δ 18O value; IAEA/WMO, Citation2014), and the areas higher than 2000 m a.s.l. are coloured in brown. (b–e) Spatial distributions of monthly air temperature and precipitation in January (left column) and July (right column) during 1950–2000. The long-term climatology is based on the WorldClim-Global Climate Data Version 1.4 (Hijmans et al., Citation2005; www.worldclim.org).
The GNIP station Urumqi (87°37′E, 43°47′N, 918 m a.s.l., station code 5182801), located on the northern slope of the Tianshan Mountains, has monthly precipitation isotope data for the years 1986–1992, 1995–1998 and 2001–2003 (IAEA/WMO, Citation2014; Wang et al., Citation2015). In 2004, a nationwide network named CHNIP (China Network of Isotopes in Precipitation) was established, and the Fukang station (87°56′E, 44°17′N, 460 m a.s.l.) was selected on the northern slope (Liu et al., Citation2009, Citation2014). In addition, precipitation at stations located in the upper and middle reaches of the Urumqi River basin was also discontinuously sampled since the mid-1990s (Yao et al., Citation1999; Pang et al., Citation2011; Feng et al., Citation2013).
However, previous observations outlined above are mainly distributed at a small spatial scale (usually one or two sampling sites), insufficient to map isotope variability at a larger scale affected by complex topography. The limited availability of in-situ measurements significantly hinders the understanding of isotopic fractionation processes in this arid region. To investigate hydrological processes in an arid climate as well as the climatological significance of stable isotopes, an intensive and integrated observation network around the Tianshan Mountains in arid central Asia is indispensable. In 2012, an observation network of isotopes in precipitation was established, and a total of 23 stations were selected in this region, covering typical landscapes and climate zones including deserts, oases and mountains in arid central Asia. The aims of this paper are to investigate the meteorological and geographical controls on the isotopic composition of precipitation in the Tianshan Mountains region and provide a platform to further assess the effect of changes in present and past hydrological processes.
2. Study area
The Tianshan Mountains is the main mountain range in central Asia and spans multiple countries including China, Kyrgyzstan, Uzbekistan and Kazakhstan (). The mountains consist of a series of east–west ranges and intermontane basins with a total length of approximately 2500 km; the eastern section (about 1700 km in length) is located in northwest China. The average altitude of the mountain chain is approximately 4000 m a.s.l., and the highest elevation is 7443 m a.s.l. (Tomur Peak). Vast desert basins lie to the north and south of the mountains, including the Junggar Basin (Gurbantunggut Desert) and the Tarim Basin (Takimakan Desert), which has a minimum elevation of −154 m a.s.l.
The spatial distribution of air temperature is generally controlled by aspect, elevation and latitude, and air temperature on the southern basin of the Tianshan Mountains is usually higher than that on the northern basin (b and c). Advected westerly vapour is the dominant moisture source for the Tianshan Mountains, whereas polar moisture from the Arctic is a much less significant source (Araguás-Araguás et al., Citation1998; Tian et al., Citation2007; Yao et al., Citation2013; Liu et al., Citation2015). The precipitation amount over the western section is greater than that on the eastern section, and the southern slope usually has less precipitation than the northern slope (d and e). On the northern slope of the Chinese Tianshan Mountains, annual precipitation decreases from approximately 250–350 mm in the western portion to 150–200 mm in the central portion and 10–30 mm in the eastern portion. On the southern slope, annual precipitation is approximately 50–100 mm in the western and middle portions and <50 mm in the eastern portion (Zhang and Zhang, Citation2006). For most stations in the study region, precipitation is concentrated over the summer months from April to October (Wang et al., Citation2013; Zhu et al., Citation2015), and during the drier winter months from November to March commonly falls as snow (b and 2).
3. Data and methods
The precipitation samples were collected at 23 stations around the Tianshan Mountains from August 2012 to September 2013 ( and ). The environment at which the stations are located can be classified into three landform groups: the northern slope, the mountains and the southern slope. The monthly air temperature and precipitation amount during the sampling period are also shown in . Most precipitation occurs in summer months, and precipitation in winter months is very limited. For most stations, air temperature and precipitation during the sampling period was similar to the mean monthly values during the period 1981–2010 (). However, significantly higher precipitation amounts compared with the long-term average are seen at some stations (e.g. in June 2013 at southern sites Aksu and Luntai), resulting from low-frequency precipitation extremes, which may only occur every few years.
Fig. 2 Monthly variation of air temperature and precipitation for each sampling station around the Tianshan Mountains from August 2012 to September 2013 (blue) and from 1981 to 2010 (red).
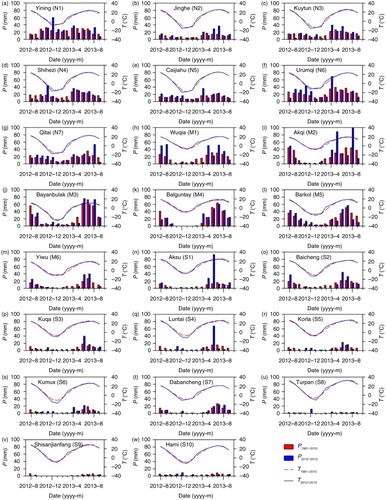
Table 1. Latitude, longitude, altitude, long-term climatology (T – air temperature, P – precipitation amount, E – pan evaporation and RH – relative humidity) from 1981 to 2010 and sample number (n) for each sampling station in this study
A total of 1052 precipitation samples were collected as individual events by the full-time meteorological observers. Standard Chinese precipitation gauges with funnel diameter of 20 cm were used as samplers. To prevent the evaporation of precipitation, liquid samples were collected immediately after the ceasing of precipitation, and then stored in 60 mL HDPE bottles with waterproof seals. Solid samples (snow or hail) were melted at room temperature in zip-lock LDPE bags before being sealed in bottles. Precipitation amount was measured manually, and air temperature, relative humidity and vapour pressure during precipitation events were observed hourly using automatic weather stations. The hourly meteorological records were averaged for each precipitation event.
All the samples were stored frozen prior to isotope ratio analysis using a liquid water isotope analyser DLT-100 (Los Gatos Research, Inc.) at the Stable Isotope Laboratory, College of Geography and Environmental Science, Northwest Normal University. Before analysis, the frozen precipitation samples in HDPE bottles were melted at room temperature. The measurement method was also detailed by Lis et al. (Citation2008), consisting of injecting every sample and isotopic standard sequentially six times. The results are expressed as δ-values relative to V-SMOW (Vienna Standard Mean Ocean Water), and the measurement precision is ±0.6 ‰ for δD and ±0.2 ‰ for δ 18O.
4. Results and discussion
4.1. Spatial distribution and seasonal variation
shows the weighted values of stable isotopes in precipitation for each station around the Tianshan Mountains during the sampling period. The spatial distribution of δ 18O on an annual and seasonal basis for each station is also presented in . For the annual mean δ 18O, the maximum (−3.6 ‰) was measured on samples collected from Shisanjianfang, and the minimum (−18.6 ‰) from Hami. During summer months (from April to October), samples from Korla, located on the southern slope, had the maximum value of δ 18O (−1.6 ‰), and the minimum was from Barkol (−10.5 ‰). A similar pattern was observed for δD.
Fig. 3 Spatial distribution of precipitation-weighted δ 18O for each station around the Tianshan Mountains from August 2012 to September 2013. (a) Annual, (b) summer months and (c) winter months.
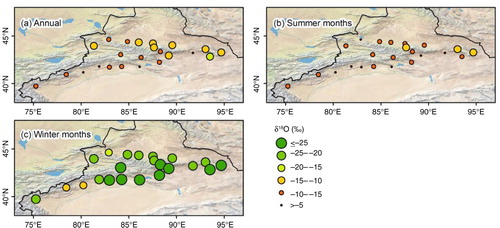
Table 2. Precipitation-weighted values of δD, δ 18O and D-excess for each station from August 2012 to September 2013
Low D-excess (d=δD–8δ 18O; Dansgaard, Citation1964) was measured in samples collected from the low rainfall stations and in winter months where there is very little rainfall (). Usually, low D-excess results from subcloud secondary evaporation, which also leads to enrichment of heavy isotopes in precipitation. Considering the sampling procedure mentioned above, evaporation during collection (i.e. on the funnel or in the collection bottle) can be generally excluded as a cause of low D-excess. For instance, in Jinghe, the rainfall amounts are very small in winter, and the D-excess is much lower than other stations on the northern slope due to the effect of subcloud evaporation. The low values of D-excess in Turpan and Shisanjianfang on the southern slope are also related to the low precipitation amount and high evaporation.
High D-excess values have also been detected in samples from some stations. In Urumqi, the biggest oasis city around the Chinese Tianshan Mountains, the summer D-excess is much higher than the neighbouring stations (e.g. Caijiahu, a rural station ~70 km north of Urumqi towards the Gurbantunggut Desert), which may result from moisture re-evaporation from surface water and vegetated urban areas of Urumqi as well as surrounding irrigable land. Precipitation extremes also influence the weighted mean values. For instance, in Aksu, the large precipitation amount in June 2013 (93.2 mm, also see ) is attributed to heavy rain events, whereas the long-term precipitation amount in June is just 12.7 mm. A single 31.8 mm event on 16/17 June 2013 had a D-excess value of 24.0 ‰, which is much higher than the seasonal and annual mean.
shows the monthly variation of δ 18O in precipitation from August 2012 to September 2013, and the air temperature and precipitation amount for each station are also presented. Generally, the δ 18O is more enriched in summer months than in winter months. Winter air masses are relatively cold and dry, and precipitation amount is very low, especially in the mountains and on the southern slope. This leads to a greater variability between sites in winter because of smaller sample numbers.
Fig. 4 Monthly variation of precipitation δ 18O, air temperature and precipitation amount for each station around the Tianshan Mountains from August 2012 to September 2013.
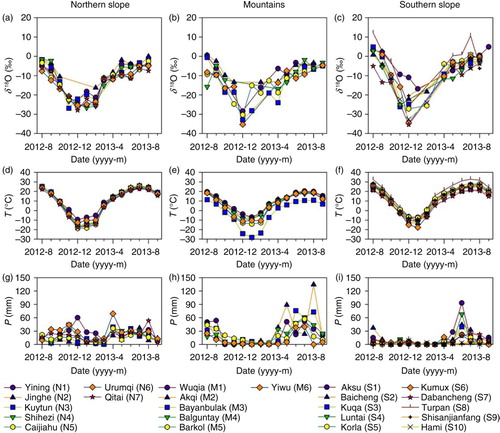
On the northern slope, the δ 18O for these stations is spatially coherent (a), and the most depleted precipitation occurred between November and February. These stations are located at similar latitudes (between 43°47′N and 44°37′N) where westerlies are the dominant vapour source (Tian et al., Citation2007; Yao et al., Citation2013). The isotopic values on the northern slope are comparable with previous studies at Urumqi (between −28.0 ‰ and 1.8 ‰ for δ 18O; IAEA/WMO, Citation2014) and Fukang (between −24.6 ‰ and −2.1 ‰ for δ 18O; Liu et al., Citation2014).
The value of δ 18O in the mountains is more variable than that on the northern slope (b). The Chinese Tianshan Mountains cover about 20° in longitude from west to east, and the terrain and precipitation distribution is complex. In a previous investigation (Feng et al., Citation2013), event-based δ 18O in precipitation at three mountainous sites (between 2130 m and 3693 m a.s.l.) mainly ranged between 0 ‰ and −30 ‰, which coincides with this study, although the minimum δ 18O in the current observation network is less than −30 ‰.
Compared with the two subregions above, enriched δ 18O is seen more frequently on the southern slope (c). In this subregion, the precipitation amount is very small, and strong evaporation greatly enriches the isotopic composition of precipitation. For example, in Turpan with 21 samples, most precipitation events (15 events) are <1 mm, and approximately half (11 events) are ≤0.3 mm. However, some of the most depleted rainfall is also seen south of the Tianshan Mountains, which reflects an isotopic rain shadow effect due to rainout, similar to that observed for the California and Nevada (e.g. Ingraham and Taylor, Citation1991).
4.2. Local meteoric water line
Using all the event-based samples in this study, a local meteoric water line (LMWL) is established as1
Based on the monthly weighted values, the LMWL () is2
Fig. 5 Correlation between monthly weighted δD and δ 18O for each station around the Tianshan Mountains from August 2012 to September 2013
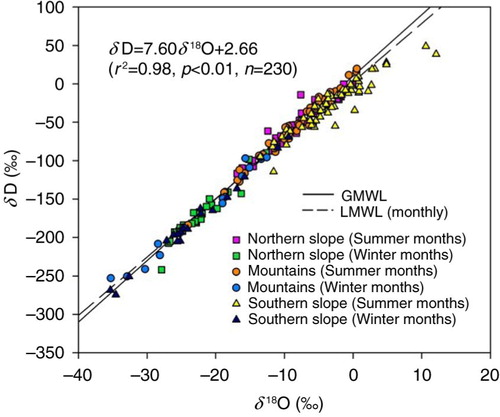
As shown in , during winter months, the study regions are generally cold and dry (b, 1d and 2), and precipitation is depleted in δD and δ 18O (). In contrast, the isotopic composition of monthly precipitation during summer months is more enriched. The slope of the LMWL is lower than that of the global meteoric water line (GMWL) of 8 (Craig, Citation1961). The low LMWL slope is associated with non-equilibrium conditions affecting falling raindrops during dry conditions (Liu et al., Citation2014), leading to the potential for significant subcloud evaporation.
Using the event-based values, the LMWLs for the northern slope, mountains and southern slope, respectively, are3
4
5
and the LMWLs for the whole region for the summer (Apr–Oct) and winter (Nov–Mar) months, respectively, are6
7
4.3. Meteorological controls on isotopic composition
In the study region, air temperature and vapour pressure are higher during summer and lower during winter. In contrast, relative humidity is lower in summer and higher in winter. In winter months, air temperature is usually below 0 °C, and surface air is very dry. In summer months, more moisture is delivered to the study region via westerlies, and rainfall is relatively frequent. The correlation coefficients between δ 18O and major meteorological parameters (air temperature, precipitation, relative humidity and vapour pressure) are shown in . The values of δ 18O show strong dependence on air temperature and vapour pressure, and the positive correlations between δ 18O and air temperature are statistically significant at the 0.05 level for each station. For most stations, the δ 18O–T correlation coefficients are larger than 0.7. Significant negative correlations between δ 18O and precipitation can only be seen at three stations (i.e. Yining, Kumux and Turpan), and the correlations for most regions are not significant. In addition, δ 18O–RH correlations are significantly negative for most stations, but the correlation between relative humidity and δ 18O is generally weaker than that between vapour pressure and δ 18O. This corresponds to the seasonality of relative humidity (higher in winter and lower in summer), air temperature and vapour pressure (lower in winter and higher in summer) and the stronger correlation with vapour pressure is likely to be due to its strong dependence on temperature.
Table 3. Slopes (S) and correlation coefficients (r) between δ 18O and meteorological parameters (T – air temperature, P – precipitation, RH – relative humidity and e – vapour pressure) during precipitation events for each station around the Tianshan Mountains from August 2012 to September 2013
The gradients between δ 18O and air temperature range from 0.54 ‰/°C (Aksu) to 1.14 ‰/°C (Hami), depending on the location (). Using the monthly weighted values, the δ 18O–T gradients range between 0.42 ‰/°C (Balguntay) and 1.04 ‰/°C (Turpan), and are generally higher than seen globally at the mid- and high-latitudes (0.55 ‰/°C; Rozanski et al., Citation1993) and elsewhere in China (0.36 ‰/°C based on GNIP; Gu, Citation2011). Among the four natural zones in China (i.e. North China, South China, Northwest China and Tibetan Plateau), Northwest China, where the Chinese Tianshan Mountains is located, has the highest δ 18O–T gradient (0.58 ‰/°C) (Liu et al., Citation2014), which is comparable with this study. The good correlation between air temperature and δ 18O in precipitation has previously also been reported for the Tianshan Mountains, although the gradients were different (e.g. 0.46 ‰/°C to 0.87 ‰/°C, Yao et al., Citation1999; 0.52 ‰/°C to 0.56 ‰/°C, Pang et al., Citation2011; 0.79 ‰/°C to 0.84 ‰/°C, Feng et al., Citation2013).
All the 1052 samples are applied to calculate the regional best-fit δ
18O–T equation:8
The equations for summer and winter months, respectively, are9
10
The gradient difference between the equations for liquid and solid samples, respectively, is only 0.01 ‰/°C:11
12
The difference in intercept between summer and winter samples mirrors that between liquid and solid samples; however, the differences in slope are very small. We investigate seven stations that have more than 10 solid samples (). In Caijiahu, Urumqi and Bayanbulak, the slopes derived from solid samples are larger than those from all the samples; in the other four stations (Yining, Shihezi, Qitai and Barkol), the slopes of solid samples are less than those of all the samples. Stable isotopes in ice cores are widely applied in paleoclimate studies, and in the Tianshan Mountains, δ 18O values in ice cores are considered as proxies of air temperature (Lee et al., Citation2003; Liu et al., Citation2011). Considering the δ 18O–T gradients shown in Table and 4 , the great spatial variation in gradients as well as the complex difference between snow and rain samples should be considered carefully in the application of these data to paleoclimate reconstruction.
Table 4. Total precipitation amounts (P), slopes (S) and correlation coefficients (r) between air temperature and δ 18O for solid and liquid samples in selected stations with >10 solid samples around the Tianshan Mountains from August 2012 to September 2013
4.4. Geographical controls on isotopic composition
The spatial distribution of stable isotopes is usually related to geographical factors, including altitude (Alt, in m), latitude (Lat, in degrees) and longitude (Lon, in degrees). Using stepwise regression, the value of δ
18O on an annual basis can be expressed as13
and the regressions in summer and winter months, respectively, are14
15
In summer months, both altitude and latitude significantly influence the distribution of δ values in precipitation. The strong moisture advection via westerlies leads to a relatively obvious altitude effect, and drier conditions on the southern slope enrich the isotope composition in precipitation. In winter, the distribution of isotopes in precipitation is more influenced by longitude than latitude, and the δ values in the western section are generally more enriched than those in the eastern section. This is a function of the rainout pathway, although the precipitation events are very scarce in winter.
On the northern slope, a one-degree increase in longitude (from west to east) may lead to a decrease of 0.46 ‰ (r 2=0.55, p=0.06, n=7) for δ 18O in summer months. Compared with that in summer months, the gradient in winter months (−0.21 ‰ for δ 18O, r 2=0.05, p=0.62, n=7) is closer to 0. In the mountains, a longitude increase of one degree corresponds to a 0.26 ‰ decrease in δ 18O during summer months (r 2=0.97, p<0.01, n=6) and a 0.41 ‰ decrease during winter months (r 2=0.37, p=0.28, n=5). On the southern slope, the gradients are −0.02 ‰ (r 2=0.00, p=0.91, n=10) in summer months and −0.58 ‰ (r 2=0.18, p=0.22, n=10) in winter months. This suggests that longitude effects exist for each subregion throughout the year, and the moisture transportation via westerlies influence the spatial distribution of isotope composition in precipitation.
4.5. Precipitation isoscape
As shown in Section 4.3, the isotopic composition significantly correlates with air temperature, and the strong linear regression can be used to estimate the contiguous distribution of isotopes (also known as an isoscape) in precipitation if air temperature is known. In this section, to calculate the isoscape of δ 18O, a spatial interpolation method with ancillary variable was applied, and included three steps:
(1) Based on the δ
18O–T regression model [eq. (8)], a gridded daily air temperature was used to calculate the value of δ
18O for each grid, and then a gridded daily precipitation was applied to weight the annual mean. It means that only the precipitation days (daily amount ≥0.1 mm) were considered to calculate the isotopic values for each grid box. The reconstructed isotopic composition (δ) in precipitation can be expressed as16
where P i and T i are the daily precipitation amount and air temperature, and k and b are the slope and intercept of fitting regression between temperature and isotopic values, respectively. The daily gridded data of air temperature and precipitation at 0.5° resolution from September 2012 to August 2013 were provided by NMIC (National Meteorological Information Center). The data set has been widely used in climate studies of the study region (e.g. Wang et al., Citation2013), and the details of data assimilation and precision were described by NMIC (Citation2012a,Citation b).
(2) The residual values for each sampling station were calculated, that is, difference of δ 18O value between linear estimation and observed data. Then, an inverse distance weight method was applied to spatially interpolate the residual values.
(3) Combine the predicted δ 18O value from the first step and interpolated residual values from the second step. Similar method was introduced in Bowen and Wilkinson (Citation2002), Bowen and Revenaugh (Citation2003), Liu et al. (Citation2008) and van der Veer et al. (Citation2009).
Based on the δ 18O–T correlations and high-resolution temperature and precipitation data set, the isoscape in precipitation for this region is shown in . The MBE (mean bias error), MAE (mean absolute error) and RMSE (root-mean-square error) of predicted δ 18O values in precipitation are −0.24 ‰, 2.09 ‰ and 2.62 ‰, respectively, and the correlation coefficient between estimated and observed δ 18O is 0.72 (p<0.05).
Fig. 6 Spatial distribution of predicted δ 18O in precipitation on an annual basis around the Tianshan Mountains from September 2012 to August 2013.
The annual isoscape predicts the Tarim Basin on the southern slope has δ 18O values greater than −5 ‰, and the Junggar Basin on the northern slope shows δ 18O greater than −15 ‰. It is clear that isotopic compositions on the southern slope are much more enriched than those on the northern slope. Generally, the southern basin is more arid and has higher surface air temperatures than the northern basin. This means that despite the isotopic rain-shadow effect, which leads to significantly depleted winter precipitation in the southern basin, its limited winter precipitation amount means that the annual isotope composition is more enriched than observed for northern basin sites. In addition, precipitation δ values for the mountains are generally more depleted than that for the low-lying basins, which reflects the influence of temperature as well as elevation. It should also be noted that whilst the western section of the Tianshan Mountains is at a much higher elevation than the eastern section, the most depleted δ 18O is not always found at the highest altitude. Although air temperature is an important factor controlling isotopic composition, the seasonal distribution of precipitation also greatly influences the isoscape of δ 18O especially in the arid regions.
4.6. Long-term variability in isotopic composition
To investigate the longer term variability in isotopic composition, the monthly isotopic values in precipitation in Urumqi (87°37′E, 43°47′N, station code 5182801) during periods 1986–1992, 1995–1998 and 2001–2003 were acquired from the GNIP database (IAEA/WMO, Citation2014). As shown in a, the variation in δ 18O between these periods is less during summer months, compared with winter months. For example, the weighted δ 18O in January 2013 is −24.8 ‰, but the value is −15.1 ‰ during January 2001–2003. The major meteorological parameters (air temperature, precipitation amount and vapour pressure) are also presented in b–d. The monthly air temperature and vapour pressure during the 2012–2013 sampling period are generally close to that observed in other decades, although the period 1995–1998 shows higher air temperature and larger vapour pressure in summer. For the monthly means in March and April, our sampling period also exhibits a higher temperature and vapour pressure. Compared with air temperature and vapour pressure, the monthly precipitation amount significantly varies between the four periods. During our sampling period, the precipitation amount in November and December is much larger than that in other decades, but amount from May to August is less than that in other periods.
Fig. 7 Monthly variations of (a) δ 18O in precipitation, (b) air temperature, (c) precipitation amount and (d) vapour pressure in Urumqi during periods 1986–1992, 1995–1998, 2001–2003 and 2012–2013. Dots represent all monthly data points.
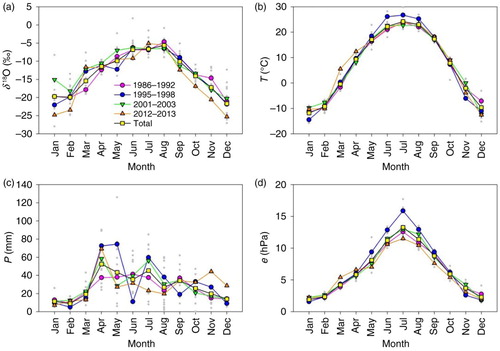
The relationship between δ 18O and meteorological parameters (especially air temperature) provides meaningful input to paleoclimate reconstruction. In , δ 18O–T correlations are calculated for different periods, using monthly mean air temperature. It is clear that the correlation between δ 18O and air temperature is always significantly positive (p<0.05). The δ 18O–T gradients have variation ranging from 0.35 ‰/°C (2001–2003) to 0.51 ‰/°C (2012–2013), and the correlation coefficient is up to 0.96 during 2012–2013.
Table 5. Slope (S) and correlation coefficient (r) between monthly δ 18O and air temperature and sample number (n) in Urumqi during periods 1986–1992, 1995–1998, 2001–2003 and 2012–2013
5. Conclusions
Event-based precipitation data from an observation network around the Tianshan Mountains of arid central Asia during 2012–2013 have been used to analyse the spatial distribution and seasonal variation of stable hydrogen and oxygen isotopes, and investigate meteorological and geographical controls under arid conditions. The values of stable isotopes in precipitation significantly correlate with surface air temperature for each station, and the best-fit equation between δ 18O value and air temperature is δ 18O=0.78T–16.01 (r 2=0.73, p<0.01). The isotopic values are usually more enriched in summer months (from April to October) and lower in winter months (from November to March). In winter, the data indicate an isotopic rain shadow effect whereby rainout leads to depletion of the very small amounts of winter precipitation in the most arid region to the south of the Tianshan Mountains. Small rainfall amounts and low humidity in both summer and winter result in low D-excess due to subcloud evaporative processes which is particularly evident in this southern zone. Based on a high-resolution daily air temperature and precipitation data set, an annual precipitation isoscape for the region is presented based on the temperature effect observed in this study.
Acknowledgements
The study is supported by the National Natural Science Foundation of China (No. 41161012) and the National Basic Research Program of China (No. 2013CBA01801). The authors greatly thank the Xinjiang Meteorological Bureau and all the meteorological stations for collecting the precipitation samples and providing the meteorological records. They also thank the colleagues in the Northwest Normal University for their help in laboratory analysing and field work.
References
- Araguás-Araguás L. , Froehlich K. , Rozanski K . Stable isotope composition of precipitation over southeast Asia. J. Geophys. Res. 1998; 103: 28721–28742.
- Araguás-Araguás L. , Froehlich K. , Rozanski K . Deuterium and oxygen-18 isotope composition of precipitation and atmospheric moisture. Hydrol. Process. 2000; 14: 1341–1355.
- Bowen G. J., Revenaugh J. Interpolating the isotopic composition of modern meteoric precipitation. Water Resour. Res. 2003; 39: 1299. DOI: http://dx.doi.org/10.1029/2003WR002086.
- Bowen G. J. , Wilkinson B. H . Spatial distribution of (18O in meteoric precipitation. Geology. 2002; 30: 315–318.
- Chen X . Retrieval and analysis of evapotranspiration in central areas of Asia. 2012; China Meteorological Press, Beijing (in Chinese).
- Craig H . Isotopic variations in meteoric waters. Science. 1961; 133: 1702–1703.
- Crawford J. , Hughes C. E. , Parkes S. D . Is the isotopic composition of event based precipitation driven by moisture source or synoptic scale weather in the Sydney Basin, Australia?. J. Hydrol. 2013; 507: 213–226.
- Dansgaard W . Stable isotopes in precipitation. Tellus. 1964; 16: 436–468.
- Divine D. V. , Sjolte J. , Isaksson E. , Meijer H. A. J. , van de Wal R. S. W. , co-authors . Modelling the regional climate and isotopic composition of Svalbard precipitation using REMOiso: a comparison with available GNIP and ice core data. Hydrol. Process. 2011; 25: 3748–3759.
- Feng F. , Li Z. , Zhang M. , Jin S. , Dong Z . Deuterium and oxygen 18 in precipitation and atmospheric moisture in the upper Urumqi River Basin, eastern Tianshan Mountains. Environ. Earth Sci. 2013; 68: 1199–1209.
- Gu W . Isotope Hydrology. 2011; Beijing (in Chinese): Science Press.
- Hijmans R. J. , Cameron S. E. , Parra J. L. , Jones P. G. , Jarvis A . Very high resolution interpolated climate surfaces for global land areas. Int. J. Climatol. 2005; 25: 1965–1978.
- Hou S. , Qin D. , Mayewski P. A. , Yang Q. , Ren J. , co-authors . Climatological significance of δ 18O in precipitation and ice cores: a case study at the head of the Ürümqi River, Tien Shan, China. J. Glaciol. 1999; 45: 517–523.
- Hughes C. E. , Crawford J . A new precipitation weighted method for determining the meteoric water line for hydrological applications demonstrated using Australian and global GNIP data. J. Hydrol. 2012; 464/465: 344–351.
- IAEA/WMO. Global Network of Isotopes in Precipitation, the GNIP Database. 2014. Online at: http://www.iaea.org/water.
- Ingraham N. L. , Taylor B. E . Light stable isotope systematics of large-scale hydrologic regimes in California and Nevada. Water Resour. Res. 1991; 27: 77–90.
- Jasechko S. , Gibson J. J. , Edwards T. W. D . Stable isotope mass balance of the Laurentian Great Lakes. J. Great Lakes Res. 2014; 40: 336–346.
- Jasechko S. , Sharp Z. D. , Gibson J. J. , Birks S. J. , Yi Y. , co-authors . Terrestrial water fluxes dominated by transpiration. Nature. 2013; 496: 347–350.
- Jouzel J. , Delaygue G. , Landais A. , Masson-Delmotte V. , Risi C. , co-authors . Water isotopes as tools to document oceanic sources of precipitation. Water Resour. Res. 2013; 49: 7469–7486.
- Kong Y., Pang Z., Froehlich K. Quantifying recycled moisture fraction in precipitation of an arid region using deuterium excess. Tellus B. 2013; 65: 19251. DOI: http://dx.doi.org/10.3402/tellusb.v65i0.19251.
- Lee X., Qin D., Jiang G., Duan K., Zhou H. Atmospheric pollution of a remote area of Tianshan Mountain: Ice core record. J. Geophys. Res. 2003; 108: 4406. DOI: http://dx.doi.org/10.1029/2002JD002181.
- Lis G. , Wassenaar L. I. , Hendry M. J . High-precision lasers spectroscopy D/H and 18O/16O measurements of microliter natural water samples. Anal. Chem. 2008; 80: 287–293.
- Liu J. , Song X. , Sun X. , Yuan G. , Liu X. , co-authors . Isotopic composition of precipitation over Arid Northwestern China and its implications for the water vapor origin. J. Geogr. Sci. 2009; 19: 164–174.
- Liu J., Song X., Yuan G., Sun X. Stable isotopic compositions of precipitation in China. Tellus B. 2014; 66: 22567. DOI: http://dx.doi.org/10.3402/tellusb.v66.22567.
- Liu X. , Rao Z. , Zhang X. , Huang W. , Chen J. , co-authors . Variations in the oxygen isotopic composition of precipitation in the Tianshan Mountains region and their significance for the Westerly circulation. J. Geogr. Sci. 2015; 25: 801–816.
- Liu Y., Hou S., Hong S., Hur S. D., Lee K., co-authors. High-resolution trace element records of an ice core from the eastern Tien Shan, central Asia, since 1953 AD. J. Geophys. Res. 2011; 116: 12307. DOI: http://dx.doi.org/10.1029/2010JD015191.
- Liu Z. , Tian L. , Chai X. , Yao T . A model-based determination of spatial variation of precipitation δ 18O over China. Chem. Geol. 2008; 249: 203–212.
- Mariani I. , Eichler A. , Jenk T. M. , Brönnimann S. , Auchmann R. , co-authors . Temperature and precipitation signal in two Alpine ice cores over the period 1961–2001. Clim. Past. 2014; 10: 1093–1108.
- NMIC (National Meteorological Information Center). Assessment report of China's surface air temperature 0.5°×0.5° gridded dataset (V2.0). 2012a; Beijing (in Chinese): NMIC.
- NMIC (National Meteorological Information Center). Assessment report of China's surface precipitation 0.5°×0.5° gridded dataset (V2.0). 2012b; Beijing (in Chinese): NMIC.
- Pang Z. , Kong Y. , Froehlich K. , Huang T. , Yuan L. , co-authors . Processes affecting isotopes in precipitation of an arid region. Tellus B. 2011; 63: 352–359.
- Pfahl S. , Sodemann H . What controls deuterium excess in global precipitation?. Clim. Past. 2014; 10: 771–781.
- Rozanski K. , Araguás-Araguás L. , Gonfiantini R . Swart P. K. , Lohmann K. C. , McKenzie J. , Savin S . Isotopic patterns in modern global precipitation. Climate Change in Continental Isotopic Records. 1993; Geophysical Monograph 78, AGU, Washington, DC. 1–36.
- Sodemann H., Masson-Delmotte V., Schwierz C., Vinther B. M., Wernli H. Interannual variability of Greenland winter precipitation sources: 2. Effects of North Atlantic Oscillation variability on stable isotopes in precipitation. J. Geophys. Res. 2008; 113: 12111. DOI: http://dx.doi.org/10.1029/2007JD009416.
- Thompson L. G. , Mosley-Thompson E. , Davis M. E. , Zagorodnov V. S. , Howat I. M. , co-authors . Annually resolved ice core records of tropical climate variability over the past ~1800 years. Science. 2013; 340: 945–950.
- Tian L., Yao T., MacClune K., White J. W. C., Schilla A., co-authors. Stable isotopic variations in west China: a consideration of moisture sources. J. Geophys. Res. 2007; 112: 10112. DOI: http://dx.doi.org/10.1029/2006JD007718.
- Uemura R. , Yonezawa N. , Yoshimura K. , Asami R. , Kadena H. , co-authors . Factors controlling isotopic composition of precipitation on Okinawa Island, Japan: implications for paleoclimate reconstruction in the East Asian Monsoon region. J. Hydrol. 2012; 475: 314–322.
- van der Veer G. , Voerkelius S. , Lorentz G. , Heiss G. , Hoogewerff J. A . Spatial interpolation of the deuterium and oxygen-18 composition of global precipitation using temperature as ancillary variable. J. Geochem. Explor. 2009; 101: 175–184.
- Wang S. , Zhang M. , Chen F. , Che Y. , Du M. , co-authors . Comparison of GCM-simulated isotopic compositions of precipitation in arid central Asia. J. Geogr. Sci. 2015; 25: 771–783.
- Wang S. , Zhang M. , Sun M. , Wang B. , Li X . Changes in precipitation extremes in alpine areas of the Chinese Tianshan Mountains, central Asia, 1961–2011. Quatern. Int. 2013; 311: 97–107.
- Wang Y., Wang J., Qi Y., Yan C. Dataset of desert distribution in China (1: 100,000). Environmental and Ecological Science Data Center for West China. 2005. National Natural Science Foundation of China, Lanzhou. DOI: http://dx.doi.org/10.3972/westdc.006.2013.db.
- Yao T. , Masson V. , Jouzel J. , Stievenard M. , Sun W. , co-authors . Relationships between δ 18O in precipitation and surface air temperature in the Urumqi River Basin, East Tianshan Mountains, China. Geophys. Res. Lett. 1999; 26: 3473–3476.
- Yao T. , Masson-Delmotte V. , Gao J. , Yu W. , Yang X. , co-authors . A review of climatic controls on δ 18O in precipitation over the Tibetan Plateau: observations and simulations. Rev. Geophys. 2013; 51: 525–548.
- Zhang X. , Zhang J . Xinjiang Meteorological Handbook. 2006; Beijing (in Chinese): China Meteorological Press.
- Zhang X. , Yao T. , Liu J . Oxygen-18 in different waters in Urumqi River Basin. J. Geogr. Sci. 2003; 13: 438–446.
- Zhu X. , Zhang M. , Wang S. , Qiang F. , Zeng T. , co-authors . Comparison of monthly precipitation derived from high-resolution gridded datasets in arid Xinjiang, central Asia. Quatern. Int. 2015; 358: 160–170.