
Abstract
This study presents a stable oxygen isotope (δ18O) record in daily precipitation from two sites located to the northeast of the Tibetan Plateau (TP): Yushu on the eastern TP and Xi'an on the eastern Chinese Loess Plateau. It attempts to reveal the unique features associated with variations in atmospheric circulation patterns over inland China. For δ18O in daily precipitation at both stations, temperature effect is significant (p < 0.01) only during non-monsoon, while amount effect is significant only during monsoon. This suggests the coexistence of local recycling with large-scale atmospheric circulation on regional precipitation, which is further verified by the significant correlation of relative humidity with δ18O at both stations during monsoon season. The similarity of δ18O in regions under the supposedly same atmospheric circulation streams is tested for Yushu with that at Lhasa, Lulang and Delingha, demonstrating the lag days of δ18O depletion at Yushu with that at Lulang as varying from 15 to 25 d. This confirms the Bay of Bengal monsoon dominance over Yushu. Daily δ18O at Xi'an is compared with contemporary data at Changsha and Guangzhou, featuring a close correlation with the East Asian summer monsoon evolution processes over eastern China, and reflecting the Meiyu-Baiu front influence during July. Back-trajectory analysis in October–November at Xi'an identified the combined effect of cooling of the atmospheric column by the colder air from the west and the lifting of the warmer air from the east, which coexists with local water vapour source. Interactions of the three result in condensation at lower temperatures that is coupled with the long-distance transport of 2/3 of the available water vapour, thus leading to extremely low δ18O values in the post-monsoon precipitation.
1. Introduction
Despite the prevailing westerly over the mid-latitudes in the Northern Hemisphere, north and central China is strongly influenced by the Asian summer monsoon both in the past and at present. The Asian summer monsoon reaches the inland China and directly affects the normal function and development of the society in the region. The Asian summer monsoon consists of several sub-monsoon systems whose onset mechanisms and evolution processes differ from each other. The accurate identification and delineation of the margins of these various sub-monsoonal domains can facilitate weather forecasting in addition to the reconstruction of paleoclimate using paleoproxies. Among the existent efforts, LinHo and Wang (Citation2002) delineated various domains of the sub-monsoon system in Asia using the relative pentad mean precipitation rate, while Conroy and Overpeck (Citation2011) used empirical orthogonal function analysis of precipitation amount to further identify the sub-monsoon domains of the region. From all those studies, the East Asian summer monsoon (EASM) and the Indian summer monsoon (ISM) including the Bay of Bengal (BOB) monsoon are the most important sub-monsoon systems. The transboundary region between the EASM and the ISM is complex and sensitive and raise uncertainties in weather forecasting and paleoclimate reconstruction.
In addition to using precipitation and/or atmospheric circulation to describe monsoonal intensity (An et al., Citation2015), stable isotopes in precipitation (including δ18O and δD) can also be used to record atmospheric circulation routes and processes; this is an effective and valid method, since the ocean is the original moisture source, and ocean–atmospheric interaction is the principal driver of the global climate. Stable oxygen isotopes are also a widely used proxy in paleoclimatic reconstructions, which themselves facilitate our understanding of historic regional temperature, precipitation and atmospheric circulation patterns (Latif and Keenlyside, Citation2009). Yet under the influence of different atmospheric circulation systems, stable oxygen isotopes in precipitation exhibit differing characteristics in response to different precipitation formation mechanisms. For example, δ18O values are usually taken as reflecting monsoonal intensity in monsoonal domains (Bird et al., Citation2014; Cai et al., Citation2015), but as recording local temperatures in regions dominated by westerlies (Cheng et al., Citation2012). The placement of a particular site in a particular atmospheric domain thus influences how δ18O values in precipitation are climatically interpreted. This is further complicated by the effect that monsoonal circulation patterns have on the significance of altitude effect of δ18O in precipitation, which leads to variation gradient of δ18O with altitude bearing directly on the paleoaltitude reconstruction of the plateau using stable isotopes. Given the continuing controversy surrounding Tibetan Plateau (TP) uplift, and especially the northeastern sector of the Plateau, any further elucidation of atmospheric circulation patterns over inland China also has a geological relevance. Few studies so far, however, have focused on such areas in East Asia.
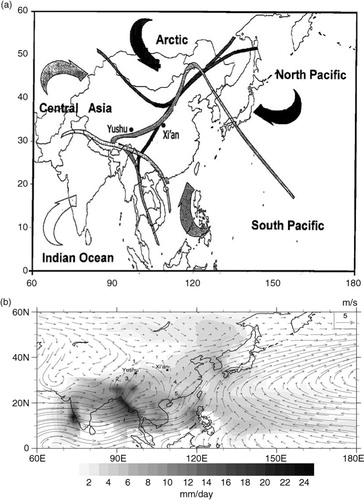
According to some recent studies of δ18O in precipitation, Asian Summer Monsoon influence in the northeastern TP remains weak (Tian et al., Citation2008); rather, westerlies and the continental recycling of moisture predominate (Yu et al., Citation2014). However, these studies either focused on a single site, or their data covered a short period, making their findings potentially subject to synoptic influences. This study presents a 4-yr concurrent dataset of stable oxygen isotopes in precipitation from two stations, Xi'an (in central China) and Yushu (on the northeastern TP), to clarify the climatic significance of stable oxygen isotopes and the impact of large-scale atmospheric circulation patterns on the climate of East Asia. Our study takes Yushu as the putative northern limit of ISM intrusion (Araguas-Araguas et al., Citation1998; Tian et al., Citation2001, Citation2007), and Xi'an as the notional western limit of the EASM (Gao et al., Citation1962) (b). It attempts to advance the current understanding of the region's climate using the latest δ18O values in precipitation to: (1) identify the functioning sub-monsoonal systems over their respective geographical ranges; and (2) verify any consistency in stable oxygen isotope values in precipitation found at each station with the relevant large-scale atmospheric circulation system.
Fig. 1 Map of reported sites in this study. (a) Distribution of stations in the atmospheric circulation map over East Asia by Araguas-Araguas et al. (Citation1998). (b) Seasonal precipitation difference (JJA-DJF) and 850-hPa wind streams during July–September. Black dots in both panels refer to our sampling sites, and numbers refer to other stations subjected to lagged correlation analysis in this study: (1) Delingha (37°22′N, 97°22′E), (2) Lhasa (29°40′N, 91°7.8′E), (3) Lulang (29°46′N, 94°43′E), (4) Changsha (28°13′N, 112°55′E), and (5) Guangzhou (23°10′N, 113°19′E). Wind data are derived from monthly long-term averages during 1981–2010 in the NCEP/NCAR reanalysis data (Kalnay et al., Citation1996), and precipitation data derived from those in the GPCP version 2.2 data set.
2. Data and methods
2.1. Sampling and analysis
The station at Yushu (97°01′, 33°01′, 3682 m above sea level (a.s.l.)), located south of the Kunlun Mountain pass on the northeastern margins of the TP, recorded precipitation values for the period 2004–2007, inclusive. The station at Xi'an (108°58′, 34°26′, 410 m a.s.l.), located slightly north of the Qinling Mountains on the western margins of the Chinese Loess Plateau (CLP), collected precipitation samples continuously from 2006 onwards (). These local meteorological stations were asked to sample precipitation events with values >0.1 mm, and to note concurrent air temperature (T), precipitation amount (P), 2-m relative humidity (RH), wind speed (WS), and/or air pressure (AP) at the beginning and end of each event. A deep bucket with a plastic bag inside was used for precipitation collection, with precipitation collected immediately after every event and poured into a 15-ml polyethylene bottle. These bottles were filled as full as possible before being tightly capped and stored in a cool and shady place to avoid post-sampling evaporation.
The δ18O values of these samples were measured using a measurement and analysis technique (MAT) 253 isotope ratio mass spectrometer at the Laboratory of Tibetan Environment Changes and Land Surface Processes of the Chinese Academy of Sciences (CAS). Analytical uncertainty was set at ±0.05 ‰. This method is described in Yang et al. (Citation2012). We also subjected precipitation samples collected at Yushu from June 2006 to December 2007 inclusive to re-measurement using a Picarro-L2102i instrument. The analytical uncertainty using Picarro was set at ±0.10 ‰ for δ18O results, and ±0.50 ‰ for δD results. Of all the δ18O results measured by both machines, 98 % exhibited a standard deviation of <0.50 ‰, thus verifying the results provided by both machines. We then calculated the deuterium excesses using the equation d-excess = δD-8×δ18O (Dansgaard, Citation1964), and discarded those data with δ18O > 0 and d-excess<0, as, according to the Rayleigh distillation method, those samples are likely to have undergone post-sampling evaporation, and thus may have biased our interpretation of atmospheric circulation systems. Following Wushiki (Citation1993), we also disregarded those data with absolute d-excess values >40 ‰. After following these procedures, three out of the 198 Xi'an samples and 19 out of the 488 Yushu samples were discarded. We have focused only on MAT-253 measured δ18O results throughout this study, as MAT-253 was used in a more timely manner for measurements, and δ18O, compared with δD, is less susceptible to sample evaporation during storage.
The amount-weighted δ18O means were compared with previously-published measurements to verify the reliability of any remaining samples. The weighted d-excess at Yushu during 2007 averaged 10.06 ‰, higher than at Lhasa (7.1 ‰) to its south (GNIP dataset) and Lanzhou (7.6 ‰) to its east (Tian et al., Citation2003), and slightly lower than at Madoi (11.2 ‰) at the source of the Yellow River (Ren et al., Citation2013). This suggests that Yushu can be considered semi-arid. The weighted mean for 2009 at Xi'an exhibited a d-excess of 9.46 ‰, within the range of annual averages yielded during 1986–1991 (from 8.0 to 11.3 ‰) at Xi'an in the Global Network of Isotope in Precipitation (GNIP) dataset. Analyses of the 4-yr datasets for Yushu (2004–2007, inclusive) and Xi'an (2006–2009, inclusive) are here presented to demonstrate δ18O seasonality and ensure the reliability.
2.2. Data and back-trajectory computations
To verify the local climatic controls over δ18O, as well as those from large-scale atmospheric circulations, we resorted to the ground-based measurement of the daily data by the National Meteorological Information Center of the China Meteorological Administration (CMA) for calibration and input of additional meteorological parameters in the correlation analyses. We also referred to the National Centers for Environmental Prediction/National Center for Atmospheric Research (NCEP/NCAR) reanalysis data (ftp.cpc.ncep.noaa.gov) (Kalnay et al., Citation1996) for zonal and meridional wind direction/speed, monthly means of outgoing long wave radiation (OLR) from National Oceanic and Atmospheric Administration (NOAA) interpolated OLR dataset, and to the GPCP (Adler et al., Citation2003) Version 2.2 for long-term monthly precipitation average for 1981–2010 at 2.5°×2.5° spatial resolution. Vertical integral of water vapour flux and divergence (0.75°×0.75°) on a monthly scale are also obtained in the ERA-Interim global atmospheric reanalysis from the European Center for Medium-Range Weather Forecasts (ECMWF).
The Air Resources Laboratory's HYbrid Single-Particle Lagrangian Integrated Trajectory (HYSPLIT) model adopts a hybrid calculation between the Lagrangian and Eularian approaches, and can approximate the general origin of an air mass once integrated with the NCEP/NCAR reanalysis data (Breitenbach et al., Citation2010). Limited by the accessibility of high-resolution and reliable reanalysis data across the TP; however, we only used the offline HYSPLIT 4 back-trajectory tool to trace possible moisture origins for Xi'an. To get a general picture of the moisture transportation, trajectories were calculated for every precipitation day throughout the year at a time step of 98 hours and a height of 500 m a.s.l., as the North China Plain in the upwind direction of Xi'an is at low altitude and the vapour-bearing air is expected to be active at this height. Back-trajectory cluster analysis was also conducted for months witnessing the annual minimum value during 2006–2009, as isotopic depletion in precipitation in the mid-low latitudes is usually associated with at unique atmospheric circulation and/or the climatological pattern. This procedure helps identify the air mass trajectory patterns and quantify the contributions of air masses along major trajectories to precipitation over the sampling site.
2.3. Correlation analyses
To determine potential controlling factors over precipitation δ18O variation and explore its possible mechanisms, predictors’ selection was conducted on δ18O from various meteorological parameters using the stepwise linear regression. K was taken as the number of steps in this process, and individual predictors were selected from the potential predictor pool step by step. The predictor with the best linear regression (i.e. the largest correlation coefficient and F ratio, and the smallest mean standard error) was taken as the primary predictor (K1) and was used in Step 1. Subsequent predictors (K2, K3 …) were those which exhibited the next best linear regression as combined with K1 (Wilks, Citation2006).
Similarity estimators were used to quantify potential correlation lags. As the datasets from the two stations were all based on a daily temporal resolution covering quite different temporal intervals, we adopted the Gaussian-kernel-based cross correlation function (gXCF) and event synchronisation function (ESF) for extreme events sampled at irregular intervals (Rehfeld and Kurths, Citation2014). Using the standard gXCF approach of Rehlfeld et al. (Citation2011), our time series data were resampled using linear interpolation, which was followed using a fast Fourier transformation–based routine before applying a Lomb-Scargle periodogram and slotting to select observation intervals. The difference between any particular observation interval and the desired lag was then observed when weighing products using a Gaussian kernel. The ESF is based on the concept of event synchronisation (Quiroga et al., Citation2002), which was originally conceived for detecting neurophysiological signals (Quiroga et al., Citation2002), and later applied to rainfall pattern investigations in the Asian monsoonal domain (Malik et al., Citation2010), and in Europe (Rheinwalt et al., Citation2012). The ESF is particularly suitable for the analysis of δ18O depletions, since it is not based on the available time series, but rather on the relative timings of distinguished events over two time series. The ESF synchronises these events in addition to identifying the strength and direction of such associated events.
3. Results
3.1. General variations of stable oxygen isotope in precipitation
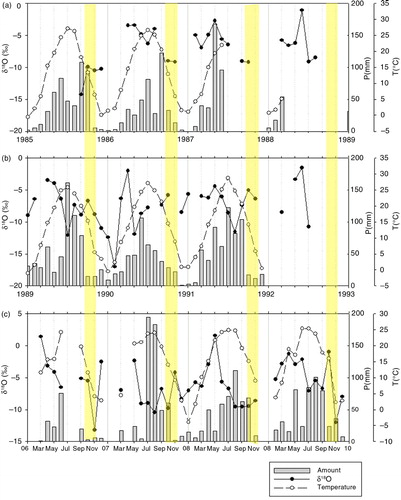
The daily δ18O series from Xi'an show that depletion due to monsoonal precipitation is dominant between July and September. The most depleted values appear during October and November every year throughout the 4-yr period (2006–2009, inclusive) (a). The δ18O depletions in 2006 and 2009 correspond to dramatic decreases in surface air temperature, and in the period 2007–2008 to frequent heavy precipitation (a). The seasonality of the maximal depleted values occurring during November is clear over the 4-yr time series (c). A comparison of our observations at Xi'an with the GNIP dataset (1985–1992) shows similar features in seasonality (i.e. enrichment in the first half-year, with a peak in April–May, followed by depletion in the second half-year, with a trough during July–September).
Fig. 2 Stable oxygen isotope in daily precipitation and corresponding meteorological parameters at Yushu and Xi'an. (a) Daily δ18O variations (black dotted curve) with corresponding temperature (grey curve with open dots) and precipitation amount (grey columns) during observation period of 4 yr at Xi'an. (b) Same as (a), but for Yushu. (c) Four-year monthly δ18O and major meteorological parameters with error bars at Xi'an. (d) Same as (c), but for Yushu. Semi-transparent grey bars in (a) highlight the coincidence of dramatic isotopic depletion with the temperature drop, while black boxes mark the coincidence with frequent precipitation. Grey triangles in (b) indicate long-term monthly averages of GNIP data at Xi'an.
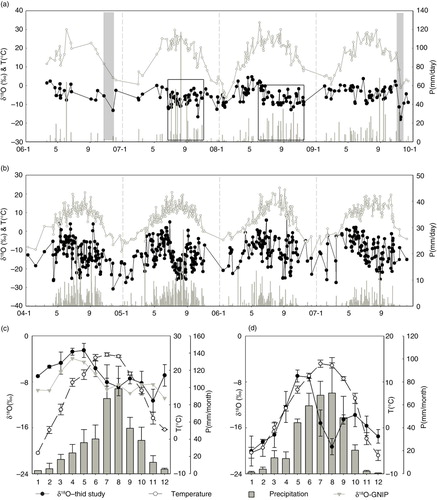
Values for daily δ18O series at Yushu range from −27.38 to 10.56 ‰ over the period 2004–2007, inclusive. The annual peak value falls once in May (9 May 2004), twice in June (26 June 2005 and 27 June 2006) and once in July (23 July 2007), while the annual minimum values appear mostly during winter (November–March), following the temperature variation pattern (c). Four-year seasonality of δ18O also shows the most depletion in January and less negative values in May–June (d). Note the high δ18O values during May–June at Yushu, which corresponds to high precipitation amounts and rising temperature (d). The δ18O enrichment during late spring and early summer has also been reported in precipitation in the southeastern TP (Tian et al., Citation2001; Xu et al., Citation2009), and has been attributed to enhanced local evaporation with increased insolation The brief decrease of δ18O during August from May to June level by over 9 ‰ corresponds to high precipitation amounts and air temperatures, suggestive of a direct correlation with the EASM and the rainout effect.
3.2. Correlations between δ18O and meteorological factors at both stations
The climatic effects on δ18O are exemplified by the correlation coefficients between daily δ18O values and major meteorological parameters, including precipitation amount, surface air temperature, surface air pressure and RH during precipitation events ().
Fig. 3 Correlation of weighted daily δ18O with corresponding temperature (a), precipitation amount (b), relative humidity (c) and surface pressure (d) at both Xi'an (closed dots and black fonts) and Yushu (open dots and blue fonts) throughout the year (upper panels), during monsoon (middle panels) and non-monsoon (lower panels) seasons, respectively, in the 4-yr period.
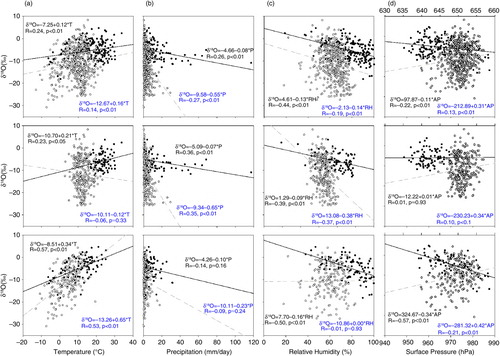
δ18O correlates more strongly with meteorological factors at Xi'an than at Yushu. The statistical approach normally regards R-squared as measuring the proportion of variance explainable in one variable using one or more other variables (Wilks, Citation2006). RH accounts for 15 % of the total δ18O variance at Xi'an during the monsoon season, 25 % of the total during the non-monsoonal season, and 19 % of the total for the entire observation period. Thirteen percent more of the total δ18O variance at Xi'an can be explained by precipitation amount during monsoon and 64 % more be explained by temperature and air pressure (with each explaining 32 % of the corresponding variance) during non-monsoon season (). In comparison, at Yushu, 26 % of the total δ18O variance can be related to moisture conditions during the monsoon season, and 28 % of the total can be related to temperature during the non-monsoonal season. In general, δ18O variance can be explained less by local meteorological factors during the monsoon season than during the non-monsoonal season at both stations (28 % vs. 89 % at Xi'an, and 26 % vs. 28 % at Yushu) ().
Stepwise linear regression identified the combination of RH, temperature, and precipitation amount as the most effective set of local parameters that correlate with δ18O at Xi'an (accounting for 31 % of the total variance), while the combination of amount, temperature, RH and air pressure was the most effective set for Yushu (accounting for 15 % of the total variance during 2004–2007, inclusive). Low RH largely corresponds to high δ18O values, suggestive of isotopic enrichment due either to bare soil evaporation or secondary evaporation of falling raindrops (Risi et al., Citation2010; Lee et al., Citation2015). Both cases imply the importance of local recycling at inland stations. Previous studies (Yang et al., Citation2006; Bershaw et al., Citation2012) have identified the significant contributions made by local moisture and continental recycling, with ~46.86 % of the total precipitation in the northern TP being formed by water vapour that has evaporated from local sources, and 21.8 % from water vapour that has evaporated on the transportation pathway as it has entered the TP (Yang et al., Citation2006). A numerical simulation for the northern TP has demonstrated that ~71 % of the precipitation falling from June to August comes from land surface evaporation (Numaguti, Citation1999). The coexistence of temperature and precipitation amount in controlling δ18O variations coincides with seasonal correlation analyses for both stations, i.e. there is a significant precipitation amount effect during the monsoon season (b), while temperature is the primary control during the non-monsoonal season (a). This pattern is indicative of the various seasonal precipitation mechanisms (including convection, advection, and/or re-evaporation) associated with large-scale atmospheric circulation. Variations in precipitation δ18O within the Asian monsoonal domain should therefore also be considered from the large-scale atmospheric circulation perspective (Vuille et al., Citation2005).
4. Discussions
4.1. The BOB monsoon signal in δ18O at Yushu
One-year data from three additional stations on the TP was chosen to validate the time series variations in δ18O at Yushu, and to verify the monsoon signal in δ18O at that station. To the south, Lhasa falls within the ISM domain, whereas Lulang, on the southeastern TP, is influenced by the BOB monsoon (Yang et al., Citation2012). Similar to the ISM, the BOB monsoon is a sub-system of the Asian summer monsoon. But different from the ISM which features the propagation of the convection centre from the equatorial Indian Ocean (Wang et al., Citation2008), the BOB monsoon is characterised by deep convection and strong southerlies in the eastern front of the Burma trough, and a lower-layer low and an upper-layer high near Rangoon (Wu and Zhang, Citation1998; Mao and Wu, Citation2007; Wu et al., Citation2012). For the BOB monsoon influenced region, the oceanic vapour originates from the BOB and moves north- and northwest-ward to the TP.
Annual precipitation days generally decrease from south to north on the TP. Despite the longer distance from the BOB, however, the precipitation frequency (116 d vs. 119 d) at Yushu is similar to that at Lulang, with almost identical amplitude of δ18O variations (standard error σ as 0.57 at Yushu, and as 0.6 at Lulang). The similarity is especially highlighted during summer monsoon when variation patterns of δ18O at both stations resemble each other, with notable depletion at Yushu appearing several days later after δ18O depletion of the same extent at Lulang (a). The general variation pattern at both Yushu and Lhasa entering June shows significant synchronicity, featuring stepwise depletion in, consecutively, early June, late June and early July–August, with notable negative δ18O anomalies almost coinciding with each other for both time series (a), attributable to convective cooling under the influence of the monsoonal cyclone.
Fig. 4 (a) Time series of normalised daily δ18O in 2007 at selected stations on the Tibetan Plateau; (b) similarity estimation of daily δ18O time series at Yushu to that at Lulang and Lhasa, respectively, using two estimators for sampling at irregular time intervals in 2007; (c) similarity spectral grams of daily δ18O time series at Yushu to that at Lulang as they change with time in 2007, using gXCF. Blue and green lines in (b) refer to results of the correlation analyses for different statistical approaches. The blue lines result from an ESF for extreme events sampled at irregular intervals, while green lines result from the gXCF that is useful to understand the intra-seasonal variation throughout the entire time series. The six columns in (c) refer to six intervals of 60 d for the similarity spectral gram. The lack of sample data at the beginning of the year for both stations leads to missing data (black) in part of the left-most column. The warmer the colour is, the higher the similarity is between time series of the two stations.
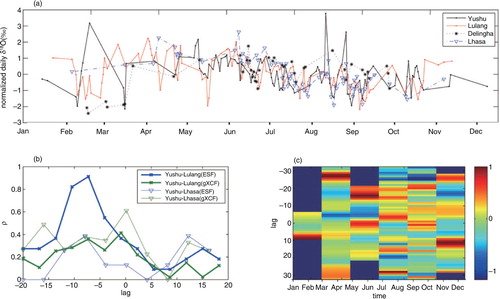
b shows significant, but different, lags in the correlations in δ18O time series between Yushu and those at Lulang and Lhasa. Using the ESF established, within a 90 % confidence interval, 45.6 % of the extremely depleted δ18O at Lulang precedes a similar event at Yushu by 7 d (with the strength of the event synchronisation reaching 0.91), while 12.9 % of the extremely depleted δ18O at Lhasa occurs 12 d after the similar event at Yushu (with the strength of the event synchronisation reaching 0.52). With the extreme δ18O depletion associated with deep convection and intensified monsoon northward intrusion, the robust cross correlation between those time series suggests Yushu as under the same circulation dominance as Lulang, that is, the BOB monsoon. The further southern location, yet later emergence of isotopic signal of monsoon at Lhasa suggests ISM active over Lhasa may not have noticeable effect on Yushu. We also investigated the striking similarities between the Yushu and Lulang δ18O time series, and found that the lag in correlation changed over time. The isotopic variation at Lulang (LL) usually leads that at Yushu during the summer half-year (April–September), while lags during the winter half-year, which is consistent with the seasonal transition of the prevailing wind circulation over eastern TP. During the summer half-year, lagged period for time series variation between both stations is suggested to vary from 15 d during the monsoon mature phase to 25 d during early monsoon period (day 61–120) (c). The results thus show a significant correlation lag over different time periods, with the number of lag days generally varying from 15 to 25 for the annual time series (c), while reaching 7 d under very strong BOB monsoon influence. As the monsoonal winds move further northward, their effect on δ18O depletion relative to monsoonal convection weakens, resulting in a shorter period of monsoon-associated depletion in precipitation δ18O values. This is demonstrated by the identical variations in δ18O at Yushu and Delinghua during June, when a notable, but brief, decrease denotes the end of the summer half-year (a). Yushu is located at a higher altitude than Lulang (), but the Yushu station exhibits much higher δ18O values that the station at Lulang, contrary to the usual relation between increased altitude and δ18O depletion. This reflects the overwhelming effect of the monsoon in the southeastern TP vs. a weakened monsoon yielding to continental recycling as the monsoon progresses further inland.
Table 1. Mean and skewness of the inter-sampling time distributions, number of precipitation days, and amount-weighted δ18O during 2007, together with the altitudes of the four stations adopted in the comparative study
The leading of δ18O depletion at Yushu with respect to that at Lhasa further south infers the dominance of different sub-monsoonal systems at the respective stations, and confirms the predominance of the BOB monsoon over Yushu and the ISM over Lhasa, as the BOB monsoon has an earlier onset than the ISM (Wu and Zhang, Citation1998).
4.2. The EASM signal in δ18O at Xi'an
The daily time series of normalised δ18O at Xi'an for 2007 were compared with those from Guangzhou and Changsha (a and b), as these two other stations are dominated by the EASM (Yang et al., Citation2011, Citation2012). The Meiyu-Baiu is an important part of the EASM, and exerts a significant influence over the Yangtze River Valley in China during mid-June to mid-July in the form of an eastward-westward elongated rainband along 30–40°N (Wang and LinHo, Citation2002; Sampe and Xie, Citation2010). Yet, due to the huge land-sea thermal contrasts and the TP's orographic forcing (Wang and Linho, 2002), its onset time is different from the EASM's. A recent study has proposed that westerlies are ‘an important culprit’ for the Meiyu-Baiu, in addition to the low-level southerly winds that supply moisture over eastern China (Sampe and Xie, Citation2010). These distinctive moisture sources and transportation pathways may thus have a direct bearing on the variations in δ18O between different sites in central China.
Fig. 5 Daily times series of δ18O anomalies in 2007 at Xi'an (a), Guangzhou (b), and Changsha (c), and corresponding wind circulation strength at 850 hPa over East Asia (0–50°N, 100–140°E): U200-zonal wind at 200 hPa representative of the dominating zonal wind strength (Arkin, Citation1982; Ropelewski et al., Citation1992), and V850-meridional wind at 850 hPa indicative of the dominant meridional wind strength.
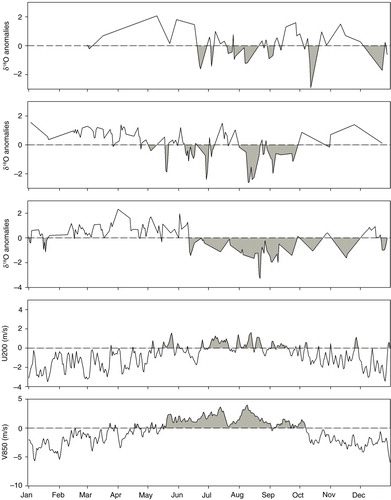
Our record shows far fewer precipitation days at Xi'an than at Guangzhou or Changsha throughout 2007, especially in the first half-year. In the second half-year, precipitation time series at all these three stations demonstrate synchronicity, and dramatic δ18O depletions all occur during May to September (a–c). Guangzhou witnesses the first significant negative anomalies in mid-May (b), when the raw δ18O value decreases by >8 ‰ on May 18 compared to the monthly weighted average for April; there are no negative anomalies at the other two stations in central and northern China. A corresponding zonal wind transits at 200 hPa from easterly to westerly (d), and a corresponding meridional wind transits at 850 hPa from northerly to southerly (e). The transition of the meridional wind at 850 hPa suggests intensification of the sea breeze over southeastern China in late spring, which is deflected to the northeast by the Coriolis effect such that the wind is from the southwest (a southwesterly wind). On the other hand, the strengthening of the westerly wind in the upper troposphere implies cooling air aloft and divergence, which will restrain (or inhibit) vertical ascent and the evolution of the southwesterly flow. Consequently, the southwesterly and the associated oceanic evaporation are confined to the southeastern coast of China.
In June, the daily series of δ18O anomalies show apparent depletions at all three stations, which is coincident with high-level easterlies and an intensification of low-level southerlies. With negative δ18O anomalies in the monsoon domain associated with deep convection under the summer monsoon influence, the later emergence and shorter duration of such negative δ18O anomalies from the south (Guangzhou) to the north (Xi'an) (a–c) implies a later start and earlier termination of the monsoon dominance. As the moisture evaporated from the ocean is transported from the coastal region inland with the evolution of the monsoon, the variation in the negative δ18O anomalies reflects the northward progression of the monsoon circulation, thus confirming the northward transport of oceanically derived water vapour. As the Meiyu-Baiu front envelopes during July in response to the northward shift of the North Pacific subtropical high axis across central China, the upper-level zonal wind turns westerly again (d). The subsequent coupling with the prevailing southerly (e) results in strong convection over the Yangtze River Valley, leading to the most intensive negative δ18O anomalies exhibited at Changsha (c). As the Meiyu-Baiu weakens further northward, negative δ18O anomalies turn distinctive at Xi'an only in late July (a). In comparison, there is no distinctive depletion of precipitation δ18O (i.e. no negative anomalies) at Guangzhou during the contemporary period (b), indicating no Meiyu-Baiu influence over Guangzhou. This is understandable, as Guangzhou is located in the tropical zone, while the Meiyu-Baiu rainband is a subtropical weather system (Sampe and Xie, Citation2010).
Large-scale negative δ18O anomalies in August are again present at all three stations, with a shorter duration and less intensity at Xi'an than at the other two stations. The most intense δ18O depletion occurs at Changsha on August 21–22 (~13 ‰ lower than the monthly weighted average for April), coinciding with the mid-August depletion at Guangzhou. Wind circulation patterns show the coexistence of prevailing southerly winds with a fluctuating westerly jet (d and e), suggesting the termination of the Meiyu-Baiu rainband and a recovery in the marine vapour intrusion from the adjoining ocean. The rain-bearing cloud system loses much of its original strength before reaching northern China (Tao and Ding, Citation1981), producing only moderate precipitation amounts following its interaction with local evaporation, leading to comparatively less depleted δ18O values () and comparatively higher d-excess values at Xi'an (figure not shown).
4.3. Post-monsoonal depletion in northern China and possible moisture sources
Except for the similar seasonality as mentioned in Section 3.1, our data at Xi'an show one noticeable difference from the GNIP data as in the post-monsoon depletion (). Comparison of the mostly complete GNIP data (1985 through 1987; 1989 through 1991) and our data (2006 through 2008) reveals that temperature from October to November consistently drops in both dataset, which suggests that temperature is unlikely to be the cause for the difference in the δ18O variations during the post-monsoon season. In the GNIP dataset (covering 1985–1992), there is little consistent correspondence between isotopic depletion and/or enrichment relative to the amount of monthly precipitation (a and b), although there are a few exceptions (e.g. July 1989). In our data set (2006–2009), there are extremely low δ18O values in October and/or November (c, shading), even during months with very low precipitation (e.g. November 2006 and 2009).
Fig. 6 Monthly variation of δ18O, precipitation amount and temperature in the GNIP dataset (a, b) and our dataset (c). Yellow bars highlight October and November in each year.
To further identify atmospheric circulations responsible for the post-monsoon depletion at Xi'an in recent decade, a trajectory for precipitation days in October to November (for 2006–2009, inclusive) was calculated in an attempt to trace possible moisture sources. Application of the moisture back-trajectory method to post-monsoonal precipitation at Xi'an during October and November reveals five major trajectories (a). Of these, 31 % of the total atmospheric moisture is from local source, leaving ~36 % jointly supplied by easterlies and southerlies, in comparison to 33 % supplied jointly by westerlies and northerlies. The divergence in the water vapour flux allows a clear delineation of water vapour distribution patterns and helps isolate water vapour sources and sinks.
Fig. 7 Atmospheric circulation patterns over East Asia during selected months. (a) Clustered moisture back-trajectory for October and November in 2006–2007 at Xi'an. (b1–b3) Vertically integrated water vapour flux (vector) from the surface to 0 hPa superimposed by the total divergence of water vapour flux (shaded) during November in 2006, October in 2007 and November in 2009 when the most depleted δ18O occur that year. (c1–c3) 850-hPa wind circulation together with OLR during those months. Numbers on the upper left corner of each panel show the month for the circulation map.
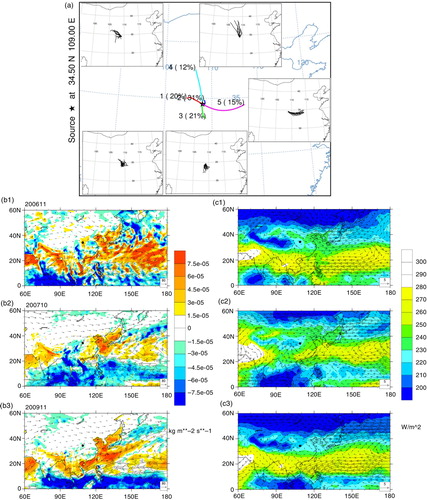
Vertical integral of monthly mean water vapour flux over Xi'an for 3 months, that is, November of 2006 and 2009 and October of 2007, features prevailing moisture transport from the west and northwest (b1–b3). The westerly and northwesterly moisture flux is small, but coexists with noticeable divergence over the site (b1–b3), thus implying possible involvement of local processes. Meanwhile, the 850-hPa wind field circulation for months witnessing the most depleted δ18O values in respective year shows the forcing from the northwesterly and/or southeasterly, the former originated from regions of very low OLR while the latter from those of comparatively high OLR (c1–c3). The southward shift of the insolation in autumn leads to the southward displacement of the Inter-Tropical Convergence Zone (ITCZ), making way for the recovering Siberian–Mongolian High. This produces a southward intrusion of cold air from northern Asia, contributing to low temperatures of the entire atmospheric column. With easterlies bringing comparatively warm air to the Xi'an site from the oceanic area, confrontation of the cold westerlies and warm easterlies results in riding of the cold air over the warm one, which would produce active disturbance. Such a disturbance will integrate local water sources, which, through weak evaporation, join the mixing of the vapour in the atmospheric water column.
The interaction of those three moisture sources increases the moisture availability at Xi'an, while the generally low temperature of the entire atmospheric water column enables condensation and precipitation formation at low temperatures, and therefore low δ18O in precipitation. Moreover, since 2/3 of the available water vapour for local precipitation is from long-distance transportation, it would lead to further depletion of δ18O, and result in extremely low values in northern China in October and November.
Meteorological study of atmospheric circulation during periods after the GNIP sampling project at Xi'an also demonstrates a clear enhancement in deep atmospheric convection in northern China in autumn (Sun and Oort, Citation1995). Such deep convection is suggested to be accompanied by cyclonic activity in the Korean Peninsula and Japan Sea, or even in the tropical Pacific Ocean. The accompaniment of cyclonic activity in the eastern oceanic area with a deep atmospheric convection is likely to amplify the warming over the east, thus enhancing the pressure gradient and inducing intensified intrusion of warm easterly from the East China Sea. The resultant convergence of the cold westerly and warm easterly air masses enhances the deep convection over Xi'an. Meanwhile, the combination of marine vapour from the east and local evaporation increases the mixing ratio, thus making condensation and precipitation formation in a relatively cold environment possible. As deep convection leads to a decrease in the condensation temperature for precipitation, it therefore is likely to result in very depleted δ18O at Xi'an during October–November. It is possible that documented changes in the atmospheric circulation over central and eastern China in recent decades due to recent large-scale climate changes (Niu et al., Citation2010; Inoue and Takahashi, Citation2013) may explain the emergence of post-monsoon δ18O depletion over Xi'an in our data (2006–2009) versus lack thereof in the older GNIP data (1985–1992).
5. Conclusions
Daily precipitation δ18O values over a 4-yr period in inland China are presented in this study in an attempt to analyse unique variations in the characteristics of stable oxygen isotopes and their association with atmospheric circulation and moisture trajectories in regions located on the margins of monsoonal influence. We first analysed variations in the ranges and amplitudes of δ18O in precipitation. It is clear that δ18O depletion at Xi'an between July and September is due to monsoonal precipitation, with the greatest depletion occurring during October to November; at Yushu, the findings exhibited a significant variability and appeared to be more related than Xi'an to local temperature. Correlation analysis with simultaneous major meteorological parameters found that local meteorological factors exerted much less control over δ18O values in precipitation during the monsoon season than during non-monsoonal seasons; this was true for both stations. The first finding is attributable to complex, monsoon-affected atmospheric circulation patterns, while the second is suggestive of variability in the different precipitation formation mechanisms associated with land surface processes and atmospheric circulation patterns. There is also a significant negative correlation between δ18O in precipitation and RH, suggesting an evaporative enrichment (i.e. increase in isotopic ratio with either evaporation from local surface, or secondary evaporation during precipitation, due to kinetic fraction effect) associated with local recycling, and thus a noticeable presence of continental recycling during the monsoon season.
δ18O values in precipitation at Yushu display a BOB monsoon signal; this signal is also reflected by the briefly depleted δ18O values found at the Delinghua station further north. The significant strength of the link between daily depleted δ18O values as yielded by lagged correlation analysis for different time series confirms that there is a lag between Yushu and Lulang of 15–25 d, suggesting that the progression of the BOB monsoon from the southeastern to northeastern TP lasts approximately between 10 d and 4 weeks. The δ18O depletion at Yushu leads that at Lhasa, implying different sub-monsoonal influences at respective stations, and confirming that it is the BOB monsoon, rather than the ISM, which influences Yushu. This is consistent with previous findings that the onset of the BOB monsoon begins earlier than that of the ISM.
Precipitation δ18O values for Xi'an exhibit an EASM signal during May to September, confirming its dominance by the mid-latitude monsoonal system. Xi'an's more northerly location also results in post-monsoonal depletion, different from other stations at the front of the EASM circulation. Back-trajectory analysis shows that local sources contribute about 1/3 of the total precipitation. Of the remaining 2/3 of the precipitation which originate via long-distance transportation, ~36 % arrives via the easterlies and southerlies and ~33 % arrives via the westerly and northerly flow. While the colder air from the west cools the atmospheric column, the comparatively warmer air from the east induces the relatively cooler air column to rise. The combined effect is that condensation occurs at lower temperatures and coupled with the long-distance transport of 2/3 of the available water vapour results in extremely low δ18O values in the post-monsoon precipitation that falls in northern China in October and November.
The high-resolution precipitation isotopic values for these marginal areas reveal different moisture sources and functioning atmospheric circulation systems, which in turn are responsive to global climate change. Nonetheless, continental recycling remains an important contributor to local precipitation rates at these margins. The intra-annual variations in the precipitation δ18O values elucidated here will contribute to a better understanding of the interplay between atmospheric circulation systems functioning over central China.
6. Acknowledgements
This work was supported by the Strategic Priority Research Program (B) of the CAS (Grant No. XDB03030201), the National Natural Science Foundation of China (Grant Nos. 41571074 and 41190081), the Chinese Academy of Sciences Youth Innovation Association and China Scholarship Council. The authors would like to acknowledge the National Meteorological Information Center for providing ground-based meteorological data in China. X. X. Yang is grateful to Profs. Ellen Mosley-Thompson and Peter Molnar for their valuable inputs. Gratitude is also extended to colleagues at the field observation stations for their responsible work.
References
- Adler R. F. , Huffman G. J. , Chang A. , Ferraro R. , Xie P. P. , co-authors . The version-2 global precipitation climatology project (GPCP) monthly precipitation analysis (1979–present). J. Hydrometeorol. 2003; 4: 1147–1167.
- An Z. S. , Wu G. X. , Li J. P. , Sun Y. B. , Liu Y. M. , co-authors . Global monsoon dynamics and climate change. Ann. Rev. Earth Planet. Sci. 2015; 43 , 29-77.
- Araguas-Araguas L. , Froehlich K. , Rozanski K . Stable isotope composition of precipitation over southeast Asia. J. Geophys. Res. Atmos. 1998; 103: 28721–28742.
- Arkin P. A . The relationship between interannual variability in the 200 Mb tropical wind-field and the Southern Oscillation. Mon. Weather. Rev. 1982; 110: 1393–1404.
- Bershaw J. , Penny S. M. , Garzione C. N . Stable isotopes of modern water across the Himalaya and eastern Tibetan Plateau: implications for estimates of paleoelevation and paleoclimate. J. Geophys. Res. Atmos. 2012; 117: 262–269.
- Bird B. W. , Polisar P. J. , Lei Y. B. , Thompson L. G. , Yao T. D. , co-authors . A Tibetan lake sediment record of Holocene Indian summer monsoon variability. Earth Planet. Sci. Lett. 2014; 399: 92–102.
- Breitenbach S. F. M. , Adkins J. F. , Meyer H. , Marwan N. , Kumar K. K. , co-authors . Strong influence of water vapor source dynamics on stable isotopes in precipitation observed in Southern Meghalaya, NE India. Earth Planet. Sci. Lett. 2010; 292: 212–220.
- Cai Y. J. , Fung I. Y. , Edwards R. L. , An Z. S. , Cheng H. , co-authors . Variability of stalagmite-inferred Indian monsoon precipitation over the past 252,000 y. Proc. Natl. Acad. Sci. U. S. A. 2015; 112: 2954–2959.
- Cheng H., Zhang P. Z., Spotl C., Edwards R. L., Cai Y. J., co-authors. The climatic cyclicity in semiarid-arid central Asia over the past 500,000 years. Geophys. Res. Lett. 2012; 39 L01705. DOI: http://dx.doi.org/10.1029/2011GL050202.
- Conroy J. L. , Overpeck J. T . Regionalization of present-day precipitation in the greater monsoon region of Asia. J. Clim. 2011; 24: 4073–4095.
- Dansgaard W . Stable isotopes in precipitation. Tellus. 1964; 16: 436–468.
- Gao Y. X. , Xu S. Y. , Guo Q. Y . Gao Y. X. , Xu S. Y. , Guo Q. Y . Monsoon regions and regional climate in China. Some problems of East Asian Monsoon. 1962; Beijing: Science Press. 49–63.
- Inoue M. , Takahashi M . Connections between the stratospheric quasi-biennial oscillation and tropospheric circulation over Asia in northern autumn. J. Geophys. Res. Atmos. 2013; 118: 10740–10753.
- Kalnay E. , Kanamitsu M. , Kistler R. , Collins W. , Deaven D. , co-authors . The NCEP/NCAR 40-year reanalysis project. Bull. Am. Meteorol. Soc. 1996; 77: 437–471.
- Latif M. , Keenlyside N. S . El Nino/Southern Oscillation response to global warming. Proc. Natl. Acad. Sci. U. S. A. 2009; 106: 20578–20583.
- Lee J. , Worden J. , Noone D. , Chae J. H. , Frankenberg C . Isotopic changes due to convective moistening of the lower troposphere associated with variations in the ENSO and IOD from 2005 to 2006. Tellus B. 2015; 67: 26177.
- LinHo , Wang B . The time-space structure of the Asian-Pacific summer monsoon: a fast annual cycle view. J. Clim. 2002; 15: 2001–2019.
- Malik N. , Marwan N. , Kurths J . Spatial structures and directionalities in monsoonal precipitation over South Asia. Nonlinear Proc. Geoph. 2010; 17: 371–381.
- Mao J. , Wu G . Interannual variability in the onset of the summer monsoon over the Eastern Bay of Bengal. Theor. Appl. Climatol. 2007; 89: 155–170.
- Niu F., Li Z. Q., Li C., Lee K. H., Wang M. Y. Increase of wintertime fog in China: potential impacts of weakening of the Eastern Asian monsoon circulation and increasing aerosol loading. J. Geophys. Res. Atmos. 2010. D00K20. DOI: http://dx.doi.org/10.1029/2009JD013484.
- Numaguti A . Origin and recycling processes of precipitating water over the Eurasian continent: experiments using an atmospheric general circulation model. J. Geophys. Res. Atmos. 1999; 104: 1957–1972.
- Quiroga R. Q. , Kreuz T. , Grassberger P . Event synchronization: a simple and fast method to measure synchronicity and time delay patterns. Phys. Rev. E. Stat. Nonlin. Soft Matter Phys. 2002; 66: 041904.
- Rehlfeld K. , Marwan N. , Heizig J. L. , Kurths J . Comparison of correlation analysis techniques for irregularly sampled time series. Nonlin. Processes Geophys. 2011; 18: 389–404.
- Rehfeld K. , Kurths J . Similarity estimators for irregular and age-uncertain time series. Clim. Past. 2014; 10: 107–122.
- Ren W. , Yao T. D. , Yang X. X. , Joswiak D. R . Implications of variations in delta O-18 and delta D in precipitation at Madoi in the eastern Tibetan Plateau. Quatern Int. 2013; 313: 56–61.
- Rheinwalt A., Marwan N., Kurths J., Werner P., Gerstengarbe F. W. Boundary effects in network measures of spatially embedded networks. EPL-Europhys. Lett. 2012; 100 28002. DOI: http://dx.doi.org/10.1029/0295-5075/100/28002.
- Risi C., Bony S., Vimeux F., Frankenberg C., Noone D., co-authors. Understanding the Sahelian water budget through the isotopic composition of water vapor and precipitation. J. Geophys. Res. Atmos. 2010; 115 D24110. DOI: http://dx.doi.org/10.1029/2010JD014690.
- Ropelewski C. F. , Halpert M. S. , Wang X. L . Observed tropospheric biennial variability and its relationship to the southern oscillation. J. Clim. 1992; 5: 594–614.
- Sampe T. , Xie S. P . Large-scale dynamics of the Meiyu-Baiu rainband: environmental forcing by the westerly jet. J Clim. 2010; 23: 113–134.
- Sun D. Z. , Oort A. H . Humidity-temperature relationships in the tropical troposphere. J. Clim. 1995; 8: 1974–1987.
- Tao S. Y. , Ding Y. H . Observational evidence of the influence of the Qinghai-Xizang (Tibet) Plateau on the occurrence of heavy rain and severe convective storms in China. Bull. Am. Meteorol. Soc. 1981; 62: 23–30.
- Tian L. , Masson-Delmotte V. , Stievenard M. , Yao T. , Jouzel J . Tibetan Plateau summer monsoon northward extent revealed by measurements of water stable isotopes. J. Geophys. Res. Atmos. 2001; 106: 28081–28088.
- Tian L. D. , Ma L. L. , Yu W. S. , Liu Z. F. , Yin C. L. , co-authors . Seasonal variations of stable isotope in precipitation and moisture transport at Yushu, eastern Tibetan Plateau. Sci. China Ser. D. 2008; 51: 1121–1128.
- Tian L. D. , Yao T. D. , MacClune K. , White J. W. C. , Schilla A. , co-authors . Stable isotopic variations in west China: a consideration of moisture sources. J. Geophys. Res. Atmos. 2007; 112: 12.
- Tian L. , Yao T. , Schuster P. F. , White J. W. C. , Ichiyanagi K. , co-authors . Oxygen-18 concentrations in recent precipitation and ice cores on the Tibetan Plateau. J. Geophys. Res. Atmos. 2003; 108: 10.
- Vuille M. , Werner M. , Bradley R. S. , Keimig F . Stable isotopes in precipitation in the Asian monsoon region. J. Geophys. Res. Atmos. 2005; 110: 15.
- Wang B. , LinHo . Rainy season of the Asian-Pacific summer monsoon. J. Clim. 2002; 15: 386–398.
- Wang B. , Wu Z. W. , Li J. P. , Liu J. , Chang C. P. , co-authors . How to measure the strength of the East Asian summer monsoon. J. Clim. 2008; 21: 4449–4463.
- Wilks D. S . Statistical methods in the atmospheric sciences. 2006; San Diego, USA: Academic Press. 627.
- Wu G. X. , Guan Y. , Liu Y. M. , Yan J. H. , Mao J. Y . Air-sea interaction and formation of the Asian summer monsoon onset vortex over the Bay of Bengal. Clim. Dynam. 2012; 38: 261–279.
- Wu G. X. , Zhang Y. S . Tibetan Plateau forcing and the timing of the monsoon onset over South Asia and the South China sea. Mon. Weather Rev. 1998; 126: 913–927.
- Wushiki H . Isotope hydrological features of the Tarim Basin, China. Proceedings of the Japan-China International Symposium on the Study of the Mechanism of Desertification. 1993; Tsukuba. March 2–4, 1993, p. 380ff. + Annexes..
- Xu B. Q. , Cao J. J. , Hansen J. , Yao T. D. , Joswia D. R. , co-authors . Black soot and the survival of Tibetan glaciers. Proc. Natl. Acad. Sci. U. S. A. 2009; 106: 22114–22118.
- Yang M. X. , Yao T. D. , Wang H. J. , Tian L. D. , Gou X. H . Estimating the criterion for determining water vapour sources of summer precipitation on the northern Tibetan Plateau. Hydrol. Process. 2006; 20: 505–513.
- Yang X. X. , Yao T. D. , Yang W. L. , Xu B. Q. , He Y. , co-authors . Isotopic signal of earlier summer monsoon onset in the Bay of Bengal. J. Clim. 2012; 25: 2509–2516.
- Yang X. X., Yao T. D., Yang W. L., Yu W. S., Qu D. M. Co-existence of temperature and amount effects on precipitation delta O-18 in the Asian monsoon region. Geophys. Res. Lett. 2011; 38 L21809. DOI: http://dx.doi.org/10.1029/2011GL049353.
- Yu W. S. , Yao T. D. , Lewis S. , Tian L. D. , Ma Y. M. , co-authors . Stable oxygen isotope differences between the areas to the north and south of Qinling Mountains in China reveal different moisture sources. Int. J. Climatol. 2014; 34: 1760–1772.