
Abstract
This article investigates the feasibility of using spaceborne observations of aerosol optical thickness (AOT) derived with the Moderate Resolution Imaging Spectroradiometer (MODIS) for monitoring of fine particulate matter (PM2.5) in an environment of low aerosol loading. Previous studies of the AOT-to-PM2.5 relationship benefit from the large range of observed values. The Stockholm region features a comprehensive network of ground-based monitoring stations that generally show PM2.5 values <20 µg m−3. MODIS AOT at 555 nm is usually <0.20 and in good agreement with ground-based sun photometer observations in this region. We use MODIS Collection 5 AOT data with a horizontal resolution of 10 km×10 km and ground-based in-situ PM2.5 observations to derive an AOT-to-PM2.5 relationship that can be used to estimate fields of PM2.5. This has been carried out with respect to the months from April to September of the period 2000–2013. Relative average absolute deviations of 33–55 % (mean of 45 %) are obtained between MODIS-retrieved and ground-based PM2.5. The root mean square error is 0.2159 µg m−3 between retrieved and measured PM2.5. From spaceborne lidar observations, it is found that elevated aerosol layers are generally sparse in the Stockholm region. This favours remote sensing of PM2.5 from space. The deviations found between measured and retrieved PM2.5 are mainly attributed to infrequent situations of inhomogeneous aerosol layering for which column-integrated observations cannot be connected to surface conditions. Using MODIS Collection 6 data with a resolution of 3 km×3 km in a case study actually gives far fewer results than the coarser Collection 5 product. This is explained by the complex geography of the Stockholm region with a coastline and an abundance of lakes, which seems to induce biases in the retrieval of AOT at higher spatial resolution.
1. Introduction
Exposure to particulate pollution is known to impact human health (Künzli et al., Citation2000; Anderson et al., Citation2012). Measurements of the concentration of aerosol particles with diameters smaller than 2.5 µm (PM2.5) is therefore of crucial importance for authorities to maintain air-quality standards and to restrict emissions of anthropogenic aerosols (WHO, Citation2005).
Spaceborne observations of aerosol optical thickness (AOT), as a measure of column aerosol loading, were found to have a great potential for regional monitoring of fine particulate pollution (Hutchison, Citation2003; Wang and Christopher, Citation2003; Engel-Cox et al., Citation2004). Al-Saadi et al. (Citation2005) and Zhang et al. (Citation2009) showed that PM2.5 as derived from AOT observations from space can be used to fill gaps in continental-scale air-quality monitoring networks. However, this is only valid in the absence of clouds (Christopher and Gupta, Citation2010) and when the column-integrated observations are representative for surface conditions (Crumeyrolle et al., Citation2014). Information on relative humidity (RH) and the presence of elevated aerosol layers from atmospheric modelling have been successfully used to improve the relationship between AOT and PM2.5 (Liu et al., Citation2005; Van Donkelaar et al., Citation2006). This allows for a global assessment of air quality based on spaceborne AOT observations (Van Donkelaar et al., Citation2010; Boys et al., Citation2014). A comprehensive overview on the topic of the retrieval of surface concentrations of PM2.5 is provided by Hoff and Christopher (Citation2009). The problems that arise are discussed in detail by Paciorek and Liu (Citation2009), Snider et al. (Citation2015) and Crumeyrolle et al. (Citation2014).
Relatively strong linear relationships have been found between AOT and PM2.5 in the studies given in the previous paragraph. However, it has also been shown that the slope of these relationships deviates from region to region as well as between different seasons and used satellite sensors. The majority of these studies have been carried out at locations that encounter a wide range of aerosol loading: from near 0 up to 100 µg m−3 (200 µg m−3 and higher when including Southeast Asia). So far, the use of spaceborne AOT for monitoring of surface PM2.5 has much been focused on the USA and China. Only few studies investigate the feasibility of monitoring particulate pollution in Europe (Kacenelenbogen et al., Citation2006; Pelletier et al., Citation2007; DiNicolantonio et al., Citation2009; Glantz et al., Citation2009; Schaap et al., Citation2009). Furthermore, little is known about the applicability of the AOT-to-PM2.5 relationship for rather clean conditions with a PM2.5 concentration lower than 20 µg m−3. Such low concentrations are usually observed in the Nordic countries (Tunved et al., Citation2003).
In this study, we intend to derive a relationship between AOT and PM2.5 that can be applied without additional information from complementary measurements or model data. In Section 2, we give an overview of the instruments used in this study. The methodology is explained in Section 3. The results are presented and discussed in Section 4. The article concludes with a summary in Section 5.
2. Instruments
We have used AOT observations from the Moderate Resolution Imaging Spectroradiometer (MODIS, Remer et al., Citation2005, Citation2008) aboard the Terra and Aqua satellites. MODIS AOT has been validated here against measurements carried out at four Swedish Aerosol Robotic Network (AERONET, Holben et al., Citation1998) sites before relating AOT to ground-based in-situ measurements of PM2.5. We have also used independent observations with the Cloud-Aerosol Lidar with Orthogonal Polarization (CALIOP) aboard the Cloud-Aerosol Lidar and Infrared Pathfinder Satellite Observations (CALIPSO) satellite (Winker et al., Citation2009) to get a general overview of the occurrence rate of clouds and elevated aerosol layers.
gives an overview of the locations, investigation areas and time periods for the satellite and ground-based observations used in this study. The locations of the ground sites and the areas considered for the spaceborne sensors are also presented in .
Fig. 1 Overview of the measurement sites and the region of interest for this study: AERONET stations (in red), in-situ stations (in green) and CALIPSO ground tracks (grey dashed lines) at distances of less than 250 km from the centre of Stockholm at 59.5°N, 18.0°E. The right side gives a close-up of the Stockholm region with the stations Aspvreten (ASP), Gustav Dalen Tower (GDT), Lilla Essingen (LES), Norr Malma (NOM), SMHI (SMHI), Torkel Knutssonsgatan (TKG) and Uppsala (UPP). The background shows the map of 555-nm AOT as observed by MODIS Aqua during an overpass at 1130 UTC on 22 September 2006. The black grids around the ground sites in the right plots illustrate the 3×3 pixel arrays used for the comparison of ground-based and spaceborne measurements.
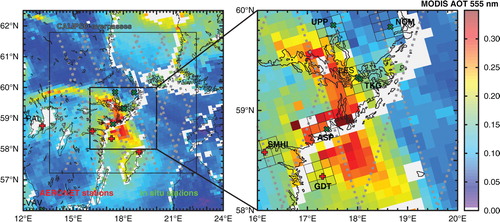
Table 1. In-situ and remote-sensing sites and satellite sensors, locations and areas, and time periods of the observations considered in this study
2.1. In-situ PM2.5 measurements
We utilise hourly dry PM2.5 that has been measured in-situ at the locations given in and . These sites are representative of rural (Aspvreten, Norr Malma and Vavihill) and urban background (Torkel Knutssonsgatan), and road site conditions (Lilla Essingen and Uppsala) (Gidhagen et al., Citation2004; Johansson et al., Citation2007). Vavihill in southern Sweden is frequently affected by continental aerosols from long-range transport. This site is used to provide a contrast to the Stockholm region located further north and therefore to a lesser degree influenced by long-range transport of man-made aerosols (Tunved et al., Citation2003; Glantz et al., Citation2009).
The present in-situ measurement stations use Tapered Element Oscillating Microbalance instruments (TEOM 1400a, Patashnick and Rupprecht, Citation1991) to monitor PM2.5 and PM10. To avoid condensing water, the instruments are operated at a temperature of 50 °C. To account for the resulting loss of volatile material, data were corrected following Areskoug (Citation2007).
Meteorological parameters (RH, wind speed and direction) are continuously measured at Aspvreten, Norr Malma and Torkel Knutssonsgatan. Data from the meteorological station Marsta are used in combination with aerosol measurements carried out at the Uppsala site. Marsta is located about 10 km to the north of Uppsala. The meteorological measurements at the surface are used as an indicator for the effect of RH on the AOT-to-PM2.5 relationships derived for the different sites.
2.2. MODIS AOT
In the framework of this study, we use MODIS Collection 5 AOT at 555 nm with a pixel resolution of 10 km×10 km at ground level at the centre of the swath with a width of 2330 km for both Terra and Aqua satellites (Remer et al., Citation2005, Citation2008). As given in , we used MODIS observations in the area from 55 to 61°N and from 12 to 21°E for the bright months from April to September during the time periods 2000–2013 (Terra) and 2002–2013 (Aqua), which corresponds to 8405 and 6468 overpasses, respectively. The necessity for clear-sky conditions adjacent to the ground sites leads to a subset of overpasses that can be used in this study. An overview of the number of those cases is provided in . It is worthwhile to note that MODIS Collection 6 provides 555-nm AOT with a higher spatial resolution of 3 km×3 km (Levy et al., Citation2013; Remer et al., Citation2013). The difference between MODIS Collection 5 and Collection 6 derived PM2.5 for our region of interest is addressed for a case study in Section 4.3.2.
Table 2. Number of MODIS overpasses for the different ground sites
gives an example of MODIS 555-nm AOT retrieved for an overpass at 1100 UTC on 22 September 2006. The pixel size at nadir is about 10×10 km2 and increases towards the edge of the satellite scene. This is due to the difference in viewing the angle of the satellite sensor. A region of pronounced AOT is visible in . While the ground-based measurements are able to catch the passing of this aerosol plume, the satellite scene is needed to reveal the spatial extent of the event.
2.3. AERONET sun photometer
Sun photometer measurements at four Swedish AERONET stations have been used to assess the accuracy of MODIS AOT in the Stockholm region. The AERONET Cimel instruments measure AOT at several wavelengths in the range from 340 to 1020 nm. We only use cloud-screened and quality-assured level 2.0 data. The stations Gotland, Gustav Dalen Tower, Pålgrunden and SMHI are shown as red crosses in . An overview of the locations of the ground sites and corresponding measurement periods is given in .
The instruments at Gustav Dalen Tower and Pålgrunden give AOT at 555 nm that can be directly compared to the MODIS Collection 5 Optical_Depth_Land_And_Ocean aerosol product. For measurements at Gotland and SMHI, AOT at 675 nm has been transformed to 555 nm using the Ångström exponent for the wavelength pair 440/675 nm that is provided by AERONET (Ångström, Citation1964). Pålgrunden is located at the shore of Lake Vättern. A large change in surface properties around this station is a challenge in aerosol retrievals from space, which explains the low number of useful MODIS observations for this site ().
2.4. CALIOP
Cloudiness is a major challenge in spaceborne aerosol observations (Christopher and Gupta, Citation2010). We have used spaceborne lidar observations to investigate the representativeness of MODIS AOT in the Stockholm region. Lidar observations are very sensitive to both clouds and aerosols and provide a height-resolved view of their occurrence in our region of interest. CALIOP is an elastic-backscatter lidar that emits linearly polarised laser light at 532 and 1064 nm. The instrument features three measurement channels and is operational since June 2006. An overview of the instrument and retrieval algorithms can be found in Winker et al. (Citation2009).
We only consider CALIOP observations within 250 km around the centre of Stockholm (59.5°N, 18.0°E). CALIPSO follows the Aqua satellite with a time delay of only 75 seconds. CALIOP is an active sensor and has a much smaller field of view (spatial coverage) than passive sensors. Therefore, it observes only a fraction of a MODIS Aqua scene. Nevertheless, considering data in the 8-yr time period from June 2006 to May 2014 provides us with a fair representation of the yearly variation in the occurrence rate of aerosol and cloud layers in the Stockholm region.
CALIPSO daytime observations in our region of interest are available on 6 d of the satellite's 16-d return cycle. We have used the level 2 version 3.01 (until October 2011) and 3.02 (from November 2011) aerosol layer and aerosol profile products. All data are provided with a vertical resolution of 30 m below 8.3 km height and 60 km between 8.3 and 20.2 km height and a horizontal resolution of 5 km. A detailed description of the CALIPSO lidar level 2 5-km cloud and aerosol profile products can be found in the CALIPSO Data User's Guide (Citation2015). No algorithm changes were introduced in the change from version 3.01 to 3.02.
3. Methodology and representativeness of the spaceborne observations
3.1. Methodology for relating spaceborne observations to measurements at ground
This study was performed in three stages. In the first stage, we validated MODIS 555-nm AOT against all available sun photometer measurements at the Swedish AERONET sites. In the second stage, we then matched MODIS AOT to PM2.5 measured at ground and used a subset (i.e. training data set) of these collated observations to derive AOT-to-PM2.5 relationships for spaceborne air-quality observations. In the third stage, the final AOT-to-PM2.5 relationship was assessed with the collated MODIS observations and in-situ measurements of particle mass concentration that have not been used to derive the relationship in the second stage.
Nine pixels adjacent to the location of a ground site are used for relating spaceborne to ground-based measurements. The latter have been averaged over 6 hours centred on the time of the corresponding satellite overpass to enable a fair comparison of areal and point measurements. We tested shorter (1 and 3 hours) and longer (12 and 24 hours) temporal averages. The former had little effect on the agreement between MODIS and AERONET AOT, while the latter blurred the comparison by relating MODIS snapshots to rather long time periods for which we cannot exclude changes in the state of the atmosphere. An individual MODIS Collection 5 AOT pixel located close to the ground track covers an area of about 10 km×10 km. With an average wind speed of 2.6±1.4 m s−1, as detected at the in-situ stations for the time period under investigation, it will take about 6 hours for an average air parcel to cross through the MODIS 3×3 pixel array used in this study.
Hence, 6-hour averages have been applied for relating the time series of both sun-photometer and in-situ PM2.5 measurements to a MODIS 3×3 pixel array with potential AOT values. visualises the location of the ground sites and the grids of nine pixels around each site. The availability of AOT pixels within these grids is related to cloudiness. Consequently, pixel availability is considered as a measure of data quality with higher numbers referring to a decreased influence of clouds and missing data (see, e.g. Section 2.3), and thus, more reliable data.
3.2. Representativeness of column-integrated spaceborne observations
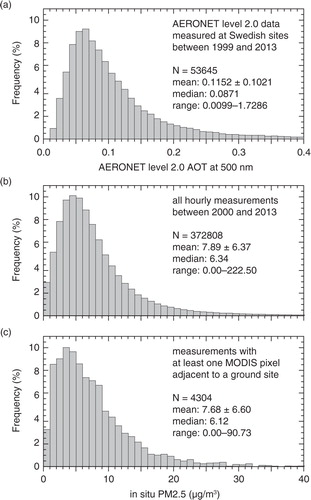
The aerosol loading in the Nordic countries is usually rather low. a shows that most values of 500-nm AOT measured at the Swedish AERONET sites between 1999 and 2013 are within a range from 0.02 to 0.20. The mean value of the PM2.5 distribution shown in b is 7.7±6.5 µg m−3, and only few values from hourly in-situ measurements between 2000 and 2013 exceed 20 µg m−3. The similar shape of the frequency distributions of AOT and PM2.5 shown in a and b suggests a connection between surface PM2.5 and column AOT. However, AOT is only measured during cloud-free conditions while PM2.5 measurements are not affected by cloudiness. In addition, the MODIS AOT observations we want to use in this study occur between 0900 and 1300 UTC, while in-situ measurements of particle mass concentration are performed throughout the day. c shows the frequency distribution of PM2.5 for observations that coincide with a MODIS overpass that provide at least one AOT value adjacent to a ground site. Only those cases can actually be used for relating MODIS AOT to particulate mass at the surface. Despite the strongly decreased number of cases, the shape of the frequency distribution still resembles the distribution of the AOT values fairly well.
Fig. 2 Frequency distributions of level 2.0 500-nm AOT measured at four Swedish AERONET sites (a), hourly PM2.5 concentrations measured at the considered stations in the Stockholm region for the entire data sets listed in (b) and for cases that coincide with MODIS overpasses with at least one AOT pixel adjacent to the respective ground sites (c). Numbers in the figure give the amount of cases, mean values with standard deviation, median values and the range of observed values.
a illustrates that cloud-free profiles only make up 20–40 % of the daytime CALIOP observations in the Stockholm region. This is the situation for which optical remote sensing from space is useful for air-quality monitoring, though aerosols are detected by CALIOP only for half of those cases (not shown). This is probably not due to the lower signal-to-noise ratio of CALIPSO daytime observations that can interfere with the detection of optically thin aerosol layers and the generally low AOT over the Stockholm region (see a). It is most likely that CALIOP observations that show an absence of both aerosols and clouds actually refer to situations in which the bulk of particles is located within the planetary boundary layer. Note that this is not considered to derive the numbers presented in b, and that the figure refers to the actually measured number of aerosol layers.
Fig. 3 Monthly resolved overview of the findings of noontime (1117–1157 UTC) CALIPSO overpasses the Stockholm region (250 km around 59.5°N, 18.0°E) in the 8-yr time period from June 2006 to May 2014. The occurrence rates of (a) cloudy and cloud-free lidar profiles and (b) the number of detected aerosol layers during cloud-free conditions are shown. The data were taken from 91 004 individual 5-km profiles provided in the 05kmAPro-Prov-V3-01/V3-02 products.
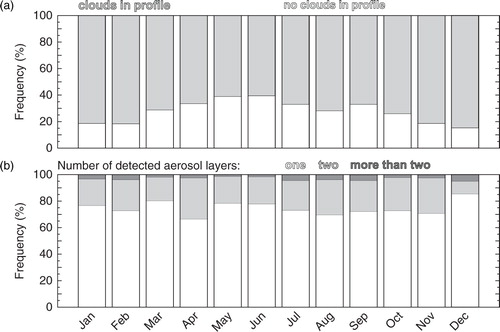
During the time period from April to September, 28–40 % of the observations with a polar-orbiting satellite sensor over the region of Stockholm are likely to be performed under cloud-free conditions. CALIPSO daytime observations in our region of interest are available only during 6 d of the satellite's 16-d return cycle. Therefore, we also derived a MODIS-based estimate for cloudiness as the ratio of cloud-free pixels to all pixels observed in the Stockholm region. We derive an occurrence rate of cloud-free conditions of 30 to 40 % for April to September. We also found that MODIS observations from the Terra late-morning overpass are generally less cloudy than those of the Aqua and CALIPSO noon overpasses. The relatively low estimate of potentially available MODIS AOT pixels for April to September as derived from daytime CALIPSO overpasses between 2006 and 2013 is thus in line with the statistics of MODIS Aqua and Terra observations during the time period from 2003 to 2013.
The occurrence rate of aerosol layers during cloud-free situations is shown in b. The majority of the CALIPSO aerosol observations were carried out in the presence of a single layer that was connected to the surface. Two aerosol layers were observed in 20–30 % of the cases. The occurrence rate of more than two aerosol layers is almost negligible. Ground-based observations with a Raman lidar, which was operated at Stockholm University between August 2010 and June 2014 (Baars et al., Citation2016), confirm that the presence of elevated aerosol layers is strongly related to extreme transport events: for example, European pollution, biomass-burning smoke from boreal fires and volcanic eruptions.
The lidar measurements have not been considered in obtaining an empirical AOT-to-PM2.5 relationship for the Stockholm region, as they do not extend over the entire time period of the PM2.5 and AOT observations. From the low occurrence rate of multiple aerosol layers, we conclude that additional information on the vertical aerosol distribution is not of vital importance for spaceborne PM2.5 observations in the Stockholm region.
4. Results
4.1. Validation of MODIS AOT
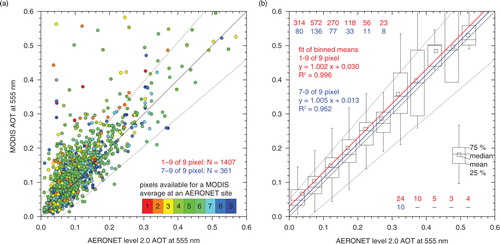
a presents matching pairs of AERONET and MODIS AOT. The colour coding indicates the number of available pixels in the 3×3 array around a ground site. Larger numbers correspond to smaller influence of cloud contamination on the mean AOT. lists the number of MODIS observations with AOT pixels adjacent to an AERONET station. This number is reduced when we are also requiring a coincident AERONET observation for the MODIS overpass, which would not be available, for example, under cloudy conditions or during instrument downtime. a shows that about 80 % (88 %) of the AOT pairs with at least one (seven) pixels around the ground site lie within the estimated uncertainty of the MODIS retrieval over land (±0.05±0.15×AOT). b presents the same data set with MODIS AOT averaged to bins of 0.05 regarding AERONET AOT. The majority of cases in are associated with AOT lower than 0.20. In addition, MODIS values are systematically higher than the ones from AERONET observations. This offset decreases from 0.03 to 0.01 as the number of available pixels increases. Hence, the deviation between satellite and ground-based observations can be explained by cloud effects. We conclude that MODIS AOT agrees relatively well with AERONET observations in the Stockholm region even though the aerosol loading is usually very low.
Fig. 4 Comparison of level 2.0 AOT at 555 nm as measured by the AERONET stations Gotland, Gustav Dalen Tower and SMHI and retrieved from MODIS overflights of the stations in the years 2000 to 2013. The time interval for the AERONET observations is ±3 hours around a MODIS overpass. The results are subdivided for (a) individual matches and (b) data binned 0.05 in AERONET AOT. The number of observations per AOT bin in (b) refers to the investigation of all data with observations adjacent to the ground sites (red) and only those with an availability of at least seven out of nine pixels (blue). Dotted black lines mark the expected uncertainty of ±0.05±0.15×AOT of the MODIS retrieval.
The root mean square error (RMSE), average absolute deviation (AAD) and relative AAD (AADrel) have been determined to assess the AOT comparison. The latter two parameters weight outliers to a smaller degree than the RMSE and are therefore more suitable for the validation of satellite retrievals of atmospheric parameters. The AAD and AADrel parameters are defined in Glantz and Tesche (Citation2012). presents a summary of the validation of MODIS against AERONET for different scenarios of pixel availability. Higher number of available satellite pixels around a ground site increases the reliability of MODIS AOT. The AAD (AADrel) decreases from 0.042 to 0.029 (from 34.8 to 25.9 %) when increasing pixel availability from 1 to 7 out of 9.
Table 3. Comparison of mean AOT and standard deviation from MODIS (AOTMOD) and AERONET (AOTAER) for different availability of pixels adjacent to a ground site and the number of available cases (N)
4.2. AOT-to-PM2.5 relationships
The numbers of MODIS AOT observations that coincide with ground-based PM2.5 measurements during the bright months April to September are given in the lower part of . To derive the AOT-to-PM2.5 relationship, we only use collated AOT/PM2.5 pairs associated with an availability of 3, 5 and 7 out of 9 MODIS AOT pixels adjacent to a ground site. This training data set makes up about one-quarter of the total matched observations. Ground-based PM2.5 values have been averaged within bins of 0.05 in AOT to obtain the resulting AOT-to-PM2.5 relationships. a shows the AOT-to-PM2.5 relationships obtained for the stations in the Stockholm region. While the initial offset is slightly smaller for Uppsala, all stations show a similar increase in PM2.5 with AOT. For most stations, the relationships are obtained for AOTs up to about 0.30. Fewer than 10 cases fall within larger AOT bins and lead to unreliable mean values, which have not been included in the analysis.
Fig. 5 AOT-to-PM2.5 relationships for (a) the individual in-situ sites listed in and (b) different months using the combined data from the stations in the Stockholm region.
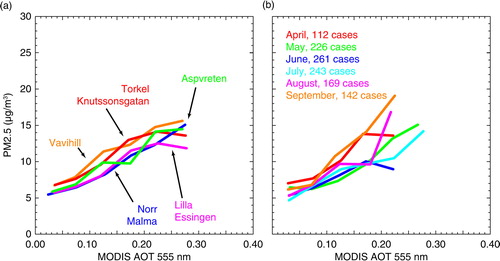
The monthly resolved relationships between PM2.5 and AOT shown in b have been derived by combining the observations at the different ground-based stations. The number of available cases per month is given in b and in . The months from April to August show a comparable slope with a minimum in July. September sticks out as it shows a more pronounced increase in PM2.5 with AOT. This suggests that a single AOT-to-PM2.5 relationship will be applicable for the larger part of the year with the exception of September.
Table 4. Monthly resolved number of available data points for the retrieval of AOT-to-PM2.5 relationships in the Stockholm region based on in-situ observations of particle mass concentration at ASP, LES, NOM, TKG and UPP
The relationships presented in all show a constant offset at zero AOT. This is unrealistic, since we find an abundance of very low PM2.5 values measured in the Stockholm region (c). shows mean, minimum and maximum fits of the AOT-to-PM2.5 relationship estimated for the Stockholm region. The mean fit is based on all coincident observations and is defined as:1
Fig. 6 Mean AOT-to-PM2.5 relationship (thick line) obtained for all stations in the Stockholm region (circles). The relationships to estimate lower and upper errors of the PM2.5 estimate are given by the dashed and dotted lines, respectively. The number of cases per AOT bin is given in the bottom of the figure.
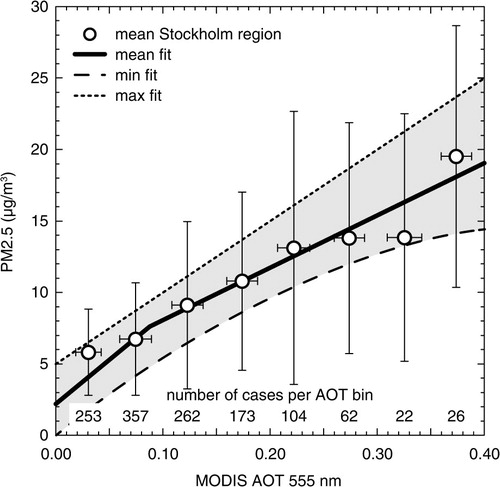
The linear fit changes at AOT lower than 0.09 to enable reproducing the smaller PM2.5 concentrations measured at the ground sites and to weaken the effect of an unphysical constant offset in deriving PM2.5 from spaceborne AOT observations.
Coinciding AOT/PM2.5 pairs have also been investigated with respect to different meteorological parameters observed at the ground sites. Humidity was found to have a stronger effect on the relationship between AOT and PM2.5 compared with wind speed and direction. The AOT-to-PM2.5 relationships estimated for cases with surface RH above 70 % (i.e. the median RH of all coinciding observations) are very similar (not shown) to the one for Vavihill (orange line in a). The one for cases with very low surface RH below 50 % resembles that of April (see and ). A linear fit of these data gives the maximum AOT-to-PM2.5 relationship as2
Table 5. Yearly and monthly resolved comparison of in-situ measured and MODIS-derived PM2.5 mass concentrations for all sites in the Stockholm region and for cases that have not been used for the retrieval of the AOT-to-PM2.5 relationships, that is, cases with a pixel coverage of 1, 2, 4, 6, 8 and 9 out of 9
The minimum AOT-to-PM2.5 relationship3
has been derived using the smallest values per AOT bin in and the constraint that an AOT of zero should – in principle – be associated with a PM2.5 concentration of zero. Equations (1–3) are used to derive surface PM2.5 concentrations and corresponding uncertainties from spaceborne AOT measurements in the Stockholm region.
4.3. Application and discussion
Spaceborne estimates of particulate pollution require cloud-free conditions (Christopher and Gupta, Citation2010). To assess and reduce the uncertainties of these estimates compared to ground-based observations, it is best to consider particularly extended periods of cloud-free conditions. High-pressure systems persisted over the Stockholm region in the summer of both 2006 and 2008. Observations during these summers are presented to demonstrate the feasibility of spaceborne monitoring of PM2.5 in the Stockholm region. We also investigate the use of MODIS Collection 6 data with a spatial resolution of 3 km×3 km for monitoring PM2.5 in the Stockholm region.
4.3.1. Summer 2006
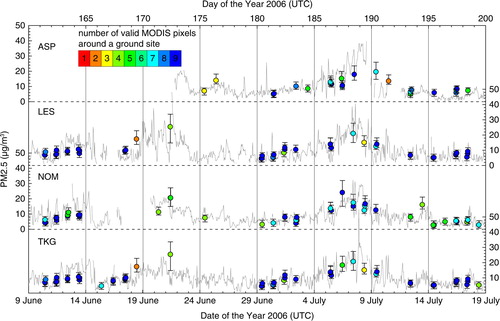
Time series of hourly PM2.5 measured at Asprvreten, Lilla Essingen, Norr Malma and Torkel Knutssonsgatan between 9 June and 19 July 2006 are presented in together with PM2.5 derived from MODIS AOT observations over these sites. High-pressure systems were present during the first 10 d and the second half of this period leading to mostly cloud-free conditions that enabled spaceborne PM2.5 monitoring. Low-pressure systems passed over the Stockholm region between 20 and 28 June 2006 and clouds interfered with the retrieval of AOT. This is reflected by both the number of MODIS observations and the availability of pixels adjacent to the ground sites for these observations. shows that PM2.5 exceeded the common background values of 5–10 µg m−3 between 19 and 23 June, and 4 and 10 July 2006. During these periods, the PM2.5 concentration occasionally increased up to 40 µg m−3. This is a very high value considering the region under investigation. shows that the MODIS-derived values of PM2.5 on the whole follow, although with a coarser temporal resolution, the shift between clean and polluted events that are consistently captured by all the present ground sites. The fixed satellite overpass times in combination with the swath width of the MODIS scene allow for at best three observations per day. This is not sufficient to reproduce the larger hour-to-hour variation that is resolved by the ground-based PM2.5 measurements. From the results shown in , 160 coincident cases with MODIS-derived and in-situ measured PM2.5 give a RMSE of 1.62 µg m−3.
Fig. 7 Time series of hourly PM2.5 at the stations Aspvreten (ASP), Lilla Essingen (LES), Norr Malma (NOM) and Torkel Knutssonsgatan (TKG) for the time period from 9 June 2006 (DoY 160) to 19 July 2006 (DoY 200) as measured in-situ at the ground sites (black lines) and derived from MODIS observations (dots). The colour coding of the dots refers to the number of available MODIS pixels adjacent to a ground site.
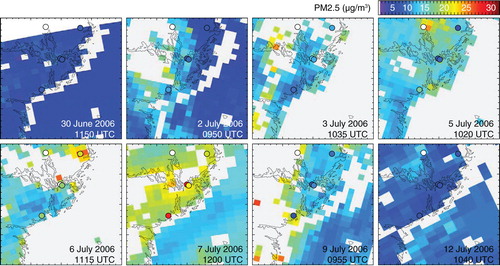
provides eight scenes of PM2.5 as obtained from MODIS observations within the period from 30 June to 12 July 2006. The scenes show increase in PM2.5 for the Stockholm region between 30 June and 7 July 2006. Lower concentrations are derived over the Baltic Sea and to the south of Aspvreten (see position in ), where no impact from local man-made sources is expected. AOT and PM2.5 began to decrease on 9 July [day of year (DoY) 190] leading to clean conditions comparable to the period before the pollution events. For 26 out of possible 32 comparison cases, satellite and ground-based PM25 agree within a difference below 20 %. In-situ measurements were not carried out at Uppsala during this period. On 9 July 2006, high PM2.5 is obtained from the MODIS AOT while low concentrations were measured at the ground site Aspvreten. There are two possible explanations for this discrepancy: clouds influencing the AOT retrieval and/or the presence of elevated aerosol layers above the boundary layer. The vicinity to a region of invalid pixels suggests the former to be the more likely explanation. With the exception of these few outliers, MODIS-derived PM2.5 values follow the results from the ground-based measurements.
Fig. 8 Satellite scenes of surface PM2.5 in the Stockholm region as obtained from MODIS observations during the time period from 30 June to 12 July 2006. Coloured dots mark the location of the ground sites and corresponding PM2.5 values. Late morning and noon overpasses refer to MODIS on Terra and Aqua, respectively.
4.3.2. Summer 2008
In the summer of 2008, a persistent high-pressure system reached from north of Iceland over Scandinavia to central Europe and western Russia. The period from 22 May to 8 June 2008 was mostly free of clouds over the Stockholm region. The favourable conditions for PM2.5 monitoring from space allow for a large number of AOT observations. Time series of measured hourly PM2.5 at Aspvreten, Lilla Essingen, Norr Malma and Torkel Knutssonsgatan and MODIS-retrieved mean PM2.5 values is shown in . The figure shows relatively small variation in PM2.5 during this time period, with values on the whole between 5 and 15 µg cm−3. This is typical for the region of Stockholm, which is only to a minor degree influenced by long-range transport events. With the exception of 1 June 2008, the MODIS-retrieved and in-situ PM2.5 agrees within 20 %. The favourable cloud-free conditions lead to high pixel coverage at Lilla Essingen, Norr Malma and Torkel Knutssonsgatan. For this time period, 165 comparisons give a RMSE of 1.34 µgm−3. The location of the Aspvreten station in close proximity to the Baltic Sea and the resulting coastline effects in the MODIS Collection 5 AOT scenes lead to the slightly lower pixel coverage for that site. This effect is visible in the PM2.5 scenes presented in and .
Fig. 9 Same as but for a time period from 22 May 2008 (DoY 143) to 10 June 2008 (DoY 162).
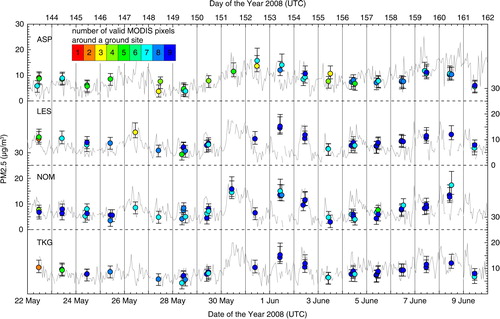
Fig. 10 Satellite scenes of surface PM2.5 in the Stockholm region as obtained by the AOT-to-PM2.5 relationship applied to MODIS observations on 1, 2, 5 and 6 June 2008. The PM2.5 scenes were derived from MODIS Collection 5 (upper row) and Collection 6 (lower row) AOT data. Coloured dots mark the location of the ground sites and corresponding in-situ PM2.5 values.
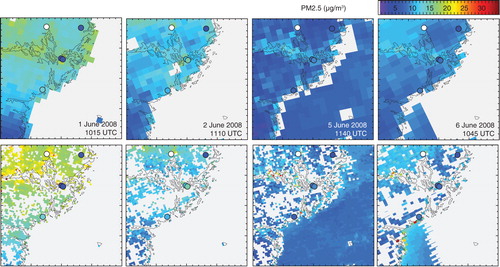
We used the MODIS Collection 6 (3 km×3 km) AOT product (Remer et al., Citation2013) to obtain better pixel coverage at the coast and for partly cloudy conditions (Chudnovsky et al., Citation2013; Munchak et al., Citation2013). This higher resolution product, therefore, has the potential to increase the number of collated AOT/PM observations as well as to allow for an improved resolution of small-scale features in the retrieved scenes of surface PM2.5. presents a comparison of surface PM2.5 scenes for 4 d in June 2008, as derived from MODIS Collections 5 and 6 AOT. The use of Collection 5 data leads to coherent PM2.5 scenes though with relatively coarse spatial resolution. The disadvantage with this collection is the improper representation of the coastline. As expected, Collection 6 AOT resolves fine features in the PM2.5 field. Both products show an absence of retrieved values over water on 1, 2 and 6 June 2008, even though the inspection of the visible composite shows clear-sky conditions in the current area. Almost no pixels are available over the city of Stockholm in the Collection 6 AOT product. This is likely due to the complex geography of Stockholm and the surrounding area: the archipelago in the east, lake Mälaren in the west and a general abundance of inland water bodies, which lead to pixels being removed as not appropriate for dark-target aerosol retrieval (Remer et al., 2013). In addition, the 3-km retrieval uses more aggressive tests for spatial variability of reflectance and normalised difference vegetation index to mask clouds and inland water bodies (Livingston et al., Citation2014). As a consequence, using Collection 6 actually reduces the number of collated AOT/PM2.5 pairs at the sites considered in this study. Geographic effects on the availability in AOT pixels should therefore be further investigated. Note that this problem did not arise in the study of Glantz et al. (Citation2009) when the non-operational but high-resolution Bremen AErosol Retrieval (BAER) algorithm was applied to MODIS and MEdium Resolution Imaging Spectrometer (MERIS) calibrated level 1 data (1 km and 300 m spatial resolution at ground, respectively) over the region of Stockholm.
4.4. General results and conclusions
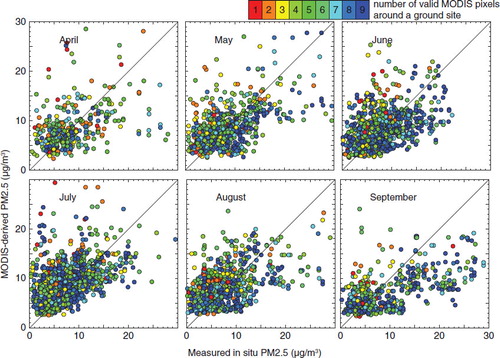
A comparison of MODIS-derived PM2.5 versus measured PM2.5 for different months during the time period 2000–2013 is presented in . The mean AOT-to-PM2.5 relationship described by eq. (1) provides the correct tendency for all months with the exception of September for which MODIS-derived PM2.5 estimates are lower than what is observed at ground. We intended to find a single AOT-to-PM2.5 relationship that can be applied to the majority of observations in the Stockholm region. But we conclude that the individual relationship derived for September () should be used to obtain improved agreement with surface observations during this month. Most of the differences between measured and retrieved PM2.5 for the month presented in are related to a small number of days that are associated with inhomogeneous aerosol conditions. These could be caused by elevated aerosol layers from long-range transport (for at most 20 % of cases, see ), strong vertical gradients in aerosol concentration in the lower troposphere or increased light extinction properties of the ambient aerosol under high RH (a factor we consider as minor for the majority of cases). The average AOT-to-PM2.5 relationship of eq. (1) might not be representative for these cases.
Fig. 11 Monthly correlations of PM2.5 as measured in-situ at ground and derived from MODIS observations in the years from 2000 to 2013. The number of observations per month is given in .
A yearly view of the statistics related to measured PM2.5 and the mean PM2.5 values derived with the single relationship [eq. (1)] is presented in . The underestimation in PM2.5 that occurs for 2002, 2004 and 2006 is related to a high amount of observations carried out in September that have not been treated according to the relationship presented in . Using this dedicated relationship for observations during September increases the MODIS estimated mean PM2.5 to 10.45±8.67 µg m−3 and decreases AAD (to 4.65), AADrel (to 43.55 %) and RMSE (to 0.5176) compared to the numbers provided in the lowermost line of . For the considered time period, mean values are 8.68±6.43 and 8.90±4.44 µg m−3 for ground-based and MODIS-derived PM2.5, respectively, with an RMSE of 0.2159 µg m−3 and AADrel of 45.11 %. For the individual months and years, AADrel varies between 30 and 40 %, while 55 % is found for 2004. The latter may be due to the smaller number of collated pairs (N=145) for 2004 compared to, for example, 2005 (N=416) and 2006 (N=481). RMSE varies between 0.1 and 3.0 µg m−3 for the different years. Omitting values corresponding to September gives a lower RMSE for all years with the exception of 2012 and 2013.
We conclude here that MODIS observations in the Stockholm region can be used to derive reasonable estimates of surface PM2.5 concentrations with a single relationship; particularly under periods of sustained cloud-free conditions. However, these observations cannot replace the long-term in-situ measurements of particle mass concentration at air-quality monitoring stations at ground. This is because of the rather coarse and varying temporal resolution (which depends on cloudiness), and the still too coarse spatial resolution of the operational MODIS products. We note that improved results can be derived with dedicated retrievals. By applying the BAER algorithm on MERIS calibrated level 1 data with a resolution of 300 m, Glantz et al. (Citation2009) showed that it is possible to obtain highly resolved AOT scenes over the Stockholm region. Such data enable the investigation of small-scale structures in urban regions and the identification of individual aerosol sources. Combining spaceborne PM2.5 measurements with dispersion modelling of aerosol mass confirms that particulate pollution from local road traffic in Stockholm can be detected from space (Glantz et al., Citation2009). Our plan for the future is to generate a composite time series of AOT from 1997 based on applying the BAER algorithm on high-resolution calibrated level 1 data from the Sea-viewing Wide Field Sensor (SeaWiFS), the Ocean Colour Land Instrument (OCLI) as well as from MERIS and MODIS. Those sensors provide good AOT statistics due to their large swath widths of 2.801, 1.270, 1.150 and 2.330 km, respectively. This effort includes the validation of BEAR AOT against ground-based remote sensing (Glantz and Tesche, Citation2012) before it can be used in climate and air-quality studies.
shows that some years are associated with favourable conditions for spaceborne retrievals of aerosol mass. While our single AOT-to-PM2.5 relationship gives reasonable results for most of the present cases, it is unclear how much of the uncertainties can be explained by differences in aerosol type (mass-scattering efficiency), aerosol heterogeneity, humidity and presence of clouds – all of which might vary from case to case (Li et al., Citation2015). Hence, dedicated campaigns (Crumeyrolle et al., Citation2014) and measurement networks (Snider et al., Citation2015) are necessary to further explore the potential of using satellite remote sensing for spaceborne monitoring of aerosol mass and particle-loading-related air quality.
5. Summary
A comparison of AOT derived from spaceborne MODIS observations with ground-based measurements carried out at Swedish AERONET sites shows good agreement, although MODIS tends to slightly overestimate the AOT in the considered region. This deviation is probably due to cloud effects. Based on satellite and ground-based in-situ observations performed in the time period from 2000 to 2013, we derived an AOT-to-PM2.5 relationship for low aerosol loading that is common for the Nordic countries. The corresponding estimates of PM2.5 have been compared to ground-based in-situ measurements in the Stockholm region that have not been part of the initial training data set. Previous satellite studies mostly present estimates of PM2.5 that are highly averaged in space and time. Here, we compare individual cases and present examples of time series of derived and measured PM2.5 for situations when persistent high-pressure systems over the investigation area led to extended periods of cloud-free conditions. This resulted in a large number of comparison cases for which the derived AOT-to-PM2.5 relationship has been evaluated.
It was found from spaceborne CALIPSO lidar observations that elevated aerosol layers associated with long-range transport events are rarely present in the Stockholm region. The same has been observed from aerosol lidar measurement at Stockholm, which were available between 2011 and 2014 (Baars et al., Citation2016). This is a factor that supports spaceborne monitoring of PM2.5 with passive sensors in our region of interest. Humidity can have a major effect on the AOT-to-PM2.5 relationship, though it has been found as less important than the presence of elevated aerosol layers (Crumeyrolle et al., Citation2014). The effect of humidity is generally low during clear-sky conditions (Crumeyrolle et al., Citation2014), as scenarios suitable for spaceborne particle monitoring in the Stockholm region are usually related to stable high-pressure periods. Increased RH is generally related to cloudiness, and measurements performed during such conditions form only a small part of the data set used in this study. On the whole, the example cases show relatively low spatial variability of PM2.5 within the region of Stockholm.
Including a lower number of AOT pixels in the averaging to the ground sites (red, yellow and green circles in and ) does not automatically result in worse agreement between satellite-derived and ground-based PM2.5. Neither does a full coverage of nine pixels adjacent to a ground site (blue circles in and ) give better agreement. As has been found in previous studies, clouds are the major factor in limiting the observational capabilities and inducing uncertainties in spaceborne aerosol remote sensing in the Stockholm region. Based on 8 and 11 yr of CALIPSO and MODIS (Aqua and Terra) data, respectively, only about 30–40 % of spaceborne observations between April and September are expected to be performed under clear-sky conditions that allow for column aerosol retrievals in the vicinity of CALIPSO's narrow footprint or a ground site. However, increased probability for clear-sky conditions is expected if all MODIS pixels within the region of Stockholm are considered. This holds particularly if combined data from both MODIS Aqua and Terra are used in the investigation. This is explained by the different overpass times for Aqua and Terra, and that each satellite can pass the investigation area twice during a day. Thus, due to advection of air masses and formation of cumulus clouds, the air column over a limited area can shift between cloud-free and cloudy conditions during the time period that these two satellites pass the investigation area (not shown).
Naturally, observations of polar-orbiting satellites only allow for poor temporal resolution compared to ground-based measurements. For instance, MODIS provides AOT observations for the Stockholm region only for overpasses between 0900 and 1300 local time. This may explain why such observations cannot always resolve the occasionally high values measured at the ground sites. Nevertheless, the MODIS-derived PM2.5 time series and scenes give a reasonable picture of the aerosol concentration and its development in the Stockholm region during, for example, the time periods presented in this study.
MODIS Collection 6 AOT data show a decreased availability of AOT pixels and less coherent AOT fields in our region of interest for a selected case study. Thus, the use of this product does not improve the spaceborne monitoring capabilities of PM2.5 in the Stockholm region. This is probably due to the abundance of lakes and coastlines in the region, which leads the retrieval to flag pixels as open water bodies, and thus, unsuitable for aerosol retrieval. Other studies have used 1 km×1 km MODIS AOT data derived with the MAIAC algorithm for air-quality studies (Chudnovsky et al., Citation2013). Future work in the Stockholm region will consider these data as well as high-resolution AOT derived from calibrated level 1 data of MODIS and MERIS using the BAER algorithm (Glantz et al., Citation2009).
6. Acknowledgements
We are grateful to the AERONET team and the PIs of the Swedish AERONET stations for their efforts in maintaining the respective sites. CALIPSO data used in this study were obtained from the NASA Langley Research Center Atmospheric Science Data Center (www.eosweb.larc.nasa.gov). We acknowledge the MODIS mission scientists and associated NASA personnel for the production of the data used in this research effort. This investigation was financed by Formas contract 216-2010-910. We also thank the colleagues at ACES and SLB for maintaining the in-situ instruments for particle mass concentration measurements at the stations used in this study.
References
- Al-Saadi J., Szykman J., Pierce R. B., Kittaka C., Neil D., co-authors. Improving national air quality forecasts with satellite aerosol observations. Bull. Am. Meteorol. Soc. 2005; 86: 1249–1261. DOI: http://dx.doi.org/10.1175/BAMS-86-9-1249.
- Anderson J. O. , Thundiyil J. G. , Stolbach A . Clearing the air: a review of the effects of particulate matter air pollution on human health. J. Med. Toxicol. 2012; 8: 166–175.
- Ångström A . The parameters of atmospheric turbidity. Tellus. 1964; 16: 64–75.
- Areskoug H . Bestämning av PM10 – En jämförelse av de vanligaste mätmetoderna använda i Sverige och den europeiska referensmetoden [Measurements of PM10 – A Comparison of the Most Common Methods Used in Sweden with the European Reference Method]. 2007; Stockholm, Sweden: Stockholm University (in Swedish),. ITM report 168.
- Baars H., Kanitz T., Engelmann R., Althausen D., Heese B., co-authors. An overview of the first decade of PollyNET: an emerging network of automated Raman-polarization lidars for continuous aerosol profiling. Atmos. Chem. Phys. 2016; 16: 5111–5137. DOI: http://dx.doi.org/10.5194/acp-16-5111-2016.
- Boys B. L., Martin R. V., Van Donkelaar A., MacDonell R. J., Hsu N. C., co-authors. Fifteen-year global time series of satellite-derived fine particulate matter. Environ. Sci. Technol. 2014; 48: 11109–11118. DOI: http://dx.doi.org/10.1021/es502113p.
- CALIPSO Data User's Guide. 2015. Online at: http://www-calipso.larc.nasa.gov/resources/calipso_users_guide/index.php.
- Chudnovsky A., Tang C., Lyapustin A., Wang Y., Schwartz J., co-authors. A critical assessment of high-resolution aerosol optical depth retrievals for fine particulate matter predictions. Atmos. Chem. Phys. 2013; 13: 10907–10917. DOI: http://dx.doi.org/10.5194/acp-13-10907-2013.
- Christopher S. A., Gupta P. Satellite remote sensing of particulate matter air quality: the cloud-cover problem. J. Air Waste Manag. Assoc. 2010; 60: 596–602. DOI: http://dx.doi.org/10.3155/1047-3289.60.5.596.
- Crumeyrolle S., Chen G., Ziemba L., Beyersdorf A., Thornhill L., co-authors. Factors that influence surface PM2.5 values inferred from satellite observations: perspective gained for the US Baltimore/Washington metropolitan area during DISCOVER-AQ. Atmos. Chem. Phys. 2014; 14: 2139–2153. DOI: http://dx.doi.org/10.5194/acp-14-2139-2014.
- DiNicolantonio W., Cacciari A., Tomasi C. Particulate matter at surface: Northern Italy monitoring based on satellite remote sensing, meteorological fields, and in-situ Samplings. IEEE J. Sel. Top. Appl. Earth Observ. Remote Sens. 2009; 2: 284–292. DOI: http://dx.doi.org/10.1109/JSTARS.2009.2033948.
- Engel-Cox J. A. , Holloman C. H. , Coutant B. W. , Hoff R. M . Qualitative and quantitative evaluation of MODIS satellite sensor data for regional and urban scale air quality. Atmos. Environ. 2004; 38: 2495–2509.
- Gidhagen L., Johansson C., Langner J., Olivares G. Simulation of NOx and ultrafine particles in a street canyon in Stockholm, Sweden. Atmos. Environ. 2004; 40: 2029–2044. DOI: http://dx.doi.org/10.1016/j.atmosenv.2004.02.014.
- Glantz P., Kokhanovsky A., Von Hoyningen-Huene W., Johansson C. Estimating PM2.5 over southern Sweden using space-borne optical measurements. Atmos. Environ. 2009; 43: 5838–5846. DOI: http://dx.doi.org/10.1016/j.atmosenv.2009.05.017.
- Glantz P., Tesche M. Assessment of two aerosol optical thickness retrieval algorithms applied to MODIS Aqua and Terra measurements in Europe. Atmos. Meas. Tech. 2012; 5: 1727–1740. DOI: http://dx.doi.org/10.5194/amt-5-1727-2012.
- Hoff R. M., Christopher S. A. Remote sensing of particulate pollution from space: have we reached the promised land?. J. Air Waste Manag. Assoc. 2009; 59: 645–675. DOI: http://dx.doi.org/10.3155/1047-3289.59.6.645.
- Holben B. N. , Eck T. F. , Slutsker I. , Tanré D. , Buis J. P. , co-authors . AERONET – a federated instrument network and data archive for aerosol characterization. Rem. Sens. Environ. 1998; 66: 1–16.
- Hutchison K. D . Applications of MODIS satellite data and products for monitoring air quality in the state of Texas. Atmos. Environ. 2003; 37: 2403–2412.
- Johansson C., Norman M., Gidhagen L. Spatial & temporal variations of PM10 and particle number concentrations in urban air. Environ. Monit. Assess. 2007; 127: 477–487. DOI: http://dx.doi.org/10.1007/s10661-006-9296-4.
- Kacenelenbogen M., Léon J.-F., Chiapello I., Tanré D. Characterization of aerosol pollution events in France using groundbased and POLDER-2 satellite data. Atmos. Chem. Phys. 2006; 6: 4843–4849. DOI: http://dx.doi.org/10.5194/acp-6-4843–2006.
- Künzli N., Kaiser R., Medina S., Studnicka M., Chanel O., co-authors. Public-health impact of outdoor and traffic-related air pollution: a European assessment. Lancet. 2000; 356: 795–801. DOI: http://dx.doi.org/10.1016/S0140-6736(00)02653-2.
- Levy R. C., Mattoo S., Munchak L. A., Remer L. A., Sayer A. M., co-authors. The collection 6 MODIS aerosol products over land and ocean. Atmos. Meas. Tech. 2013; 6: 2989–3034. DOI: http://dx.doi.org/10.5194/amt-6-2989-2013.
- Li J., Carlson B. E., Lacis A. A. How well do satellite AOD observations represent the spatial and temporal variability of PM2.5 concentration for the United States?. Atmos. Environ. 2015; 102: 260–273. DOI: http://dx.doi.org/10.1016/j.atmosenv.2014.12.010.
- Liu Y., Sarnat J. A., Kilaru V., Jacob D. J., Koutrakis P. Estimating ground-level PM 2.5 in the eastern United States using satellite remote sensing. Environ. Sci. Technol. 2005; 39: 3269–3278. DOI: http://dx.doi.org/10.1021/es049352m.
- Livingston J. M., Redemann J., Shinozuka Y., Johnson R., Russell P. B., co-authors. Comparison of MODIS 3 km and 10 km resolution aerosol optical depth retrievals over land with airborne sunphotometer measurements during ARCTAS summer 2008. Atmos. Chem. Phys. 2014; 14: 2015–2038. DOI: http://dx.doi.org/10.5194/acp-14-2015-2014.
- Munchak L. A., Levy R. C., Mattoo S., Remer L. A., Holben B. N., co-authors. MODIS 3 km aerosol product: applications over land in an urban/suburban region. Atmos. Meas. Tech. 2013; 6: 1747–1759. DOI: http://dx.doi.org/10.5194/amt-6-1747-2013.
- Paciorek C. J., Liu Y. Limitations of remotely sensed aerosol as a spatial proxy for fine particulate matter. Environ. Health Perspect. 2009; 117: 904–909. DOI: http://dx.doi.org/10.1289/ehp.0800360.
- Patashnick H. , Rupprecht E. G . Continuous PM-10 measurements using the tapered element oscillating microbalance. J. Air Waste Manag. Assoc. 1991; 41: 1079–1083.
- Pelletier B., Santer R., Vidot J. Retrieving of particulate matter from optical measurements: a semiparametric approach. J. Geophys. Res. 2007. ; 112 , D06208. DOI: http://dx.doi.org/10.1029/2005JD006737.
- Remer L. A., Kaufman Y. J., Tanré D., Mattoo S., Chu D. A., co-authors. The MODIS aerosol algorithm, products, and validation. J. Atmos. Sci. 2005; 62 , 947–973. DOI: http://dx.doi.org/10.1175/JAS3385.1.
- Remer L. A., Kleidman R. G., Levy R. C., Kaufman Y. J., Tanré D., co-authors. Global aerosol climatology from the MODIS satellite sensors. J. Geophys. Res. 2008; 113 , D14S07. DOI: http://dx.doi.org/10.1029/2007JD009661.
- Remer L. A., Mattoo S., Levy R. C., Munchak L. A. MODIS 3 km aerosol product: algorithm and global perspective. Atmos. Meas. Tech. 2013; 6: 1829–1844. DOI: http://dx.doi.org/10.5194/amt-6-1829-2013.
- Schaap M., Apituley A., Timmermans R. M. A., Koelemeijer R. B. A., de Leeuw G. Exploring the relation between aerosol optical depth and PM2.5 at Cabauw, the Netherlands. Atmos. Chem. Phys. 2009; 9: 909–925. DOI: http://dx.doi.org/10.5194/acp-9-909-2009.
- Snider G., Weagle C. L., Martin R. V., van Donkelaar A., Conrad K., co-authors. SPARTAN: a global network to evaluate and enhance satellite-based estimates of ground-level particulate matter for global health applications. Atmos. Meas. Tech. 2015; 8: 505–521. DOI: http://dx.doi.org/10.5194/amt-8-505-2015.
- Tunved P., Hansson H.-C., Kulmala M., Aalto P., Viisanen Y., co-authors. One year boundary layer aerosol size distribution data from five Nordic background stations. Atmos. Chem. Phys. 2003; 3: 2183–2205. DOI: http://dx.doi.org/10.5194/acp-3-2183-2003.
- Van Donkelaar A., Martin R. V., Brauer M., Kahn R., Levy R., co-authors. Global estimates of ambient fine particulate matter concentrations from satellite-based aerosol optical depth: development and application. Environ. Health Perspect. 2010; 118: 847–855. DOI: http://dx.doi.org/10.1289/ehp.0901623.
- Van Donkelaar A., Martin R. V., Park R. J. Estimating ground-level PM2.5 with aerosol optical depth determined from satellite remote sensing. J. Geophys. Res. 2006; 111 , D21201. DOI: http://dx.doi.org/10.1029/2005JD006996.
- Wang J., Christopher S. A. Intercomparison between satellite-derived aerosol optical thickness and PM2.5 mass: implications for air quality studies. Geophys. Res. Lett. 2003; 30 , 2095. DOI: http://dx.doi.org/10.1029/2003GL018174.
- Winker D. M. , Vaughan M. A. , Omar A. , Hu Y. , Powell K. A. , co-authors . Overview of the CALIPSO Mission and CALIOP data processing algorithms. J. Atmos. Oceanic Technol. 2009; 26: 2310–2323.
- World Health Organization (WHO). WHO Air Quality Guidelines for Particulate Matter, Ozone, Nitrogen Dioxide and Sulfur Dioxide. 2005; Geneva, Switzerland: WHO Press,. Global update 2005. Summary of risk assessment.
- Zhang H., Hoff R. M., Engel-Cox J. A. The relation between moderate resolution imaging spectroradiometer (MODIS) aerosol optical depth and PM2.5 over the United States: a geographical comparison by U.S. Environmental Protection Agency regions. J. Air Waste Manag. Assoc. 2009; 59: 1358–1369. DOI: http://dx.doi.org/10.3155/1047-3289.59.11.1358.