
Abstract
Ozone (O3) soundings have been performed on Easter Island or Rapa Nui (27 °S, 109 °W, 51 m a.s.l.) since 1994 as part of the Global Atmospheric Watch Programme of the World Meteorological Organization. In this work, we analyse 260 soundings compiled over the period 1994–2014, and make the data available for the international community. We characterise O3 profiles over this remote area of the Pacific by means of statistical analyses that consider, on the one hand, a traditional climatology that describes the data in terms of seasonal cycles based on monthly averages and, on the other hand, a process-oriented analysis based on self-organising maps. Our analyses show the influence of both tropical and subtropical/mid-latitude air masses at Rapa Nui. The former occurs in summer and fall when convective conditions prevail, and the latter in late winter and spring when subsiding conditions are recurrent. The occurrence of stratospheric intrusions in late winter and spring in connection with deep troughs and the presence of the subtropical jet stream is also apparent in the data set. The tropospheric ozone column is in good agreement with the corresponding data derived from satellites but with a systematic overestimate of summer and fall values. There is evidence of an upward trend in ozone near the surface, which suggests the impact of local pollution. We look forward to an enhancement of the Rapa Nui observing site, given its location that offers a privileged position to observe climate change over the sparsely sampled and vast South Pacific Ocean.
To access the supplementary material to this article, please see Supplementary files under ‘Article Tools’.
1. Introduction
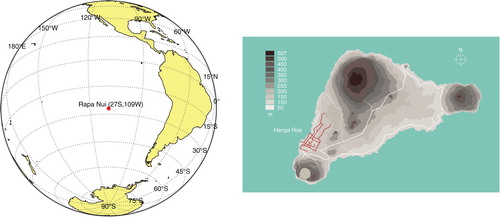
Easter Island, or Rapa Nui as known by the indigenous people and as denominated hereafter, is an extremely remote site, located some 3700 km away from continental Chile (see ). It has a unique cultural heritage as recognised since 1995 by the United Nations Educational, Scientific and Cultural Organization (UNESCO).
Fig. 1 Location (left) and main topographic features (right) of Rapa Nui or Easter Island. The right panel also shows the main roads (white) and the town of Hanga Roa in Rapa Nui (red).
Climatically, Rapa Nui is located at the eastern edge of the subtropical Pacific high pressure, north of the westerly winds and storm tracks of the Southern Hemisphere, and close to the South Pacific Convergence Zone (SPCZ) (Streten and Zillman, Citation1984; Vincent, Citation1994).
Currently, there are roughly 5500 inhabitants in Rapa Nui (www.ine.cl/), the majority of which live close to the airport in the town of Hanga Roa (Cf. ). The population is growing at a rather fast pace (ca. 2 %/yr), and more so tourism. More than 40 000 tourists visited the island in 2012, and the number of flights to the island from other Polynesian locations and from Santiago in Chile grew more than 10 % between 2011 and 2012. The number of motor vehicles in 2014 reached 2120 units, including 424 motorcycles, that is, an average of two vehicles every three inhabitants (www.ine.cl/). All this poses pressures to the already fragile socio-ecosystem of Rapa Nui.
Anthropogenic activities have substantially altered the composition of the atmosphere over the last centuries both regionally and globally. These changes have consequences on human health, ecosystems and the climate system (IPCC Citation2013). To assess, quantify and provide a basis for predicting these changes, the World Meteorological Organization (WMO) has established the Global Atmospheric Watch (GAW) programme. The GAW monitoring network consists of 29 fully equipped GAW stations, and ca. 500 regional stations, including contributing stations, that collect data on greenhouse gases, aerosols, precipitation chemistry, etc. As part of the sub-regional programme for the southern cone of South America, three stations were installed in Chile under the auspices of GAW and the Chilean Weather Office (In Spanish Dirección Meteorológica de Chile, DMC) by the mid-1990. Namely, an O3 sounding device on Rapa Nui (27 °S, 109 °W, 51 m a.s.l.); a surface O3 monitor, meteorological and radiation sensors at Cerro Tololo (30 °S, 70 °W, 2200 m a.s.l.) and a multiband radiometer at Valdivia (39.8 °S, 73 °W, 10 m a.s.l.). Unfortunately, the Valdivia station was destroyed in a fire in the mid-2000. Cerro Tololo and Rapa Nui have been kept in operation rather continuously since the mid-1990s, approaching today a 20-yr record each. Moreover, Cerro Tololo has been expanded. Presently, methane, carbon dioxide, carbon monoxide, radiation and aerosol monitors are operating there. Preliminary data compiled at Tololo and Valdivia have been partially investigated and reported in the peer-reviewed scientific literature (Gallardo et al., Citation2000; Lovengreen et al., Citation2000; Kalthoff et al., Citation2002; Rondanelli et al., Citation2002; Díaz et al., Citation2006; Huovinen et al., Citation2006).
In this work, we provide a data set with a complete statistical analysis of 260 O3 soundings, of which we deemed 234 to be valid, conducted on Rapa Nui over the period 1994–2014. First, we consider seasonal and interannual variability in tropospheric ozone. Comparisons are made with tropospheric ozone over several Pacific sounding stations in the Southern Hemisphere and at subtropical sites within the Southern Hemisphere ADditional OZonesondes (SHADOZ) network (Thompson et al., Citation2011; Thompson et al., Citation2012; Thompson et al., Citation2014). Second, a more process-oriented approach based on self-organising maps (SOM; Kohonen, Citation1995) is used with trajectories and meteorological fields to identify the underlying processes explaining the variability in ozone soundings (Diab et al., Citation2003; Jensen et al., Citation2012; Stauffer et al., Citation2016). The Rapa Nui data are also compared to satellite-derived estimates of the tropospheric ozone column (TOC) amount (Fishman et al., Citation2003; Ziemke et al., Citation2011; Tilmes et al., Citation2012).
This article is organised as follows. Section 2 describes the data collected at Rapa Nui since 1994, as well as ancillary data used for the analyses, and a brief description of the statistical tools applied. Results are presented in Section 3. Summary and conclusions are shown in Section 4.
2. Data and methods
2.1. Data
2.1.1. Ozone soundings
The data set collected between August 1994 and October 2014 by DMC consists of 260 O3 soundings. These soundings provide information on ozone, air pressure, temperature, dew point and relative humidity from the surface to the lower stratosphere (30–35 km). Since 1999, wind speed and direction were added to the collection. The first set of ozone soundings was conducted by the Chilean Weather Office under the auspices of the National Aeronautics and Space Administration (NASA) of the United States between August 1994 and June 1997. These data are available at World Ozone and Ultraviolet Radiation Data Centre (WOUDC, www.woudc.org/). Thereafter, data have been collected by the Chilean Weather Office and kept in their archives and presented in internal reports (Calderón and Fuenzalida, Citation2014) or in academic theses (Cuevas, Citation2004; Henríquez, Citation2014). The complete data set analyzed here is available at: www.cr2.cl/recursos-y-publicaciones/datos-ozonosonda/.
The O3 sensor used is the so-called electrochemical concentration cell (ECC) introduced in the late 1960s by Komhyr et al. (Citation1995). Currently, the ECC is used in the majority of GAW stations around the world (Smit et al., Citation2011). The measuring principle is based on the titration of ozone in a potassium iodide (KI) sensing solution. A Science Pump Corporation (SPC) type of ECC ozonesonde instrument is used at Rapa Nui. The sensing solution KI strength is 1 %, with 100 % buffer (G. Silva, station operator, pers. communication). The ECC sonde is launched with a Väisälä RS92 radiosonde. Between 1995 and 1997, an OS815N sensor was used, thereafter, a CCE64B was utilised.
We carried out a careful visual inspection of all soundings available for the period 1994–2014, that is, 260 soundings. Each sounding was reviewed trying to identify anomalous values, instrument malfunctioning, etc. We used concurrent standard meteorological soundings to support the inspection of ozone soundings. Since the inspection and selection procedures rely heavily on an expert judgement, we only excluded soundings that seemed to us evidently anomalous. The number of analysed and selected soundings per year and season are shown in and illustrated in . Of the collected valid soundings more than one third belong to the winter season, whereas only ca. 15 % of the soundings were sampled in summer. A detailed list of available soundings and reasons for not considering them is shown in the Supplementary File. The data set is also available at www.cr2.cl/recursos-y-publicaciones/datos-ozonosonda/. All in all, we deemed 234 or 90 % of the soundings as valid up to 15 km. Therefore, we focus our analysis up to 15 km. Once the cleansing and review process was completed, we linearly interpolated all soundings every 100 m. A few soundings (5) were only available for mandatory pressure levels in 2012.
Fig. 2 Seasonal and annual ozone sounding sampling at Rapa Nui between 1994 and 2014. The dashed black line shows the number of soundings launched per year. The continuous line indicates the number of valid soundings reaching up to 15 km altitude. The bars show the corresponding distribution per season.
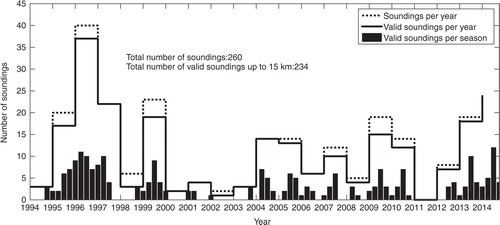
Table 1. Number of ozone soundings analysed in this study per year and season
2.1.2. Carbon monoxide
Carbon monoxide (CO) has been weekly sampled at Rapa Nui by the National Oceanic and Atmospheric Administration of the United States (NOAA) and their Earth System Research Laboratory (ESRL) since 1994 (Novelli, Citation2014). NOAA/ESRL CO is determined using gas chromatography plus hot mercuric oxide detection (Novelli et al., Citation2003). These data are available via the World Data Centre for Greenhouse Gases (WDCGG, www.ds.data.jma.go.jp/gmd/wdcgg/wdcgg.html) under GAW and the Carbon Cycle Surface Flasks project. We use these data to characterise anthropogenic impacts.
2.1.3. Beryllium isotopes
The beryllium isotope 7Be has been used as a tracer of stratosphere–troposphere exchange (Koch and Rind, Citation1998). This radionuclide is generated by the collision of high-energy particles from space with nitrogen atoms in the atmosphere. 7Be is readily attached to fine particles, and it has a half-life of 53 d. 7Be is measured on a routine basis at several places, including Rapa Nui. There is one data set collected by the Environmental Measurements Laboratory (EML, www.wipp.energy.gov/namp/emllegacy/index.htm) covering the period between 1971 and 1999. Another data set covers the period 2003–present, and corresponds to measurements performed by the Chilean Commission for Nuclear Energy (CCHEN, www.cchen.gob.cl/). We use the January 2009–July 2014 period for the CCHEN data set.
2.1.4. Tropospheric ozone column
We compare the TOC calculated from the Rapa Nui ozone soundings with two TOC climatologies. One corresponds to the 1979–2005 climatology derived from the Total Ozone Mapping Spectrometer (TOMS), and from the Solar Backscattered Ultraviolet (SBUV) instruments described in Fishman et al. (Citation2003). A more recent climatology is described by Ziemke et al. (Citation2011). In the latter, Aura Ozone Monitoring Instrument (OMI) and Microwave Limb Sounder (MLS) ozone measurements were used to estimate TOC, and it covers the period October 2004–December 2014.
2.1.5. Reanalysis data
We use reanalysis data sets from National Centers for Environmental Prediction/Atmospheric Research (NCEP/NCAR) (Kalnay et al., Citation1996) to characterise the large-scale meteorological features affecting Rapa Nui, as well as outgoing long wave radiation (OLR). Also, we use three-dimensional (3-D) wind fields to calculate 7-day back trajectories for each ozone sonde, every six hours. For this purpose, we apply the Hybrid Single Particle Lagrangian Integrated Trajectory (HYSPLIT) model (Draxler and Rolph, Citation2003).
2.2. Clustering methods
In addition to averaging data in time to construct a ‘standard’ climatology, we apply various unsupervised clustering techniques to analyse the data. The expectation is to identify data structures (clusters) that respond to the underlying physical processes. We used principal component analysis (PCA) (Jolliffe, Citation2014), k-means (MacQueen, Citation1967) and SOM (Kohonen, Citation1995) to classify ozone profiles from Rapa Nui. PCA is a technique that aims at reducing the dimensionality of a data set by finding unrelated or orthogonal principal components that represent, by a linear relationship, the original data and capture the majority of its variance (Jolliffe, 2014). The k-means method aims at finding an optimal partitioning – according to a given criterion – of a data set in ‘k’ clusters such that each class can be represented by a central (average) member in a group or class with minimum internal variance and maximum inter-group variance. One can use PCA to initialise k-means. Both PCA and k-means can be used to initialise the SOM method, which is in fact a stochastic generalisation of k-means. Recent studies have compared SOM and k-means for analysis of air-quality-related data (Salimi et al., Citation2014), and for ozone sonde climatologies (Stauffer et al., Citation2016).
We applied the above mentioned clustering techniques to all valid soundings (234) between 0.5 and 15 km. Results were similar among the different methods, and we decided to keep the most general one, that is, SOM. Thereafter, we computed back trajectories for all soundings in each group using HYSPLIT fed with NCEP/NCAR reanalysis data.
3. Results
3.1. Relevant meteorological features of Rapa Nui
Relevant features of the circulation over Rapa Nui have been briefly described in climatologies of the Southern Pacific Ocean (Streten and Zillman, Citation1984; Vincent, Citation1994). Also, the Chilean Weather Office collects meteorological data, including conventional soundings on a daily basis and reported annually (DMC, Citation2015).
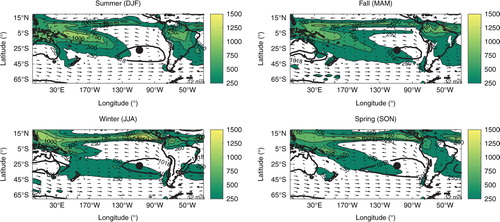
illustrates the year-around influence of the eastern edge of the Pacific high over Rapa Nui that leads to easterly and southeasterly boundary layer winds. Precipitation, also shown in , is generally convective (Schumacher and Houze, Citation2003), in connection with the nearness of the SPCZ (Vincent, Citation1994), and occasionally linked to mid-latitude disturbances and deep trough passages (Fuenzalida et al., Citation2005). The SPCZ is a persistent low-level convergence zone that results in a convective cloud band that produces abundant precipitation in the South Tropical Pacific Ocean during the austral summer, which extends from the warm pool east-southeastward to the central subtropical Pacific Ocean (about 30 °S, 130–110 °W). SPCZ plays a significant role not only in the regional atmospheric circulation but worldwide (Vincent, Citation1994; Vincent et al., Citation2011).
Fig. 3 Precipitation, boundary layer winds (at 925 hPa) and surface pressure affecting Rapa Nui. Rapa Nui (27°S, 109°W) is indicated by a black dot. Wind vectors are shown as arrows, including for reference the 12 m/s wind speed. The shaded field corresponds to precipitation in mm/season. The subtropical high is indicated by surface isobars larger than 1018 hPa. Data source: NCEP/NCAR reanalysis.
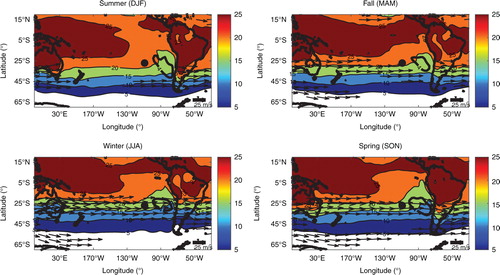
Another prominent circulation feature affecting Rapa Nui is the subtropical jet stream (STJ), and its variability along the year (Bals-Elsholz et al., Citation2001). The STJ is located at ca. 27°S, prevails between late fall and spring, with peaking wind speeds of ca. 35 m/s at 200 hPa in late winter. During summer, the STJ has the least influence over Rapa Nui. The main subsidence area associated with the subtropical high is located in between Rapa Nui and Western South America. The temperature seasonal cycle shows an amplitude of roughly 6 °C. In summer and fall, Rapa Nui has more of a tropical character with temperatures above 20 °C, while in winter and spring a mid-latitude character is apparent with temperatures below 18 °C. These features are depicted in .
Fig. 4 Subtropical jet stream, surface temperature and subsidence in the Pacific along the year. Arrows show wind velocity in excess of 25 m/s at 200 hPa. Surface temperatures in °C (at 1000 hPa) are also shown. The area with omega velocities in excess of 4 hPa/s, that is, regions of prevailing subsidence are indicated with a black line. The black dot indicates the location of Rapa Nui. Data: NCEP/NCAR Reanalysis.
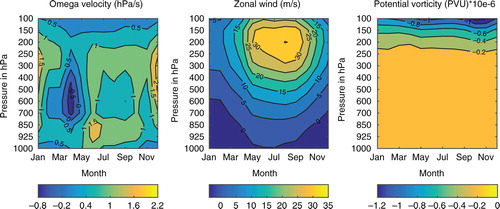
shows the seasonal cycle of subsidence–indicated by omega velocity, potential vorticity and zonal wind above Rapa Nui. Subsidence associated with the subtropical high peaks in summer, and it is suppressed in fall when the SPCZ reaches the island (Cf. and ). Although weaker than in summer, subsidence also prevails in winter and spring. The STJ remains stationary over the island between fall and spring. In late spring and early summer, potential vorticity in the upper troposphere (<200 hPa) shows its minimum, which is suggestive of a stratospheric imprint linked to the occurrence of stratosphere–troposphere exchange (STE) processes.
Fig. 5 Seasonal cycles of vertical velocity (in hPa/s, left panel), zonal wind (in m/s, middle panel) and potential vorticity (in PVU=10−6 m−2s−1K kg−1, right panel) over Rapa Nui. Data: NCEP/NCAR Reanalysis.
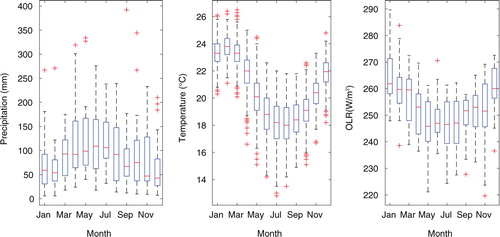
Annual precipitation at Rapa Nui amounts to 1157 mm (median for the period 1994–2014), with lowest values in spring and summer and with highest values in fall and winter (, left panel). There is a significant interannual variability both for the whole precipitation record (1960–2014) and the period of this ozone climatology (1994–2014). A convective signature, as shown in OLR seasonal cycle, is found along the year but it is particularly important in fall and winter (, right panel). The seasonal cycles of temperature and precipitation measured on the island as well as reanalysis OLR over Rapa Nui are presented in . All these variables show a significant interannual variability.
Fig. 6 Precipitation (in mm/month, left panel), surface temperature (in °C, middle panel) and outgoing long-wave radiation (OLR, in W/m2, right panel) climatologies over Rapa Nui for the period 1994–2014. Precipitation and temperature were obtained from the Chilean Weather Office. OLR values obtained from NCEP/NCAR reanalysis. Data are presented as box plots: the central mark in the box indicates the median of the distribution, the edges of the box are the 25th and 75th percentiles, the whiskers extend to the most extreme data points not considered outliers, and outliers are plotted individually (red crosses).
A substantial part of the variability referred to above is linked to changes in atmospheric circulation due to El Niño Southern Oscillation (ENSO) (Philander, 1989; Karoly, Citation1989). During El Niño (La Niña) events, the South Pacific high is weaker (stronger) and its centre displaced northward (southward), as well as the mid-latitude westerlies and the storm track. This means that, in particular, Rapa Nui can experience more southeasterly (northeasterly) surface winds during El Niño (La Niña) events. The SPCZ displaces to the northeast (southwest) during El Niño (La Niña) events causing changes in the precipitation regime. In the upper troposphere, the STJ is more intense with its jet streak displaced towards the east during El Niño, while during La Niña is weaker being the polar jet stream the one that intensifies (Chen et al., Citation1996). The same northeast (southwest) displacement of the SPCZ is observed during the positive (negative) phase of the Pacific Decadal Oscillation (PDO), influencing the island's climate in the decadal timescale (Folland et al., Citation2002). Of course, such changes have an impact on the dynamics and distribution of atmospheric tracers, tropospheric ozone in particular (Chandra et al., Citation1998; Zeng and Pyle, Citation2005; Ziemke et al., Citation2010; Oman et al., Citation2011; Xie et al., Citation2014; Ziemke et al., Citation2015).
3.2. Standard climatology
First, we present the seasonal cycle in tropospheric ozone, and specific humidity profiles monthly averaged at Rapa Nui (). A distinct layer with ozone mixing ratios in excess of 100 ppbv, characteristic of stratospheric air (chemical tropopause), is apparent all year-around. This layer is above ca. 14 km altitude in fall, and it reaches down to 12 km altitude in spring. This seasonal pattern is similar to the ozone at two other SHADOZ stations located between 20°S and 30°S, Irene and La Réunion (Thompson et al., Citation2014). In the middle and upper troposphere, minimum O3 mixing ratios are found in fall and maxima in spring.
Fig. 7 Seasonal cycles of ozone in ppbv (left) and specific humidity in g/kg (right) vertical profiles for the period 1994–2014. Isolines and colour codes are shown in the figure. The chemical tropopause, that is, 100 ppbv is indicated in the left panel by a coarse black line. For accuracy, specific humidity, which is derived from relative humidity measurements, is drawn only below 6 km.
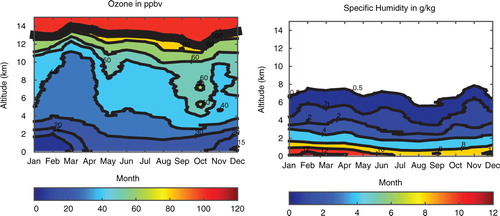
Minima in ozone occur in late summer and fall, when ozone of ca. 40 ppbv is well mixed up to 300 hPa, which might be interpreted as an effect of the SPCZ approaching Rapa Nui, and increasing deep and shallow convection as seen in OLR (Cf. ).
The well-mixed spring maximum of ozone in excess of 50 ppbv in the middle troposphere reaches down to 4 km altitude, and it is accompanied by a minimum in specific humidity. Furthermore, it coincides with the stratospheric imprint shown by the potential vorticity field (cf. ). This is suggestive, not definitive, of downward mixing of stratospheric air typically rich in ozone, poor in water vapour and with potential vorticity below −1.5 PVU. Several mechanisms may in fact explain the concurrence of high ozone low water in the upper troposphere in the tropical Pacific and the subtropics, including convective outflow associated with the Hadley circulation and mid-latitude disturbances transporting dry air towards the tropics (Galewsky et al., Citation2005; Waugh, Citation2005; Dessler and Minschwaner, Citation2007). On contrary, STE processes occur on an event basis that monthly averaged fields shown in Figs. (Citation3–Citation5) can hardly capture. Skerlak et al. (Citation2014) presented a 33-yr climatology of STE based on state of the art reanalysis and modelling tools. According to this study, STE shows a maximum at ca. 30°S in connection with the STJ. However, the resulting influx of stratospheric ozone is modulated by the seasonal variation in O3 mixing ratios at the tropopause, which for Rapa Nui shows highest values in winter and spring (Cf. ). This supports the idea of STE processes may be at play in spring over Rapa Nui.
Below 3 km, lowest (highest) ozone (humidity) values are found in summer, coinciding with highest insolation and lowest static stability defining a boundary layer reaching up to 3 km, mixing upwards marine air, typically rich in water vapour and poor in ozone. The rest of the year, the marine air is largely confined below 2 km.
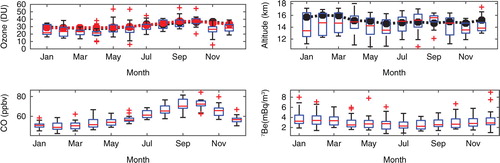
In , we show the seasonal cycle of the TOC (, upper left panel), and the thermal tropopause (TT, , upper right panel) as derived from the ozone sondes and satellite products over Rapa Nui for the period 1994–2014. Both the soundings and the satellite products indicate a spring maximum in TOC, consistent with ozone enrichment in the middle troposphere. Overall, OMI/MLS and TOMS/SBUV TOC values are within the variability observed in the Rapa Nui data with a positive bias between January and April, when vertical mixing is most vigorous. Correspondingly, OMI/MLS TT levels are in the upper end of the observed levels at Rapa Nui in summer and fall. In winter and spring, both TOC and TT are consistent between both data sets.
Fig. 8 The upper left panel shows the seasonal variation in tropospheric ozone column (TOC) in Dobson Units (DU=2.69×10¹⁶ ozone molecules per square cm). The upper right panel illustrates the thermal tropopause height (TT) in km. The lines indicate the corresponding climatologies derived from the OMI/MLS and the TOMS/SBUV satellite products (dashed lines) in black and red, respectively. The lower left panel shows the seasonal variation of carbon monoxide (CO) in ppbv and the lower right panel illustrates the seasonal variation of beryllium 7 radionuclide (7Bel) in mBq/m3 measured at Rapa Nui. These are the box plots of monthly averages using the same convention as in . Data sources: NOAA/ESRL/GMD (CO for the period 1994–2013); EML (7Be for the period 1971–1999); CCHEN (7Be for the period 2009–2014).
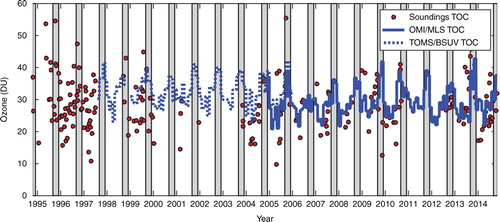
We also compare monthly TOC values derived from the satellite products (OMI/MLS and TOMS/SBUV) with TOC values calculated from individual soundings collected at Rapa Nui in . Typical sounding TOC values range between 10 and 45 DU, with a few values in excess of 45 DU. Sounding TOC values observed in summer and fall are typically below the annual median of 27 DU, whereas late winter and spring values are above the median. Satellite-based TOC values are systematically above sounding-derived TOC values in fall, that is, when convective conditions prevail and TOC is minimum. Spring maxima in TOC are better captured by the satellite products. These features are consistent with the prevailing weather conditions, that is, tropical conditions (convective) in late summer and fall, and subtropical conditions (subsidence) in late winter and spring. Also, the sounding TOC values in summer and fall are similar to those found in other islands in the Equatorial Pacific (Ziemke et al., Citation2011; Thompson et al., Citation2012). TOC values in late winter and spring are similar to subtropical stations although in the lower end of those.
Fig. 9 Tropospheric ozone column (TOC) as derived from individual soundings (red dots), and monthly averaged satellite products: TOMS/SBUV (blue dashed line) and OMI/MLS (blue continues line). The grey-dashed areas correspond to spring periods. TOMS/SBUV data were obtained from www.science.larc.nasa.gov/TOR/data.html. OMI/MLS data were downloaded from www.acd-ext.gsfc.nasa.gov/Data_services/cloud_slice/.
The ozone spring maximum observed at Rapa Nui in the middle and upper troposphere may also be linked to biomass burning. This is supported by the CO data collected at Rapa Nui that show a spring maximum that is consistent with the hemispheric impact of biomass burning in the Southern Hemisphere (see , left lower panel). In fact, biomass burning in the tropics of the Southern Hemisphere peaks in spring, and it has been shown to affect the ozone balance as derived from in situ measurements and satellite retrievals (Oltmans et al., Citation2001). Also, a recent modelling study identifies an indirect contribution of biomass burning to the surface levels of CO at Rapa Nui in spring (Wai et al., Citation2014), which is supported by available CO measurements (Thompson et al., Citation1996b; Oltmans et al., Citation2001; Fishman et al., Citation2003; Thompson et al., Citation2003; Ziemke et al., Citation2011). This is consistent with the notion that the effects of biomass burning are not discernible as individual transport events but as increased background values over the tropics and subtropics of the Southern Hemisphere. This is because the turnover time of O3 in the free-troposphere is long (~weeks) during which period long-range transport of photochemically produced O3 may very well take place.
It is worth noticing that available CO data show a significant interannual variability (not shown), and no evident trend associated with local changes in population and tourism. However, if any, such impacts might be masked by the frequency of data sampling.
At Rapa Nui, 7Be measured at the surface also shows a clear seasonal variation (, right lower panel). Maximum values are registered in summer and spring, when subsiding conditions prevail. Under such conditions, upper-tropospheric air rich in radionuclides can be mixed downwards. In winter, 7Be in the lower troposphere that diminishes as subsidence is lessened. In spring, a slight increase in 7Be coincides with an overall increase in ozone in the upper troposphere that may indicate STE and a negligible impact of this air in the boundary layer as found in modelling studies (Heikkilä et al., Citation2008; Heikkilä et al., Citation2013).
The features described above are similar to those presented for O3 sondes observations from other stations in the tropics and subtropics in the Southern Hemisphere. The STE features associated with the nearness of the STJ have also been described over subtropical stations such as Irene (25°S, 28°E) (Diab et al., Citation1996; Thompson et al., Citation1996a; Thompson et al., Citation2012) and La Réunion Island (21°S,55°E) (Baldy et al., Citation1996; Clain et al., Citation2009). Late summer and fall profiles characterised by convection in connection with the SPCZ are similar to those found in tropical stations such as San Cristóbal (1°S, 90W), Fiji (18°S,178E) in the South Pacific and Ascensión Island (8°S, 15°W) in the Equatorial Atlantic. A clear impact of biomass burning has also been shown for a number of tropical and subtropical stations.
Based on the monthly averages of sounding and reanalysis data, we can distinguish two extremes in the seasonality of ozone profiles over Rapa Nui: a convective or tropical regime in late summer and fall, and a subsiding or subtropical regime in late winter and spring (cf. ). However, when plotting individual soundings per season and the corresponding back trajectories starting at 4, 8 and 12 km altitude, we find a significant spread among soundings and trajectories to which it is hard to attribute-specific meteorological configurations, and source influences at play (not shown). In order to gain in further understanding of the processes, we adopted a clustering approach shown in the next subsection.
3.3. Clustering results using SOM
To verify the standard climatology, we applied the SOM technique. The expectation of the SOM classification was to find groups responding to the different underlying mechanisms discussed in the previous section. These mechanisms refer first to convective mixing in late summer and fall due to the proximity of the SPCZ, that is, ‘tropical conditions’. Second, they refer prevailing subsidence and STE events in the proximity of the STJ in spring, that is, ‘subtropical conditions’. A third mechanism is STE and downward mixing of O3-rich air in connection with deep troughs in winter and spring. And a fourth mechanism could be associated with downward transport of O3-rich air for which a biomass burning signature could be distinguished.
Selecting the number of clusters (k) or nodes using unsupervised methods such as k-means or SOM is not trivial and various methods can be used (e.g., Kodinariya and Makwana, Citation2013). Following Stauffer et al. (Citation2016), the choice of k must be enough to capture the variability of the data set while keeping enough cluster members to ensure geophysical meaning. In the case of Rapa Nui ozone soundings, for k=4 the rate of change of the ratio between inter- and intra-group variances approaches zero, and the number of cluster members is at least 15 % of the total population. We tested SOM imposing from two up to nine groups (not shown). The classification with two groups categorises ozone sondes according to prevailing summer and fall (178 members) versus winter and spring conditions (56 members). If soundings are forced to be classified within three groups, one can recognise a group linked to convective conditions (112 members), a group related to stratospheric intrusions (35 members) and a third group associated with ‘turbulent transport’ close to the STJ (87 members). However, the seasonal distribution is smeared out for the third group. When forcing the classification to five groups or more, the groups originally identified loose members, and the transport characteristics are shown more clearly but for smaller groups. Possibly, what happens is that particular weather situations and other influences become more apparent as the number of clusters is increased. Therefore, a classification in four groups appears as the adequate number of clusters for the Rapa Nui data, consistently with the seasonality of prevailing weather conditions and the number of profiles. Of course, if the number of soundings at Rapa Nui keeps growing, the robustness of all statistical analyses will increase. The results presented next correspond to randomly initialised SOM forcing four groups to all valid soundings between 0.5 and 15 km.
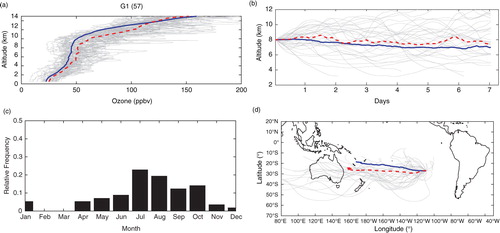
We found a first group (G1) with 57 members or ~24 % of the soundings, showing a central profile with larger values in the troposphere than the average or climatological profile of all soundings (see ). G1 profiles occur mainly in winter and spring months. Seven-day back trajectories suggest the prevalence of a zonal flow. Back trajectories arriving at 8 km altitude show a zonal component, and air masses of mid- to upper-tropospheric origin. This is consistent with the close location of the STJ, giving rise to turbulent mixing of stratospheric air, which is subsequently transported down by the prevailing subsiding conditions. However, one can identify cases of deep troughs and air masses of tropical origin. Liu et al. (Citation2016) characterised the interplay of pollution and STE impacts in La Réunion sondes (1992–2014). The latter were quite variable, depending on the location of the STJ in a given year.
Fig. 10 Ozone profiles (upper left panel), seasonality (lower left panel) and vertical (upper right panel) and horizontal (lower right panel) trajectories for group 1 (G1) according to SOM classification of Rapa Nui ozone soundings. The average of all soundings (trajectories) is indicated by the continuous blue line, and the cluster average is shown by the dashed red line. Individual profiles (trajectories) are shown in grey. Trajectories were calculated using HYSPLIT fed with NCEP/NCAR reanalysis data.
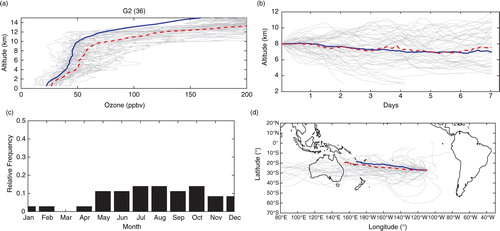
The second group (G2) contains only 36 soundings or 15 % of all soundings, the majority in winter and spring, and with values well in excess of the average sounding, particularly in the upper troposphere (See ). Backward trajectories provide evidence for the influence of mid-latitude disturbances, particularly deep troughs, affecting the island (Fuenzalida et al., Citation2005). Under such conditions, stratospheric air intrusions occur either close to the island or upwind from it, as suggested by roughly half of the backward trajectories for this group.
Fig. 11 As in but for group 2 (G2).
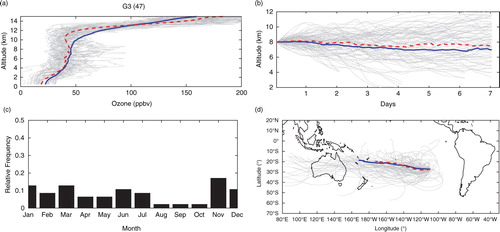
The third group (G3) contains 47 members, and it has a central member very similar to the average or ‘climatological’ profile, except close to the tropopause where values are below the average (see ). These profiles occur all year-around but less frequently in spring when subsidence is strongest. The majority of trajectories indicate air masses of mid-tropospheric origin, and in connection with mid-latitude disturbances.
Fig. 12 As in but for group 3 (G3).
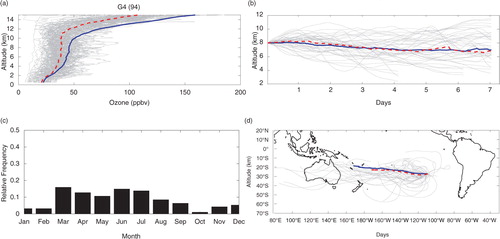
The fourth group (G4) contains 94 members or 40 % of the soundings, occurring mainly in fall and winter months (See ). The central profile of this group shows lower values than the climatological profile in the troposphere. They appear to follow convective conditions that mix boundary layer air into the upper troposphere in fall and winter. The majority of the corresponding backward trajectories originate in the tropical Pacific, and many of them appear as uplifted air masses.
Fig. 13 As in but for group 4 (G4).
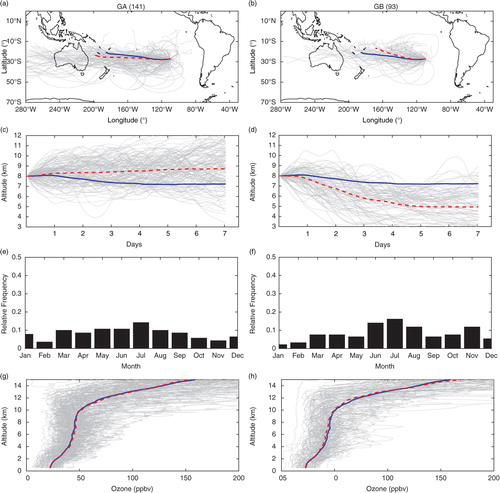
We also carried out the exercise of classifying the individual 7-day back trajectories of the ozone profiles using the SOM technique. If forced to build two groups, one finds a group (GA) with subtropical characteristics with 141 members, and a second group (GB) with 93 members and tropical features (See ). The former group contains air masses that originate in the subtropics or the mid-latitudes, with descending trajectories. The trajectories in the latter show mostly ascending trajectories originating in the tropics. This supports the idea that Rapa Nui ozone profiles have a seasonality characterised by convective conditions in summer and fall and by subsiding conditions in late winter and spring. Consistently, ozone profiles in GA (GB) are generally below (above) the annually averaged profile. If more groups are considered, the synoptic conditions become clearer but the ozone profile characteristics get smeared out.
Fig. 14 Classification of ozone profiles according to self-organising maps of back trajectories. From left to right, resulting groups, GA and GB, and number of members in parenthesis. From top to bottom, the two upper panels show the horizontal and vertical projections of individual back trajectories (light grey lines), average back trajectory for all soundings (solid blue) and group representative (dashed red line). The two lower panels show the relative frequency of occurrence of the back trajectories, and the corresponding individual ozone profiles (light grey lines), average of all ozone soundings (blue line) and average ozone profile for the group (dashed red line).
3.4. Trends
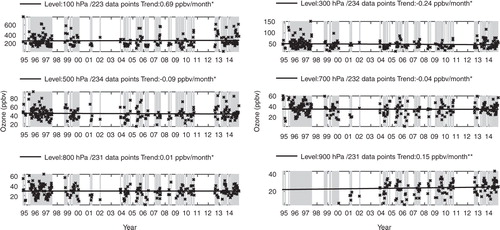
The discontinuous and asymmetric data distribution makes it difficult to assess trends. Except close to the surface, no significant temporal trends can be found. At 900 hPa, one finds a positive linear trend of 0.15 ppbv/yr, which suggests a local pollution signal consistent with increasing tourism and motorisation trends observed at Rapa Nui. This is nonetheless unsupported by the CO data. In the upper levels, we find slightly negative but insignificant trends. This could be related with the overall pole ward shift of the Hadley circulation reported in the literature, and consistent with a warming climate and the PDO (Hu and Fu, Citation2007; Seidel et al., Citation2008; Grassi et al., Citation2012) that would result in more tropical conditions for Rapa Nui. These features are shown in .
Fig. 15 Trend analysis for ozone at Rapa Nui. Linear trends shown by a continuous black line are calculated for isobaric levels indicated in each panel. The number of data points and the corresponding trend are also indicated. Grey lines show individual soundings.
However, as stated earlier data discontinuities make a trend analysis exercise far too uncertain. Also, roughly 50 % of the Rapa Nui soundings were collected between 1994 and 2001, and half of those were sampled in fall and winter (cf. ). Of the 126 soundings collected thereafter, 47 % were sampled in winter and only 20 % in spring. Given the prevalence of stratospheric intrusions in winter and spring, the connection between STE processes and the nearness of the STJ, it appears necessary to increase the sampling of profiles in spring. Summer profiles are also under sampled.
4. Summary and conclusions
A unique record of 260 ozone soundings is available from Rapa Nui (Rapa Nui, 27°S, 109 W) covering the period August 1994 to October 2014. The seasonally averaged soundings indicate a fall minimum and a late spring maximum in ozone in the upper troposphere. The former occurs in connection with the approximation of the SPCZ. The latter is suggestive of stratosphere–troposphere-exchange linked to the strength of the subtropical high and the nearness of the STJ in late winter and spring, allowing downward transport of stratospheric O3 present above 200 hPa. Occasionally, mid-latitude disturbances reach Rapa Nui inducing tropopause breaks and intrusions of stratospheric ozone. In the lower troposphere, extremes are found in summer and winter and they appear to be modulated by changes in insolation and static stability, showing larger ozone mixing ratios in winter than in summer.
An advanced clustering technique (self-organizing maps, SOM) was applied to the data in order to identify ‘natural groups’, constructed with no a priori seasonal variability. We found a group with 57 members associated with air masses of mid- and upper-tropospheric origin brought towards the Rapa Nui by the westerly flow in winter and spring. These profiles show a central profile with larger values than the climatological profile in the troposphere. A distinctive but relatively small group (36 members) of profiles’ characteristic of stratospheric intrusions associated with deep troughs was also identified. The majority of the members of this intrusive group appear in winter and spring, with values well in excess of the average sounding, particularly in the upper troposphere. A third group with 94 members was identified with ozone profiles lower than the average profile in the troposphere. This group appears to follow convective conditions that mix boundary layer air into the upper troposphere in fall and winter. A fourth group of 47 soundings is synoptically unspecific, with a central profile similar to the average profile of all 234 soundings considered valid up to 15 km. The robustness of any statistical analysis, as well as the interpretations of meteorological and other influences will improve as the number of ozone soundings at Rapa Nui keeps growing. Clearly, further work is needed to untangle the different processes explaining the ozone variability at Rapa Nui.
When applying the SOM technique to individual 7-day back trajectories of 234 profiles, the splitting between tropical and subtropical conditions becomes apparent. In fact, both the standard seasonally averaged climatology and the clustering based on the SOM technique, plus the back-trajectory analysis, suggest the influence of both tropical and subtropical air masses at Rapa Nui. Tropical air masses lead to TOCs adding to less than 25 DU, whereas prevailing STE processes in late winter and spring determine TOCs of more than 40 DU. The seasonal variability is in good agreement with the corresponding quantity derived from the OMI/MLS and TOMS/SBUV data, however, ozone column minima are systematically overestimated by the satellite products. The stratospheric contribution to the spring maximum in ozone in the upper troposphere is consistent with similar features found in other tropical and subtropical stations in the Southern Hemisphere, and by the synoptic features identified for those profiles.
Existing CO observations show the hemispheric impact of biomass burning in the tropics and subtropics of the Southern Hemisphere during spring. This biomass burning signal occurs concurrently with an increase of 7Be in the lower troposphere, which is interpreted as an indicator of stratospheric intrusions. The low frequency of data collection does not allow the study of individual transport events.
The quality of the data set is deemed as high since ca. 90 % of all collected soundings are valid. However, the uneven sampling frequency of ozone sounding hampers a trend analysis. Nevertheless, we found a significant linear trend of 0.15 ppbv/yr near the surface consistent with a pollution signal. Insignificant decreasing trends are found in the upper-tropospheric levels, which are consistent with the observed widening of the Tropical belt. However, no decrease in upper-tropospheric ozone has been found over Irene or La Réunion (Thompson et al., Citation2014; Liu et al., Citation2016).
The remote location of Rapa Nui provides a unique and privileged position to observe global change and to verify satellite borne measurements and modelling. Therefore, we consider of major importance the continuation and possibly the expansion of this GAW station.
Supplementary Material
Download MS Excel (44.9 KB)Acknowledgements
Initially this work was supported by grant FONDECYT 1030809 and finished under FONDAP 15110009. We are grateful for the provision of ozone profiles by the Chilean Weather Office, and the ancillary data collected from various sources. CO data were obtained from WMO/WDCGG data base and collected by NOAA/ESRL. We are also grateful for 7Be provided by the Chilean Commission on Nuclear Energy. A. M. Thompson's participation is courtesy of SHADOZ (NASA Upper Air Research Program) and was initially sponsored through a Grant to the Pennsylvania State University: NNX09AJ23G.
Notes
To access the supplementary material to this article, please see Supplementary files under ‘Article Tools’.
References
- Baldy S. , Ancellet G. , Bessafi M. , Badr A. , Luk D. L. S . Field observations of the vertical distribution of tropospheric ozone at the island of Reunion (southern tropics). J. Geophys. Res.-Atmos. 1996; 101: 23835–23849.
- Bals-Elsholz T. M. , Atallah E. H. , Bosart L. F. , Wasula T. A. , Cempa M. J. , co-authors . The wintertime Southern Hemisphere split jet: structure, variability, and evolution. J. Clim. 2001; 14: 4191–4215.
- Calderón J. , Fuenzalida H . Radiación ultravioleta en Isla de Pascua: factores climáticos y ozono total. Stratus. 2014; 2: 8.
- Chandra S. , Ziemke J. , Min W. , Read W . Effects of 1997–1998 El Nino on tropospheric ozone and water vapor. Geophys. Res. Lett. 1998; 25: 3867–3870.
- Chen B. , Smith S. R. , Bromwich D. H . Evolution of the tropospheric split jet over the South Pacific Ocean during the 1986–89 ENSO cycle. Mon. Weather. Rev. 1996; 124: 1711–1731.
- Clain G. , Baray J. L. , Delmas R. , Diab R. , de Bellevue J. L. , co-authors . Tropospheric ozone climatology at two Southern Hemisphere tropical/subtropical sites, (Reunion Island and Irene, South Africa) from ozonesondes, LIDAR, and in situ aircraft measurements. Atmos. Chem. Phys. 2009; 9: 1723–1734.
- Cuevas O . Análisis de ozonosondas en Rapanui: climatología, masas de aire y su impacto en el ozono troposférico. 2004; Meteorólogo Department, Universidad de Valparaíso, Chile.
- Dessler A. E., Minschwaner K. An analysis of the regulation of tropical tropospheric water vapor. J. Geophys. Res. 2007; 112 D10120, DOI: http://dx.doi.org/10.1029/2006JD007683.
- Diab R. D. , Raghunandan A. , Thompson A. M. , Thouret V . Classification of tropospheric ozone profiles over Johannesburg based on mozaic aircraft data. Atmos. Chem. Phys. 2003; 3: 713–723.
- Diab R. D. , Thompson A. M. , Zunckel M. , Coetzee G. J. R. , Combrink J. , co-authors . Vertical ozone distribution over southern Africa and adjacent oceans during SAFARI-92. J. Geophys. Res.: Atmos. 1996; 101: 23823–23833.
- Díaz S. , Camilión C. , Deferrari G. , Fuenzalida H. , Armstrong R. , co-authors . Ozone and UV radiation over Southern South America: climatology and anomalies. Photochem. Photobiol. 2006; 82: 834–843.
- DMC. Anuario Meteorológico 2014. Dirección Meteorológica de Chile, Santiago, Chile. 2015
- Draxler R. R., Rolph G. HYSPLIT – Hybrid Single-Particle Lagrangian Integrated Trajectory Model. Silver Spring, MD: NOAA Air Resources Laboratory. 2003. Online at: http://www.arl.noaa.gov/ready/hysplit4.html.
- Fishman J. , Wozniak A. E. , Creilson J. K . Global distribution of tropospheric ozone from satellite measurements using the empirically corrected tropospheric ozone residual technique: identification of the regional aspects of air pollution. Atmos. Chem. Phys. 2003; 3: 893–907.
- Folland C. , Renwick J. , Salinger M. , Mullan A . Relative influences of the interdecadal Pacific oscillation and ENSO on the South Pacific convergence zone. Geophys. Res. Lett. 2002; 29: 21-1–21-4..
- Fuenzalida H. A. , Sanchez R. , Garreaud R. D . A climatology of cutoff lows in the Southern Hemisphere. J. Geophys. Res.-Atmos. 2005; 110: D18101.
- Galewsky J. , Sobel A. , Held I . Diagnosis of subtropical humidity dynamics using tracers of last saturation. J. Atmos. Sci. 2005; 62: 3353–3367.
- Gallardo L. , Carrasco J. , Olivares G . An analysis of ozone measurements at Cerro Tololo (30 degrees S, 70 degrees W, 2200 m.a.s.l.) in Chile. Tellus Series B-Chem. Phys. Meteorol. 2000; 52: 50–59.
- Grassi B. , Redaelli G. , Canziani P. O. , Visconti G . Effects of the PDO phase on the tropical belt width. J. Clim. 2012; 25: 3282–3290.
- Heikkilä U. , Beer J. , Feichter J . Modeling cosmogenic radionuclides Be-10 and Be-7 during the Maunder Minimum using the ECHAM5-HAM general circulation model. Atmos. Chem. Phys. 2008; 8: 2797–2809.
- Heikkilä U. , Beer J. , Abreu J. A. , Steinhilber F . On the atmospheric transport and deposition of the cosmogenic radionuclides (10Be): a review. Space. Sci. Rev. 2013; 176: 321–332.
- Henríquez A. Herramientas matemáticas para el análisis de sistemas de observación atmosférica. 2014. MSc. Department, Universidad de Chile. Online at: http://tesis.uchile.cl/handle/2250/116839.
- Hu Y. , Fu Q . Observed poleward expansion of the Hadley circulation since 1979. Atmos. Chem Phys. 2007; 7: 5229–5236.
- Huovinen P. , Gómez I. , Lovengreen C . A five-year study of solar ultraviolet radiation in Southern Chile (39°S): potential impact on physiology of coastal marine algae?. Photochem. Photobiol. 2006; 82: 515–522.
- Jensen A. A. , Thompson A. M. , Schmidlin F. J . Classification of Ascension Island and Natal ozonesondes using self-organizing maps. J. Geophys. Res. Atmos. 2012; 117: DO4302.
- Jolliffe I. Principal component analysis. 2014. Wiley StatsRef: Statistics. DOI: http://dx.doi.org/10.1002/9781118445112.stat06472.
- Kalnay E. , Kanamitsu M. , Kistler R. , Collins W. , Deaven D. , co-authors . The NCEP/NCAR 40-year reanalysis project. B. Am. Meteorol. Soc. 1996; 77: 437–471.
- Kalthoff N. , Bischoff-Gauss I. , Fiebig-Wittmaack M. , Fiedler F. , Thurauf J. , co-authors . Mesoscale wind regimes in Chile at 30 degrees S. J. Appl. Meteorol. 2002; 41: 953–970.
- Karoly D. J . Southern hemisphere circulation features associated with El Niño-Southern Oscillation Events. J. Clim. 1989; 2: 1239–1252.
- Koch D. , Rind D . Beryllium 10 beryllium 7 as a tracer of stratospheric transport. J. Geophys. Res.-Atmos. 1998; 103: 3907–3917.
- Kodinariya T. M. , Makwana P. R . Review on determining number of cluster in k-means clustering. Int. J. 2013; 1: 90–95.
- Kohonen T . Self-organizing maps Vol. 30 . 1995; Springer-Verlag Berlin Heidelberg, Springer.
- Komhyr W. D. , Barnes R. A. , Brothers G. B. , Lathrop J. A. , Opperman D. P . Electrochemical concentration cell ozonesonde performance evaluation during STOIC 1989. J. Geophys. Res.-Atmos. 1995; 100: 9231–9244.
- Liu J. , Rodriguez J. M. , Thompson A. M. , Logan J. A. , Douglass A. R. , co-authors . Origins of tropospheric ozone interannual variation over Réunion: a model investigation. J. Geophys. Res.: Atmos. 2016; 121: 521–537.
- Lovengreen C. , Fuenzalida H. , Villanueva L . Ultraviolet solar radiation at Valdivia, Chile (39.8 degrees S). Atmos. Environ. 2000; 34: 4051–4061.
- MacQueen J . Some methods for classification and analysis of multivariate observations. Proceedings of the 5th Berkeley Symposium on Mathematical Statistics and Probability. 1967; University of California Press, Berkeley, California: Statistics. 281–297.
- Novelli P. C. , Masarie K. A . Atmospheric Carbon Monoxide Dry Air Mole Fractions from the NOAA ESRL Carbon Cycle Cooperative Global Air Sampling Network, 1988–2013. 2014. Version: 2014-07-02.
- Novelli P. C., Masarie K. A., Lang P. M., Hall B. D., Myers R. C., co-authors. Reanalysis of tropospheric CO trends: effects of the 1997–1998 wildfires. J. Geophys. Res.-Atmos. 2003; 108 4464, DOI: http://dx.doi.org/10.1029/2002JD003031.
- Oltmans S. J. , Johnson B. J. , Harris J. M. , Vomel H. , Thompson A. M. , co-authors . Ozone in the Pacific tropical troposphere from ozonesonde observations. J. Geophys. Res.-Atmos. 2001; 106: 32503–32525.
- Oman L. D., Ziemke J. R., Douglass A. R., Waugh D. W., Lang C., co-authors. The response of tropical tropospheric ozone to ENSO. Geophys. Res. Lett. 2011; 38 L13706, DOI: http://dx.doi.org/10.1029/2011GL047865.
- Philander S. G. H . El Niño, La Niña, and the Southern Oscillation. In: International Geophysical Series (eds. R. Dmowska and J. R. Holton) . 1990; 293. Vol. 46, Academic Press, San Diego, .
- Rondanelli R., Gallardo L., Garreaud R. D. Rapid changes in ozone mixing ratios at Cerro Tololo (30 degrees 10′ S, 70 degrees 48′ W, 2200 m) in connection with cutoff lows and deep troughs. J Geophys Res Atmos. 2002; 107 (D23), 4677, DOI: http://dx.doi.org/10.1029/2001JD001334.
- Salimi F. , Ristovski Z. , Mazaheri M. , Laiman R. , Crilley L. R. , co-authors . Assessment and application of clustering techniques to atmospheric particle number size distribution for the purpose of source apportionment. Atmos. Chem. Phys. 2014; 14: 11883–11892.
- Schumacher C. , Houze R. A . Stratiform rain in the tropics as seen by the TRMM precipitation radar. J. Clim. 2003; 16: 1739–1756.
- Seidel D. J. , Fu Q. , Randel W. J. , Reichler T. J . Widening of the tropical belt in a changing climate. Nat. Geosci. 2008; 1: 21–24.
- Skerlak B. , Sprenger M. , Wernli H . A global climatology of stratosphere-troposphere exchange using the ERA-Interim data set from 1979 to 2011. Atmos. Chem. Phys. 2014; 14: 913–937.
- Smit H. , De Backer H. , Davies J. , Deshler T. , Fujimoto T. , co-authors . Quality assurance and quality control for ozonesonde measurements in GAW, WMO global Atmos. Watch Rep., No. 201, World Meteorological Organization. GAW/WMO Reports. 2011; Switzerland: Geneva. pp. 100..
- Stauffer R. M., Thompson A. M., Young G. S. Tropospheric ozonesonde profiles at long-term U.S. monitoring sites: 1. A climatology based on self-organizing maps. J. Geophys. Res. Atmos. 2016; 121: 1320–1339. DOI: http://dx.doi.org/10.1002/2015JD023641.
- IPCC. Stocker T. F. , Qin D. , Plattner G.-K. , Tignor M. , Allen S. K. , co-editors . Climate Change 2013: The Physical Science Basis. Contribution of Working Group I to the Fifth Assessment Report of the Intergovernmental Panel on Climate Change. 2013; Cambridge, UK: Cambridge University Press. 1535 pp..
- Streten N. , Zillman J . Climate of the South Pacific Ocean. World Survey Climatol. 1984; 15: 263–429.
- Thompson A. , Balashov N. , Witte J. , Coetzee J. , Thouret V. , co-authors . Tropospheric ozone increases over the southern Africa region: bellwether for rapid growth in Southern Hemisphere pollution?. Atmos Chem Phys. 2014; 14: 9855–9869.
- Thompson A. M. , Diab R. D. , Bodeker G. E. , Zunckel M. , Coetzee G. J. R. , co-authors . Ozone over southern Africa during SAFARI-92/TRACE A. J. Geophys. Res.: Atmos. 1996a; 101: 23793–23807.
- Thompson A. M. , Miller S. K. , Tilmes S. , Kollonige D. W. , Witte J. C. , co-authors . Southern hemisphere additional ozonesondes (SHADOZ) ozone climatology (2005–2009): tropospheric and tropical tropopause layer (TTL) profiles with comparisons to OMI-based ozone products. J. Geophys. Res.: Atmos. 2012; 117: D23301.
- Thompson A. M. , Oltmans S. J. , Tarasick D. W. , von der Gathen P. , Smit H. G. J. , co-authors . Strategic ozone sounding networks: review of design and accomplishments. Atmos Environ. 2011; 45: 2145–2163.
- Thompson A. M. , Pickering K. E. , McNamara D. P. , Schoeberl M. R. , Hudson R. D. , co-authors . Where did tropospheric ozone over southern Africa and the tropical Atlantic come from in October 1992? Insights from TOMS, GTE TRACE A, and SAFARI 1992. J. Geophys. Res.: Atmos. 1996b; 101: 24251–24278.
- Thompson A. M. , Witte J. C. , McPeters R. D. , Oltmans S. J. , Schmidlin F. J. , co-authors . Southern hemisphere additional ozonesondes (SHADOZ) 1998–2000 tropical ozone climatology – 1. Comparison with total ozone mapping spectrometer (TOMS) and ground-based measurements. J. Geophys. Res.-Atmos. 2003; 108: 8238.
- Tilmes S. , Lamarque J. F. , Emmons L. K. , Conley A. , Schultz M. G. , co-authors . Technical note: ozonesonde climatology between 1995 and 2011: description, evaluation and applications. Atmos. Chem. Phys. 2012; 12: 7475–7497.
- Vincent D. G . The South Pacific convergence zone (SPCZ): a review. Mon. Weather. Rev. 1994; 122: 1949–1970.
- Vincent E. M. , Lengaigne M. , Menkes C. E. , Jourdain N. C. , Marchesiello P. , co-authors . Interannual variability of the South Pacific convergence zone and implications for tropical cyclone genesis. Clim. Dyn. 2011; 36: 1881–1896.
- Wai K. M. , Wu S. , Kumar A. , Liao H . Seasonal variability and long-term evolution of tropospheric composition in the tropics and southern hemisphere. Atmos. Chem. Phys. 2014; 14: 4859–4874.
- Waugh D. W. Impact of potential vorticity intrusions on subtropical upper tropospheric humidity. J. Geophys. Res: Atmos. 2005; 110 D11305, DOI: http://dx.doi.org/10.1029/2004JD005664.
- Xie F. , Li J. , Tian W. , Zhang J. , Shu J . The impacts of two types of El Niño on global ozone variations in the last three decades. Adv. Atmos. Sci. 2014; 31: 1113–1126.
- Zeng G., Pyle J. A. Influence of El Nino Southern Oscillation on stratosphere/troposphere exchange and the global tropospheric ozone budget. Geophys. Res. Lett. 2005; 32 L01814, DOI: http://dx.doi.org/10.1029/2004GL021353.
- Ziemke J. , Chandra S. , Oman L. , Bhartia P . A new ENSO index derived from satellite measurements of column ozone. Atmos. Chem. Phys. 2010; 10: 3711–3721.
- Ziemke J. , Douglass A. , Oman L. , Strahan S. , Duncan B . Tropospheric ozone variability in the tropics from ENSO to MJO and shorter timescales. Atmos. Chem. Phys. 2015; 15: 8037–8049.
- Ziemke J. R. , Chandra S. , Labow G. J. , Bhartia P. K. , Froidevaux L. , co-authors . A global climatology of tropospheric and stratospheric ozone derived from Aura OMI and MLS measurements. Atmos. Chem. Phys. 2011; 11: 9237–9251.