
Abstract
This study aims at analysing the latitudinal variability of both the yearly and seasonal pattern of 7Be surface activity concentrations, at addressing the impact of tropopause height (TPH) on 7Be distribution and at evaluating the time lag between TPH and 7Be at European level. With this aim, weekly 7Be and daily TPH data at 17 sampling stations during 10 yr (2001–2010) are analysed. 7Be shows a clear increasing tendency in the period and generally tends to increase with decreasing latitude. The seasonal pattern generally shows maxima during the warm period and minima during the cold one. The seasonal variogram analysis points out a good spatial correlation for TPH data while a weaker one is observed for 7Be, having TPH a larger influence on 7Be during summer. The influence of TPH on 7Be exhibits a large spatial variability, with a clear gap between south and north in the area of the polar front jet. The results identify the presence of two main groups, in particular separating between stations located in northern Europe (50 °N and higher) and stations in southern Europe (south of 50 °N). A similar behaviour for stations located in the same geographical area is also observed when looking at the day of maximum impact of TPH on 7Be concentrations. The results suggest that 7Be concentrations respond in different time ranges to changes in the TPH, observing seasonal differences in each group. These results represent the first European approach to the understanding of the TPH impact on 7Be concentrations at surface levels.
To access the supplementary material to this article, please see Supplementary files under ‘Article Tools’.
Key Points
Variability of 7Be activity concentration in relation to tropopause height is investigated.
Southern and northern areas with different spatial variability are identified.
Different response times of 7Be concentration to changes in tropopause height are found.
1. Introduction
Beryllium-7 (7Be) cosmogenic isotope is mainly (75 %) produced in the stratosphere, while the remainder 25 % is produced in the upper troposphere (Usoskin and Kovaltsov, Citation2008). The residence time of 7Be in the stratosphere is typically of the order of a couple of years (e.g. McHargue and Damon, Citation1991). Once produced, 7Be is rapidly adsorbed onto fine aerosol particles in the stratosphere and further transported to the troposphere. Once in this layer, several factors affect the distribution of 7Be in surface air, introducing complexity in the evaluation of the 7Be activity in surface air (Baskaran, Citation2011), being estimated mean residence times in the troposphere from 18 to 23 d (e.g. Koch et al., Citation1996). However, as a first step in this complex analysis, the so-called stratosphere-to-troposphere transport (STT) is one of the key factors to understand 7Be activity concentrations at surface levels.
The life cycle of STT including the decay, dispersion and eventually mixing of the air masses has been studied (e.g. Cooper et al., Citation2004). In this sense, previous studies using, among others, also 7Be as a tracer of stratospheric air in the troposphere (Zanis et al., Citation1999; Cristofanelli et al., Citation2003, Citation2006) have demonstrated that air parcels originating in the stratosphere may reach the surface levels in two ways: (1) directly (less than about 2 d), through a vigorous vertical transport, and with largely conserved chemical–physical properties after intrusion into the troposphere, and (2) indirectly (about 4–5 d), through a multistep transport process, and a greater loss of stratospheric properties along the path. The latter one, the indirect transport, may affect air composition 1000 km away from the intrusion area.
As the occurrence of STT can be connected with intense tropopause deformations (e.g. Reid and Vaughan, Citation2004; Cristofanelli et al., Citation2006), the tropopause height (TPH) evolution can be used to identify the location and the characteristics of STT. The TPH is characterised by both a large zonal variation, reaching values of 15–18 km in the tropics and no more than 6–8 km at the poles (Liu et al., Citation2014), as well as a temporal variability, presenting a seasonal and a daily variation linked with the presence of weather systems. Within the temporal and space variability of the TPH, many studies have focused on the occurrence and characteristics of tropopause folds related to cyclogenesis at midlatitudes (e.g. Browning, Citation1997) and resulting in deep intrusions of stratospheric air into the troposphere (e.g. Reid and Vaughan, Citation2004).
Some studies have focused on the influence of STT on 7Be activity concentrations at surface level during tropopause folding events. For example, Gerasopoulos et al. (Citation2006) analysed a complex case study of STT in Greece in which 7Be concentrations exceeded 9 mBq m−3; Stohl et al. (Citation2000) analysed 7Be concentrations (and ozone and humidity) to study frequency of stratospheric intrusions in the Alps and northern Apennines; and Zanis et al. (Citation2003) investigated a predicted deep STT event encountered during the STACCATO project period on 20–21 June 2001. In addition, Ioannidou et al. (Citation2014) provided an estimation of the time lag between the TPH and surface 7Be concentrations.
These studies represent sporadic previous evidences for certain locations in Europe, but a comprehensive analysis of the impact of TPH on 7Be distribution across Europe has not yet been undertaken. This kind of analysis is crucial to better understand the regional distribution of 7Be; moreover, the results can be useful in establishing the relationship between 7Be and meteorological factors (such as dry and wet deposition, synoptic and mesoscale circulations) which affect its concentrations at surface levels.
Therefore, taking the TPH evolution as an indicator of STT, the present study aims at: (1) offering a better understanding of the STT impact on the 7Be activity concentrations at surface levels, and (2) providing an estimation of the time lag between the elevation of TPH and surface 7Be concentrations at European level.
2. Material and methods
2.1. 7Be database: monitoring sites
The current study used 7Be data collected between 2001 and 2010 at the sampling locations indicated in and shown in . These data were stored by the online Radioactivity Environmental Monitoring (REM) Database, supported by the Radioactivity Environmental Monitoring group of the Institute for Transuranium Elements (ITU) of the Joint Research Centre (JRC). Nowadays, REMdb contains a unique collection of environmental radioactivity measurements from 1984 onwards to analyse and compare environmental radioactivity data in Europe (www.rem.jrc.ec.europa.eu/RemWeb). The 7Be database stored in the REMdb is public until 2006, while the access to the data corresponding to the 2007–2011 period can be granted only after explicit request. The groups providing the data have already published several papers on their radioactivity measurements [e.g. Dueñas et al. (Citation2011) and Piñero Garcia et al. (Citation2012) in Spain; Leppänen and Paatero (Citation2013) in Finland; Ioannidou et al. (Citation2005) in Greece; and Carvalho et al. (Citation2013) in Portugal].
Fig. 1 Map of 7Be sampling sites. The stations given in squares are selected for latitudinal analysis (Section 3.2).
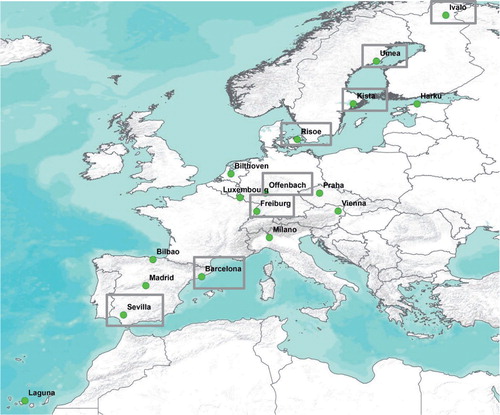
Table 1. Station name, coordinates (latitude, longitude, altitude above sea level), number of operability sampling periods and temporal resolution.
The period of 2001–2010 was selected to provide the highest number of operative stations with available measurements. Individual radionuclide analyses extracted from REMdb were mainly performed on a weekly basis, with a varying time resolution from 6 to 8 d. also shows the number of measurements used in this work. 7Be was measured on airborne particulate matter filters sampled through high-volume particulate samplers. Further information on the procedure, as well as the list of National Competent Authorities, is available in Hernández-Ceballos et al. (Citation2015).
2.2. TPH calculation
Daily TPH values were calculated at each station following the methodology of Ioannidou et al. (Citation2014). This method is based on the use of values of geopotential height and pressure on the closest isobaric levels (above and below the tropopause) and the air temperature and pressure at the tropopause level. Data used for the calculation were downloaded from the Earth System Research Laboratory (ESRL).
2.3. Statistical methods
Geostatistics offers a way to describe the spatial continuity of natural phenomena and provides adaptations of classical regression techniques to take advantage of this continuity (Isaaks and Srivastava, Citation1989). Therefore, geostatistical tools were used to study the spatial structure of 7Be and TPH data. To understand the spatial variability of 7Be and TPH in Europe and in particular, to infer how much of the 7Be variability can be explained by the location (longitude, latitude) or by other factors, the spatial correlation between data was measured by means of the variogram. Variograms were calculated using the software Surfer11 (SURFER 2012), considering the average 7Be concentrations and TPH over the period 2001–2010 and looking separately into winter (Dec–Jan–Feb) and summer (Jun–Jul–Aug) seasons.
The distribution of data in each station was tested. In the majority of the stations, the normality test was verified. The Pearson's linear correlation coefficient (significance level 0.05) was calculated for each selected sampling site to determine the degree of association between TPH and 7Be activity concentrations. In all the statistical analyses, spring and autumn were not considered since they are transition seasons.
3. Results and discussion
3.1. Variogram analysis of TPH and 7Be
Variograms for 7Be and TPH are presented in a–f. The x-axis represents the distance between the pairs of samples while the value of the experimental variogram is plotted along the y-axis. In the present study, the 7Be variograms did not present a regular trend; that is, two observations closer together are not more similar than two observations farther apart – it means there is not a strong spatial correlation neither during the total period (a) nor during the winter–summer seasons (c and e). Variograms for TPH showed instead a good spatial correlation only at short distances considering the total database (b), while no spatial correlation was observed for TPH during winter (d). The summer variogram for TPH (f) gave instead a high spatial correlation, which was even higher than that observed for the total period since it was maintained also at larger distances.
Fig. 2 Variograms for 7Be and TPH: all available data (a and b), and separately winter (c and d) and summer (e and f) seasons.
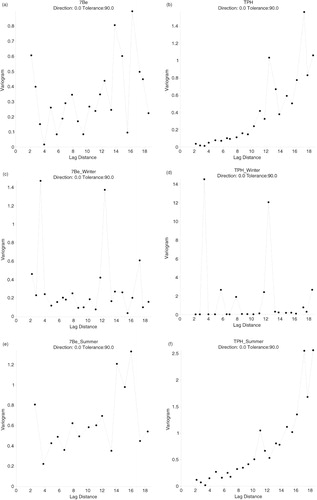
This analysis suggested that, as expected, TPH exerts only a minor influence on 7Be concentrations, and other factors, such as rainfall or wind dynamics, may strongly affect 7Be activity concentrations at surface levels especially during the winter season. In fact, the exchange between stratosphere and troposphere is only about the 20 % of the total amount of 7Be measured at surface level (Dutkiewicz and Husain, Citation1985). The analysis also highlighted the importance of local/regional/synoptic surface conditions on 7Be activity concentrations. It is worth noting here that all the stations in the REMdb are located at low altitude and within the planetary boundary layer (and for this reason local conditions might play a key role). The important role of local/mesoscale meteorological conditions on 7Be concentrations probably causes the absence of a spatial correlation for this variable.
At this point and in the light of the spatial correlation of TPH observed, we decided to select a set of stations to analyse the potential impact of TPH latitudinal variability on 7Be activity concentrations. Hence, a set of eight sampling locations along an imaginary line from low (Sevilla, as Laguna presented less variability of data) to high (Ivalo) latitudes were selected (the selected stations are marked with squares in ).
3.2. Yearly and monthly variability of 7Be
Annual average 7Be concentrations were calculated for the selected set of networks. As shown in and as discussed in the previous section, these stations were selected to address the latitudinal variability of 7Be in Europe. shows the spatial (from low to high latitudes) and temporal (from 2001 to 2010) variation of the annual arithmetic means of the weekly measurements.
Fig. 3 Interannual variability of 7Be activity concentrations.
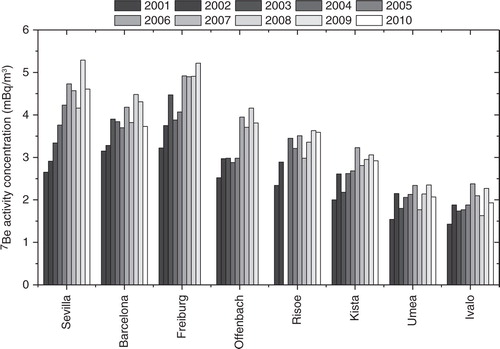
As a first remark, a clear interannual increasing tendency could be noticed in all the stations; moreover, a generally decreasing mean 7Be value with increasing latitude was also noticed (we refer to Hernandez-Ceballos et al., 2015, which gives a more general overview of 7Be activity concentrations in Europe). This interannual pattern confirmed the impact of the 11-yr solar modulation on 7Be air concentrations (Usoskin and Kovaltsov, Citation2008; Leppänen et al., Citation2010). The first tendency was a result of the 7Be production mechanism, which varies with solar modulation of galactic cosmic rays invading the heliosphere (Masarik and Beer, Citation1999), and in turn, is controlled by solar activity. The evolution of the sunspot number (www.sidc.oma.be/silso/datafiles) showed that our reference period (2001–2010) encompasses a part of the 23rd (1996 May–2008 January) and the beginning of the 24th (2008 January – present) solar cycle. An analysis of the annual mean 7Be concentrations with sunspot number clearly showed the opposite behaviour (Kikuchi et al., Citation2009; Steinmann et al., Citation2013) (not shown).
In the second case, the latitudinal influence on 7Be production (Kulan, Citation2006) caused a general decrease in the yearly values with an increase in latitude of the considered stations, resulting in higher values in the southern than in northern sampling stations. The minimum concentration was found in Ivalo (1.9 mBq/m3), while the maximum one was found in Sevilla (4.1 mBq/m3).
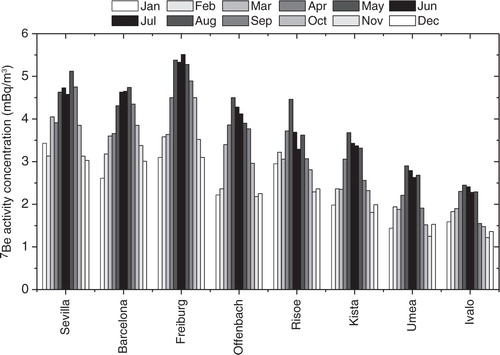
The seasonal variability of 7Be concentration at surface levels is displayed in , showing the presence of a strong seasonal pattern in all the stations: generally speaking, increased concentrations during the warm period from May to August, with a maximum during the months of June–July, and lower concentrations in winter and autumn, were observed. This pattern was consistent with previous findings for 7Be concentrations at surface levels (e.g. Lozano et al., Citation2011; Tositti et al., Citation2014). This seasonal variation could be explained by a combination of several factors, among which is the increased vertical transport of 7Be from the upper troposphere to the middle and lower troposphere in the summer months (e.g. Feely et al., Citation1982, Citation1989). In addition, similarly to the findings for the annual means, the influence of latitude on 7Be activity concentrations was also noted in this case.
Fig. 4 Mean monthly variability of 7Be activity concentrations (2001–2010).
3.3. Variability of TPH in EU: Correlation with monthly 7Be
Tropopause is recognised as a key feature of the atmospheric structure at all latitudes (Seidel and Randel, Citation2006). Ioannidou et al. (Citation2014) demonstrated a strong positive correlation between the seasonal changes of 7Be concentration in surface air and TPH and temperature (R=0.97 and R=0.94, respectively) in Thessaloniki, Greece.
shows the correlation coefficient obtained between the 7Be and TPH monthly means over the 2001–2010 period (12 monthly values for each variable and for each sampling station). A comparison of the coefficients indicated a large spatial variability in the impact of TPH on 7Be activity concentrations. According to the correlation coefficient value, two clear groups arose (from right to left in ). The first group comprehended stations with a low (less or equal to 0.4) and even negative (Risoe and Ivalo) value of the correlation coefficient. These measurement sites were located in the northern-central Europe (50 °N and higher). The second group was formed by stations with a higher value of the correlation coefficient (up to 0.6) which were located in the southern-central Europe (south of 50 °N).
Fig. 5 Correlation coefficient between mean monthly 7Be and TPH (2001–2010). White and black columns denote significant and non-significant correlations, respectively.
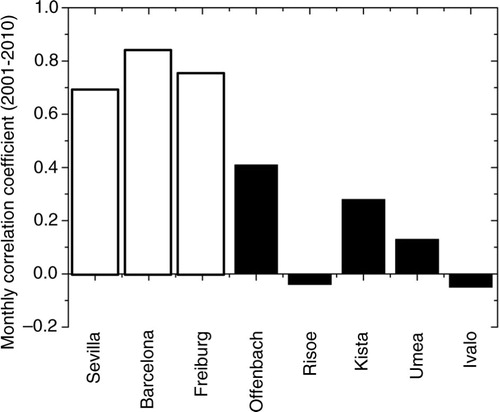
Within the first group of the measurement sites (north of 50 °N), Risoe and Ivalo, which are located in the vicinity of the Atlantic Ocean, exhibited a different value of the correlation coefficient (); in fact, the correlation coefficient for these two stations was negative, unlike the coefficients for all other sites. This observation might result from the fact that these sites are strongly affected by maritime air masses transported by the westerlies, which have low concentration of aerosols (Sorribas et al., Citation2011), and therefore, low concentration of 7Be attached to them. A similar observation was reported by Gerasopoulos et al. (Citation2001). It is worth noting here that these exceptions along the Atlantic Ocean coast imply a limitation of our analysis, in which ‘a horizontally stationary’ troposphere is assumed, which will be further discussed below.
These results displayed the existence of a latitudinal variability in the impact of TPH on 7Be activity concentrations. As reported above in the Introduction, TPH shows a latitudinal and a seasonal dependence (Liu et al., Citation2014), and it is higher over the tropics (~16 km) than at the poles (~8 km). However, the TPH decrease from low to high latitudes is not gradual – there is a rapid drop in TPH in the area of the polar front jet (50–60 °N). This behaviour is mostly due to the polar jet stream, a relatively narrow band of strong wind in the upper levels of the atmosphere. In fact, TPH suddenly decreases across the jet stream especially in conditions of strong jet streams associated with a front at lower levels. For this reason, the area of the polar front jet represents a gap in the gradual latitudinal decrease of TPH towards the poles, and this behaviour may partially explain the spatial variability between TPH and 7Be activity concentrations.
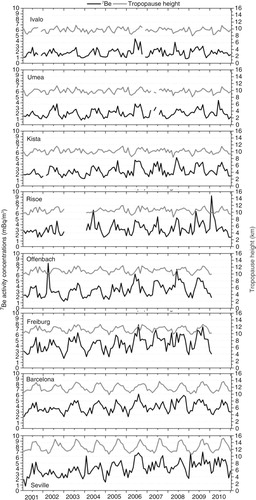
To confirm this relationship, shows the monthly evolution of TPH and 7Be activity concentrations in the eight sampling locations over the 2001–2010 period. The scatter plot diagram of 7Be vs. TPH for each station can be consulted in supporting information (Supplementary Fig. 1), which reports a coefficient of determination (R2) less than 0.4, reaching the highest values in the southern-central stations and the lowest ones in the northern ones. The latitudinal decrease was observed in both variables, and specifically for TPH from a minimum of six kilometres at Ivalo to a maximum of about nine kilometres in Seville. In addition to spatial differences, the monthly cycle was also pronounced, with a maximum in the warm months and a minimum during the cold months. This variability was mainly associated with the cycle of solar irradiation as well as with changes in meteorological conditions (e.g. Lee et al., Citation2007; Usoskin and Kovaltsov, Citation2008).
Fig. 6 Latitudinal variation of the monthly evolution of 7Be and TPH (2001–2010).
3.4. Spatial and temporal variability of time lag
The time lag between TPH and levels of 7Be surface concentrations represents the time required for the 7Be concentrations levels in the near surface air to respond to the change of TPH (Ioannidou et al., Citation2014). Given the spatial and temporal variability of the TPH, this time lag can register large spatial, from one station to other, and temporal, from hours to days, differences.
A correlation between weekly 7Be values and the corresponding seven daily TPH values was then calculated to describe and analyse the behaviour of this relationship across Europe. For each location, Pearson's linear correlation coefficients between weekly 7Be and daily TPH were calculated with a time lag of n days. The number of days n was allowed to vary from zero (corresponding to correlating the weekly 7Be activity concentration with the TPH on the sampling end day) to seven (corresponding to correlating the weekly 7Be activity concentration with the TPH on the sampling start day).
The selection of this maximum value of n (time lag period) was based on previous works (e.g. Cristofanelli et al., Citation2006), indicating that air parcels originating in the stratosphere may reach the surface within 5 d. In addition, as our data were weekly 7Be values, the use of weekly or average TPH values to calculate the correlation would generate a smooth component in the analysis, affecting the correlation values and hence, the interpretation of the results.
This methodology offered information on: (1) the temporal variability of the TPH impact on weekly 7Be activity concentration (maximum correlation coefficient) in each station, and (2) the spatial variability of the time lag.
The results for the eight selected stations are presented in a, showing the pattern of the cross-correlation analysis of weekly 7Be values and daily TPH. The maximum correlation values found in the analysis ranged between 0.2 and 0.45, which is in agreement with the 0.44 value reported by Ioannidou et al. (Citation2014). The time lag corresponding to the maximum coefficient value mainly ranged between 3 and 5 d. An exception was Freiburg where the correlation coefficient registered the maximum (0.45) on the 7th day. This behaviour highlighted the large spatial variation of the time delay between the TPH and 7Be concentrations in surface air. In the southern stations (Sevilla and Barcelona), the correlation coefficients had similar values over the days and after reaching the maximum value (on the third day), a plateau was established. Conversely, at higher latitude stations, more marked daily differences between the correlation values prior to and after reaching the maximum value were observed. In this line, it is worth pointing out the sharp decrease of the correlation value observed in Risoe, which might be associated with the persistence time in the state of the atmosphere. Finally, no particular tendency (neither to increase nor to decrease) for the day of the maximum correlation with latitude was detected.
Fig. 7 (a) Correlogram (a time lag from 0 to 7 d) between 7Be surface concentration and tropopause height, and maps showing the day on which the maximum correlation coefficient between TPH and 7Be is observed at the selected stations during (b) winter and (c) summer. ‘Nsgn’ stands for a correlation coefficient not statistically significant.
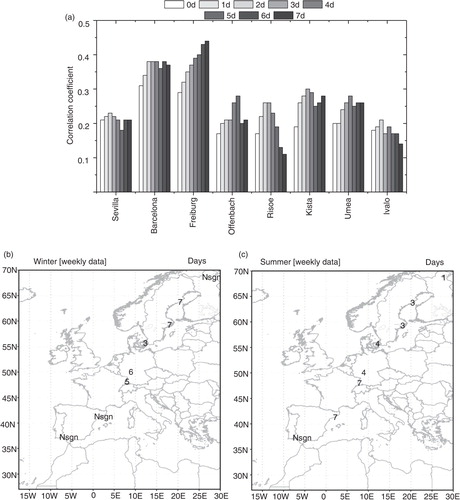
The comparison of the day in which the maximum correlation coefficient was reached in winter and summer (b and c) pointed out additional differences between the measurement sites. While in the northern stations this day decreased from winter to summer (from up to 7 d down to less than or equal to 3 d), in the central area generally higher spatial variability among the stations, but with reduced differences in magnitude, were observed. For example, from winter to summer it increased in Risoe (from three to four) and Freiburg (from five to seven), but decreased in Offenbach (from six to four). These patterns might be connected with the seasonal spatial distribution of STT in the northern Hemisphere (Sprenger and Wernli, Citation2003) and the synoptic configuration associated with it.
As for the southern stations, the correlation was not statistically significant in winter, which indicated the reduced impact of TPH on the 7Be concentrations. The result obtained in summer for Barcelona (time lag of 7 d) might be linked with the elevated occurrence of regional recirculations at lower levels over this area (Jorba et al., Citation2004), which might limit the direct impact of STT on 7Be activity concentrations.
These annual and winter–summer patterns for the time lag in the selected stations were also observed when considering all the stations (Supplementary Fig. 2), where it was possible to identify a similar behaviour in the same geographical area.
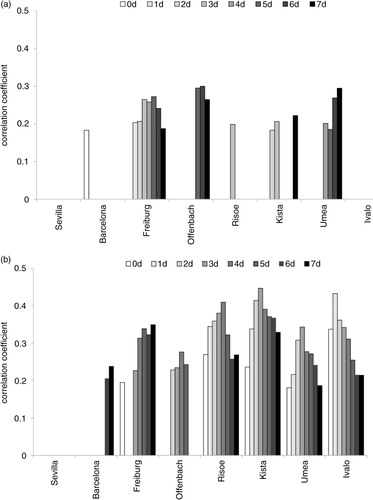
The comparison of the winter and summer correlation coefficients between 7Be surface concentrations and TPH calculated in each station for time lag ranging from 0 to 7 d is shown in a and b. The results showed that the number of significant correlations increased from winter to summer; moreover, the values of the correlation coefficient generally tend to increase from winter to summer, although with some exceptions (Freiburg with 3 d of time lag decreasing from winter to summer from 0.26 to 0.23, and Offenbach with 5 d of time lag decreasing from winter to summer from 0.30 to 0.24). These results confirmed that the influence of TPH on 7Be concentrations was higher during summer than during winter, in agreement with previous studies (e.g. Ioannidou et al., Citation2014). In contrast to the total set of data, when considering winter and summer seasons separately, the correlation appeared to be generally higher in the central stations, somewhat lower in the northern stations, and practically null in the southern stations.
Fig. 8 Winter (a) and summer (b) significant correlation coefficients between 7Be and TPH with a varying time lag from zero to seven for the selected stations.
As already mentioned in the discussion of the negative correlation coefficients obtained for Risoe and Ivalo (), they might be an indication of the impact the horizontal transport within the troposphere exerts on 7Be activity concentrations. Horizontal transport can play an important role in the distribution of 7Be in surface air (Feely et al., Citation1989; Gerasopoulos et al., Citation2001). It is, therefore, important to note here that an indirect exclusion of horizontal transport within the troposphere introduced a limitation in our analysis. Hence, in the future, a more comprehensive study, including both vertical and horizontal transport in the troposphere, would undoubtedly give more insight into the relation between the STT and 7Be distribution in surface air.
4. Conclusions
Ten years of 7Be data in 17 sampling stations along Europe, stored in the REMdb, were analysed together with the TPH in order to characterise: (1) the spatial and temporal distribution of 7Be in surface air, (2) the impact of the TPH on 7Be surface activity concentration, and (3) the time lag variability between the TPH and 7Be concentration.
Regarding the first objective, the 7Be activity concentrations showed both spatial and temporal variability. The 7Be activity concentration increased as latitude decreased from the north to south (as shown by the variogram analysis). On the other hand, the temporal variability was marked by a clear interannual tendency, governed by the solar cycle, and a noticeable seasonal pattern, with maxima during the warm months and minima during winter and autumn, most likely associated with a combination of meteorological factors.
In the analysis of the relationship between 7Be and TPH, the variogram results showed that TPH exerted only a minor influence on the 7Be activity concentrations during the winter season, and a larger influence in summer. In general, the results displayed latitudinal variability in the impact of TPH on 7Be activity concentrations, also reflecting a gap in the gradual latitudinal decrease of TPH towards the North Pole in the area of the polar front jet. The spatial distribution of the time lag revealed a spatial and temporal variability, with two distinct groups (south and north) in which seasonal differences were also observed.
These results verify the impact of TPH on the 7Be surface concentrations and also represent the first attempt to understand the variability of that impact. The large number of measuring locations across Europe offers a study platform of great spatial coverage which could pose a basis for future research towards a general understanding of the relationship between the 7Be surface concentration and its governing mechanisms.
5. Acknowledgements
The authors would like to thank all the EU Member States for having sent the data to the REMdb, and the NOAA/OAR/ESRL PSD, Boulder, Colorado, USA, for provision of the NCEP Reanalysis data through their web site www.esrl.noaa.gov/psd/. A part of this paper was realised within the following project: ‘Climate changes and their influence on the environment: impacts, adaptation and mitigation’ (No. III43007), financed by the Ministry of Education, Science and Technological Development of the Republic of Serbia (2011–2016).
Notes
To access the supplementary material to this article, please see Supplementary files under ‘Article Tools’.
References
- Baskaran M . Po-210 and Pb-210 as atmospheric tracers and global atmospheric Pb-210 fallout: a review. J. Environ. Radioact. 2011; 102: 500–513.
- Browning K. A . The dry intrusion perspective of extra-tropical cyclone development. Meteorol. Appl. 1997; 4: 317–324.
- Carvalho A. C. , Reis M. , Silva L. , Madruga M. J . A decade of 7Be and 210Pb activity in surface aerosols measured over the Western Iberian Peninsula. Atmos. Environ. 2013; 67: 193–202.
- Cooper O. , Forster C. , Parrish D. D. , Dunlea E. , Hübler G. , co-authors . On the life cycle of a stratospheric intrusion and its dispersion into polluted warm conveyor belts. J. Geophys. Res. 2004; 109: D23.
- Cristofanelli P. , Bonasoni P. , Collins W. , Feichter J. , Forster C. , co-authors . Stratosphere-to-troposphere transport: a model and method evaluation. J. Geophys. Res. 2003; 108(D12): 8525.
- Cristofanelli P. , Bonasoni P. , Tositti L. , Bonafe U. , Calzolari F. , co-authors . A 6-year analysis of stratospheric intrusions and their influence on ozone at Mt. Cimone (2165 m above sea level). J. Geophys. Res. 2006; 111: D03306.
- Dueñas C. , Orza J. A. G. , Cabello M. , Fernández M. C. , Cañete S. , co-authors . Air mass origin and its influence on radionuclides activities (7Be and 210Pb) in aerosol particles at a coastal site in the western Mediterranean. Atmos. Res. 2011; 101: 205–214.
- Dutkiewicz V. A. , Husain L . Stratospheric and tropospheric components of 7Be in surface air. J. Geophys. Res. 1985; 90: 5783–5788.
- Feely H. , Toonkel L. , Larsen R . Radionuclides and Trace Elements in Surface Air. 1982; Department of Energy, New York: Environmental Measurements Lab. II.83–II.166.
- Feely H. W. , Larsen R. J. , Sanderson C. G . Factors that cause seasonal variations in Beryllium-7 concentrations in surface air. J. Environ. Radioact. 1989; 9: 223–249.
- Gerasopoulos E. , Zanis P. , Papastefanou C. , Zerefos C. S. , Ioannidou A. , co-authors . A complex case study of down to the surface intrusions of persistent stratospheric air over the Eastern Mediterranean. Atmos. Environ. 2006; 40: 4113–4125.
- Gerasopoulos E. , Zanis P. , Stohl A. , Zerefos C. A. , Papastefanou C. , co-authors . A climatology of 7Be at four high-altitude stations at the Alps and the Northern Apennines. Atmos. Environ. 2001; 35: 6347–6360.
- Hernández-Ceballos M. A. , Marín Ferrer M. , Cinelli G. , Tollefsen T. , De Felice L. , co-authors . A climatology of 7Be in surface air in European Union. J. Environ. Radioact. 2015; 141: 62–70.
- Ioannidou A. , Manolopoulou M. , Papastefanou C . Temporal changes of 7Be and 210Pb concentrations in surface air at temperate latitudes (40 degrees N). Appl. Radiat. Isot. 2005; 63: 277–284.
- Ioannidou A. , Vasileiadis A. , Melas D . Time lag between the tropopause height and 7Be activity concentrations on surface air. J. Environ. Radioact. 2014; 129: 80–85.
- Isaaks E. H. , Srivastava R. M . An Introduction to Applied Geostatistics. 1989; New York: Oxford University Press. 561.
- Jorba O. , Pérez C. , Rocadenbosch F. , Baldasano J. M . Cluster analysis of 4-day back trajectories arriving in the Barcelona Area, Spain, from 1997 to 2002. J. Appl. Meteorol. 2004; 43: 887–901.
- Kikuchi S. , Sakurai H. , Gunji S. , Tokanai F . Temporal variation of 7Be concentrations in atmosphere for 8 y from 2000 at Yamagata, Japan: solar influence on the 7Be time series. J. Environ. Radioact. 2009; 100: 515–521.
- Koch D. , Jacob D. J. , Graustein W. C . Vertical transport of tropospheric aerosols as indicated by 7Be and 210Pb in a chemical tracer model. J. Geophys. Res. 1996; 101: 18651–18666.
- Kulan A . Seasonal 7Be and 137Cs activities in surface air before and after the Chernobyl event. J. Environ. Radioact. 2006; 90: 140–150.
- Lee H. N. , Tositti L. , Zheng X. , Bonasoni P . Analyses and comparisons of variations of 7Be, 210Pb and 7Be/210Pb with ozone observations at two Global Atmosphere Watch stations from high mountains. J. Geophys. Res. 2007; 112: D05303.
- Leppänen A.-P. , Paatero J . 7Be in Finland during the 1999–2001 Solar maximum and 2007–2009 Solar minimum. J. Atmos. Solar-Terrestrial. Phys. 2013; 97: 1–10.
- Leppänen A.-P. , Pacini A. A. , Usoskin I. G. , Aldahan A. , Echer E. , co-authors . Cosmogenic 7Be in air: a complex mixture of production and transport. J. Atmos. Sol. Terr. Phys. 2010; 72: 1036–1043.
- Liu Y. , Xu T. , Liu J . Characteristics of the seasonal variation of the global tropopause revealed by COSMIC/GPS data. Adv. Space Res. 2014; 54: 2274–2285.
- Lozano R. L. , San Miguel E. G. , Bolívar J. P. , Baskaran M . Depositional fluxes and concentrations of 7Be and 210Pb in bulk precipitation and aerosols at the interface of Atlantic and Mediterranean coast in Spain. J. Geophys. Res. 2011; 116: D18213.
- Masarik J. , Beer J . Simulation of particle fluxes and cosmogenic nuclide production in the Earth's atmosphere. J. Geophys. Res. 1999; 104: 12099–12111.
- McHargue L. R. , Damon P. E . The global beryllium-10 cycle. Rev. Geophys. 1991; 29: 141–158.
- Piñero Garcia F. , Ferro García M. A. , Azahra M . 7Be behaviour in the atmosphere of the city of Granada January 2005 to December 2009. Atmos. Environ. 2012; 47: 84–91.
- Radioactivity Environmental Monitoring (REM). Database. Online at: https://rem.jrc.ec.europa.eu/RemWeb/Activities.aspx?id=REMdb.
- Reid H. J. , Vaughan G . Convective mixing in a tropopause fold. Q. J. Roy. Meteorol. Soc. 2004; 130: 1195–1212.
- Seidel D. J. , Randel J. W . Variability and trends in the global tropopause estimated from radiosonde data. J. Geophys. Res. 2006; 111: D21101.
- Sorribas M. , De la Morena B. A. , Wehner B. , López J. F. , Prats N. , co-authors . On the sub-micron aerosol size distribution in a coastal–rural site at El Arenosillo Station (SW – Spain). Atmos. Chem. Phys. 2011; 11: 11185–11206.
- Sprenger M. , Wernli H . A northern hemispheric climatology of cross-tropopause exchange for the ERA15 time period (1979–1993). J. Geophys. Res. 2003; 108(D12): 8521.
- Steinmann P. , Zeller M. , Beuret P. , Ferreri G. , Estier S . Cosmogenic 7Be and 22Na in ground level air in Switzerland (1994–2011). J. Environ. Radioact. 2013; 124: 68–73.
- Stohl A. , Bonasoni P. , Cristofanelli P. , Collins W. , Feichter J. , co-authors . The influence of stratospheric intrusions on alpine ozone concentrations. Atmos. Environ. 2000; 34: 1323–1354.
- Tositti L. , Brattich E. , Cinelli G. , Baldacci D . 12 years of 7Be and 210Pb in Mt. Cimone, and their correlation with meteorological parameters. Atmos. Environ. 2014; 87: 108–122.
- Usoskin I. , Kovaltsov G . Production of cosmogenic 7Be isotope in the atmosphere: full 3D modelling. J. Geophys. Res. 2008; 113: 12107.
- Zanis P. , Schuepbach E. , Gäggeler H. W. , Hübener S. , Tobler L . Factors controlling Beryllium-7 at Jungfraujoch in Switzerland. Tellus. 1999; 51: 789–805.
- Zanis P. , Trickl T. , Stohl A. , Wernli H. , Cooper O. , co-authors . Forecast, observation and modelling of a deep stratospheric intrusion event over Europe. Atmos. Chem. Phys. 2003; 3: 763–777.