
Abstract
Levoglucosan (LG), water soluble organic carbon (WSOC) and potassium (K+), and the light absorption at 365 nm (Abs365) of the extracted WSOC are measured in PM2.5 samples collected from November 2011 to July 2013 at four coastal urban sites in southeast China (Fuzhou, Putian, Quanzhou and Xiamen). These species are markers of biomass burning and used to determine the contributions of biomass burning to the PM2.5 burden in these locations. LG and WSOC concentrations exhibited a clear seasonal pattern, with a large enhancement in winter and spring and a minimum in summer, and annual means across all sites of 59.2±46.8 ng m−3 and 2.69±1.21 µg C m−3, respectively. The distinctive seasonal patterns of LG and WSOC are more explained by the East Asian monsoon than the upwind varying emission sources according to the HYSPLIT backward trajectories and MODIS fire spots. Observations produced significant correlation (at the p<0.01 level) between LG and non-sea salt K+ (nss-K+) at each site, but the correlations exhibited no clear seasonal trend. The LG/nss-K+ ratios ranged from 0.03±0.01 to 0.24±0.13 which lay within the limits for the crop residues and/or grass combustion smoke. Stronger correlations were found between WSOC or Abs365 and sulphate than between WSOC and LG. This observation is consistent with the fact that biomass burning is a less important contributor to WSOC and/or brown carbon than is secondary organic aerosol formation and oxidation. The average relative contributions of biomass burning to OC and WSOC in PM2.5 were 8.3 and 15.2 %, respectively, estimated by the measured LG to OC and WSOC (LG/OC and LG/WSOC) ratios in comparison to literature-derived LG/OC and LG/WSOC values for biomass burning smoke. Using the reported conversion factor of LG to PM2.5 for crop straw burning smoke, the LG-estimated PM2.5 contributions from biomass burning exhibited minimum values in summer and higher values in winter and spring. Positive Matrix Factorisation was used to analyse PM2.5 sources, and seven major source factors including biomass burning emissions were resolved. The biomass burning sources contributed 3.75–8.08 % to PM2.5 mass as an annual average while exhibiting a seasonal variability similar to and higher than those of LG-estimated contributions. These results demonstrate that the contribution from biomass burning smoke to PM2.5 – while small – is non-negligible, especially in the winter and spring sampling periods, that is, northeastern monsoon season.
To access the supplementary material to this article, please see Supplementary files under ‘Article Tools’.
1. Introduction
China is facing air pollution problems with PM2.5 due to its rapid growth of economy and urbanisation, especially in regions such as Beijing-Tianjin-Hebei (BTH), the Yangtze River Delta (YRD) and the Pearl River Delta (PRD) (www.mep.gov.cn). Motor vehicles, fossil-fuel combustion, industrial processes, biomass burning and soil dusts are suggested to be the main sources of PM2.5 in China (Song et al., Citation2006; Tao et al., Citation2013, Citation2014; Zhang et al., Citation2013a, Zhang et al., Citation2013b). Meanwhile, biomass burning which is associated with field burning of biomass and agricultural wastes has drawn more concern due to the strengthening of vehicle emission standards and the use of power plant scrubbers as well as the increase of crop yield and less demand as fuel with the rapid economic development in rural areas (Yan et al., Citation2006; Lu et al., Citation2011; Wang et al., Citation2013). According to the inventory studies by Lu et al. (Citation2011), biomass burning contributions accounted for about 40 and 70 % of elemental carbon (EC) and primary organic carbon (OC), respectively, during 2006–2010 in China. Moreover, biomass burning is suggested to be one of the major contributors to the uncertainty in air quality modelling (Tian et al., Citation2009). Studies to characterise the organic composition of biomass burning aerosols are also motivated by the climate change (Andreae and Rosenfeld, Citation2008), light absorption (Chen and Bond, Citation2010) and human health effects (Naeher et al., Citation2007) of this aerosol class. Therefore, estimation of biomass burning emissions is urgently needed for quantifying this contribution and improving air quality.
National-, regional- or urban-scale biomass burning emission inventories have been made in China (Streets et al., Citation2003; Yan et al., Citation2006; He et al., Citation2011; Zhang et al., Citation2013b). However, there still exist large uncertainties in biomass burning emission estimates due to the incomplete and incomprehensive collection of activity data and variable emission factors depending on moisture, type of vegetation and burning conditions (smouldering or flaming), wind direction and other meteorological factors (Streets et al., Citation2003; Bond et al., Citation2004; He et al., Citation2011; Oanh et al., Citation2011; Zhang et al., Citation2013a, Citation2013b). Since these difficulties exist in the establishment of a reliable emission inventory for biomass burning, individual source tracers including levoglucosan (1,6-anhydro-β-d-glucopyranose; LG) and water soluble K+ and receptor modelling methods are often used to assess biomass burning contributions to PM2.5 (Zhang et al.,Citation2008, Citation2010; Sang et al., Citation2011; Giannoni et al., Citation2012; Reche et al., Citation2012; Mkoma et al., Citation2013; Ho et al., Citation2014; Zhu et al., Citation2015). LG, which is produced exclusively by the pyrolysis of cellulose and hemicellulose, is the most commonly used organic tracer for biomass burning aerosols (Puxbaum et al., Citation2007). This compound is relatively stable in the atmosphere with no decay over 10 d in very acidic conditions (Fraser and Lakshmanan, Citation2000). Little loss of LG in biomass burning soot exposure to UV radiation and high concentrations of ozone was observed (Latif et al., Citation2011). In addition, the modelled and measured LG levels at a remote monitoring site in the Pacific Ocean were comparable, suggesting no considerable degradation during transport from the Asian continent within 4–5 days (Mochida et al., Citation2010). Although K+ is also proposed as a conventional tracer for biomass burning, it is not a unique product of cellulose combustion as it can also be emitted from sea salt, soil dust, meat cooking, coal combustion and abrasion of leaf surfaces (Simoneit, Citation2002; Duvall et al., Citation2008).
However, chamber studies revealed that LG in aqueous solution can experience degradation in the presence of strong oxidants (e.g. OH radical) (Hennigan et al., Citation2010; Hoffmann et al., Citation2010; Lai et al., Citation2014). Nevertheless, LG is a preferred tracer for semi-quantitative or conservative quantitative assessment of biomass burning influence due to its specificity, high emission factor and high level in aerosols. Zhang et al. (Citation2007) reported LG to organic carbon (LG/OC)BB and PM2.5 (LG/PM2.5)BB ratios ranging from 5.4 to 11.8 % (av. 8.2 %) and 2.98 to 6.47 % (av. 4.52 %), respectively, in PM2.5 smoke from chamber combustion experiments of three major types of cereal straw (corn, wheat and rice) in China. The (LG/OC)BB ratio is comparable to the (LG/OC)BB ratios in the range of 8.0–8.2 % (av. 8.14 %) calculated from the emission factors for various types of biomass burning in Andreae and Merlet (Citation2001) and the ratios of 0.5–9.97 % derived from rice and wheat burning smoke in the chamber (Sullivan et al., Citation2008), but much lower than the reported value (16.8 %) for field open burning PM2.5 smoke of rice straw (Oanh et al., Citation2011). In addition, different removal rates by dry and wet deposition between LG and OC and secondary formation of OC during transport in the atmosphere can also influence the LG/OC ratio in ambient aerosol significantly (Zhang et al., Citation2012; Cheng et al., Citation2013). The contribution of biomass burning to OC using the simplified tracer-based method varied widely (6.5–52 %) depending on the biomass burning activities (Zhang et al., Citation2008, Citation2012; Sang et al., Citation2011; Mkoma et al., Citation2013; Ho et al., Citation2014; Zhu et al., Citation2015). Based on the Positive Matrix Factorisation (PMF) using concentrations of chemical species including LG and K+, biomass burning contributions accounted for 3–24 % of the annual PM2.5 with lowest values in summer and higher in other seasons in Beijing (Cheng et al., Citation2013; Zhang et al., Citation2013c), Chengdu (Tao et al., Citation2014) and the southeastern US (Zhang et al., Citation2010). In addition, the impact of biomass burning could be assessed by using outdoor fire counts and HYSPLIT backward trajectories (Zhang et al., Citation2010, Citation2012; Sang et al., Citation2011; Mkoma et al., Citation2013; Ho et al., Citation2014; Zhu et al., Citation2015).
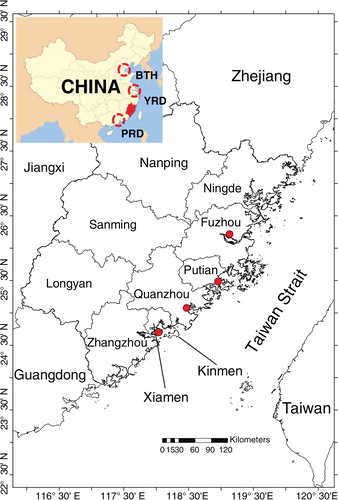
Fujian province is on China's southeastern coast and lies in-between the YRD and PRD (). Its climate is mainly dominated by the East Asian monsoon characterised with a southwest wind prevailing in summer and northeast wind prevailing in winter. The province is mostly mountainous and is traditionally described to be ‘Eight parts mountain, one part water and one part farmland’. Thus, biomass burning activities such as crop residues in Fujian are not as common as those in northern and eastern China. According to our previous investigation, the common types of biomass burning in the mountainous rural areas of Fujian are rice straw and sugarcane leaves (in-field burning) and woody fuel (domestic burning), which are similar to those reported in PRD, China (Zhang et al., Citation2013b). However, emissions from wood-fuel boilers to provide warm water in prawn farming in cold season and plastic recycling to melt waste plastics, in-field grass burning in vegetable plots, and domestic joss paper and incense burning can influence carbonaceous aerosol inventory more significantly in coastal urban areas. Furthermore, Fujian's coastal area is a perfect region to capture the signals of biomass burning from the upwind sources during the northeast monsoon and southwest monsoon periods. The seasonal patterns of PM2.5 and its major components from the four sites at Xiamen, Quanzhou, Putian and Fuzhou cities along the coastal line coincided well with the monsoon cycles during a 2-yr monitoring period (Wu et al., Citation2015a). Organic matter (=1.6×OC) was suggested to be the largest contributor, accounting for 30.2 % of PM2.5, followed by
![]() (19.8 %),
(19.8 %),
![]() (10.6 %) and
(10.6 %) and
![]() (9.7 %). However, the estimate of biomass burning contributions to OC was limited due to the lack of LG data in PM2.5. Because the major part of OC from biomass burning was found to be water-soluble, water-soluble organic carbon (WSOC) could be used to evaluate the influence of biomass burning on carbonaceous aerosol. WSOC accounted for a large fraction (20–70 %) of aerosol OC (Feng et al., Citation2006; Park and Cho, Citation2011) and has been recognised as an important fraction of OC due to its potential influence on climate change (Ervens et al., Citation2005). Sources of WSOC have been shown to be complex including primary sources such as biomass burning (Zhang et al., Citation2010) and secondary sources such as atmospheric reactions (Hecobian et al., Citation2010). Brown carbon or humic-like substances (HULIS) in WSOC, which display relatively more absorbance in shorter wavelength regions and less in the longer wavelength regions, have been proved to be an important light-absorbing substance (Graber and Rudich, Citation2006). Because brown carbon typically absorbs at short wavelength, the light absorbance at 365 nm (Abs365) was often chosen for evaluation of light absorbing properties and comparison with that of black carbon (Andreae and Gelencser, Citation2006; Kirillova et al., Citation2014; Du et al., Citation2014a). HULIS, which has been shown to behave like surface active agents or surfactants, can reduce the surface tension in a droplet and enhance the formation of cloud condensation nuclei (CCN) in the atmosphere (Taraniuk et al., Citation2008). Thus, the spectroscopic characteristics of WSOC together with concentrations of chemical marker species can be used as PMF model input dataset (Zhang et al., Citation2010).
(9.7 %). However, the estimate of biomass burning contributions to OC was limited due to the lack of LG data in PM2.5. Because the major part of OC from biomass burning was found to be water-soluble, water-soluble organic carbon (WSOC) could be used to evaluate the influence of biomass burning on carbonaceous aerosol. WSOC accounted for a large fraction (20–70 %) of aerosol OC (Feng et al., Citation2006; Park and Cho, Citation2011) and has been recognised as an important fraction of OC due to its potential influence on climate change (Ervens et al., Citation2005). Sources of WSOC have been shown to be complex including primary sources such as biomass burning (Zhang et al., Citation2010) and secondary sources such as atmospheric reactions (Hecobian et al., Citation2010). Brown carbon or humic-like substances (HULIS) in WSOC, which display relatively more absorbance in shorter wavelength regions and less in the longer wavelength regions, have been proved to be an important light-absorbing substance (Graber and Rudich, Citation2006). Because brown carbon typically absorbs at short wavelength, the light absorbance at 365 nm (Abs365) was often chosen for evaluation of light absorbing properties and comparison with that of black carbon (Andreae and Gelencser, Citation2006; Kirillova et al., Citation2014; Du et al., Citation2014a). HULIS, which has been shown to behave like surface active agents or surfactants, can reduce the surface tension in a droplet and enhance the formation of cloud condensation nuclei (CCN) in the atmosphere (Taraniuk et al., Citation2008). Thus, the spectroscopic characteristics of WSOC together with concentrations of chemical marker species can be used as PMF model input dataset (Zhang et al., Citation2010).
Fig. 1. Administrative division of Fujian province and location of the four sampling sites (solid point in Xiamen, Quanzhou, Putian and Fuzhou).
In order to attain a better understanding of the organic carbonaceous aerosols, we analysed LG as well as WSOC and the light absorption spectra at 365 nm (Abs365) of WSOC and K+ in PM2.5. Moreover, the biomass burning contributions to OC and WSOC as well as PM2.5 were estimated using a molecular tracer technique. Finally, the PMF model in conjunction with HYSPLIT backward trajectory analysis and MODIS fire counts were employed to quantify average mass contributions from biomass burning and other sources of urban PM2.5 along the coastal lines of southeastern China.
2. Experimental methods
2.1. Sample location and collection
Four coastal urban sites along the coastal line in southeastern China were selected to collect PM2.5 in this region, namely (i) Hongwen Primary School in Xiamen (XM) (24°28′37″ N, 118°09′07″ E), (ii) Quanzhou City Environmental Protection Bureau in Quanzhou (QZ) (24°53′52″ N, 118°35′50″ E), (iii) Xiuyu District Campus in Putian (PT) (25°19′17″ N, 119°06′05″ E) and (iv) Fujian Normal University in Fuzhou (FZ) (26°04′31″ N, 119°18′55″ E; ). The samples were collected in daytime (8:00–18:00) and nighttime (18:00–8:00) over a period of 15 d in November, January, April and June or July between November 2011 and July 2013. The sampling and major components analysis including element, water soluble ions and carbon were described in detail in Wu et al. (Citation2015a). In this study, halves of the daytime and nighttime filters were merged into one sample for LG, WSOC and UV-Vis spectrum analysis. The values of precipitation for the eight sampling periods near the four sites were derived from Weather & Climate website (www.weatherandclimate.info).
2.2. Chemical characterisation
2.2.1. Levoglucosan
The analytical method for LG was modified from Wang et al. (Citation2007) and Zhang et al. (Citation2008). Half of the merged sample was cut and sonicated for 45 min in a 30-mL mixture of dichloromethane/methanol (2:1; v/v). After extraction, the solvents were concentrated to ~1 mL using a rotary evaporator. The extract was then filtered through 0.45 µm PTFE Acrodisc syringe filter (13 mm, Pall Co., Ltd, Beijing, China) into a concentrator tube. Nitrogen blow down was used to remove most solvents and the remaining filtrate was pipetted into a 300-µL auto-sampler vial insert and concentrated to dryness under the stream of N2. Fifty microliters of N,O-bis-(trimethylsilyl) trifluoroacetamide (BSTFA) containing 1 % trimethylsilyl chloride (TMCS) and 10 µL pyridine were added to the vial insert, which was then rapidly capped and allowed to react for 3 h in an oven at 70 °C. Immediately before GC–MS analysis, the solution containing derivatised LG was evaporated to dryness under a continuous flow of N2 and redissolved in 100 µL of hexane containing 10 ng internal standard (C25D50) for injection volume effects and variations in the GC–MS detector response.
An aliquot (1 µL) of silylated extract was injected into the GC–MS system in the splitless mode (Agilent 6890GC-5973 MSD). A HP-5 MS capillary column (30 m×0.25 mm i.d.×0.25 µm film) was used to separate these silylated products with an oven temperature program from 65 °C (hold for 2 min) to 300 °C (hold for 20 min) at a rate of 6 °C min−1, and helium as carrier gas. Injector and GC–MS interface temperatures were 250 °C and 280 °C, respectively. LG was identified by comparison with mass spectrum (NIST 02) and retention time of standards and quantified using selective ion monitoring (SIM) with ionic fragment of m/z = 204. The calibration curves for LG were linear over a wide concentration range (25–2500 ng mL−1) with the determination coefficient (R2) greater than 0.99. The limit of detection (LOD) was 1.1 ng per sample calculated as three times the standard deviation of six blank measurements, which corresponded to 0.03 ng m−3 in the atmosphere. There were no significant differences between field blanks and procedure blanks and the contents of the target compound in blanks were much lower than those in the ambient samples, so blank correction caused no noticeable change in the data.
The extraction efficiency of the LG target compound was determined by comparing the GC/MS response of the doped filters using LG standard solutions with those of the corresponding standard solutions that had not been spiked onto filters. The extraction recovery for LG was 94.6±5.3 % (n=7). The ambient LG concentrations presented here were corrected by field blanks and extraction recovery.
2.2.2. WSOC and light absorption properties
The remaining half of the merged filter was extracted with 20 mL of Milli-Q water (Millipore Co., Ltd, Shanghai, China) via 45 min sonication. The liquid extract was then filtered into a 50 mL comparison tube using a 0.45 µm PTFE Acrodisc syringe filter (13 mm, Pall Co., Ltd, Beijing, China). WSOC in the extract (10 mL) was quantified using a Total Organic Carbon Analyzer (TOC-VCPH, Shimadzu Co., Ltd, Beijing, China). The instrument was calibrated using a series of sucrose solutions every day through the analysis period. Another aliquot (10 mL) of the extract was used for the light absorbance measurement at 365 nm by a UV–Vis spectrophotometer (HP8453, Agilent Technologies Co., Ltd, Shanghai, China), using a wavelength range of 190–800 nm. In order to compare easily among samples, the absorption value was corrected by sampling volume and given as Abs365.
2.3. MODIS fire counts and HYSPLIT backward trajectories
Fire counts detected by NASA satellites (Aqua and Terra) have been widely used to identify the geographical hot spots of biomass burning activities with a horizontal resolution of 1×1 km2 pixel resolution (Sang et al., 2011; Zhang et al., Citation2010, Citation2012, Citation2015; Liu et al., Citation2013; Ho et al., Citation2014). In this study, burning activities in Fujian were shown by fire spots, and the sum of fire counts were obtained from FIRMS Web Fire Mapper (https://firms.modaps.eosdis.nasa.gov/firemap/) operated by NASA of the United States for each sampling period (Supplementary Fig. 1). In order to investigate the influence of biomass burning in different parts around Fujian on LG measured at the four coastal urban sites in Fujian, 7-d backward air mass trajectories staring at 100 m above ground level at 8:00 local time were calculated every day in each sampling period using HYSPLIT4 downloaded from http://ready.arl.noaa.gov/HYSPLIT.php. Six-hourly archived Global Data Assimilation System (1°×1°) from the National Centers for Environmental Prediction were used as meteorological data. The meteorological data were downloaded from ftp://arlftp.arlhq.noaa.gov (/pub/archives/gdas1). Cluster analysis was then applied to merge trajectories that are near each other into one cluster. The final cluster number ranged from 2 to 5 in order to obtain an appropriate solution (Supplementary Fig. 2).
2.4. Source apportionment analysis
LG is a better tracer of biomass burning than non-sea salt K+ (nss-K+) which has additional sources including soil dust, meat cooking and fireworks but has different emission factors depending on the type of vegetation and burning conditions (Wang et al., Citation2007; Zhang et al., Citation2010; Cheng et al., Citation2014). The ratio of LG to K+ (LG/K+)BB in biomass burning smoke therefore ranged in an order of magnitude depending on the biomass burning types and modes (Zhang et al., Citation2013a). In this study, we used the ratios of LG to OC [(LG/OC)BB, av. 8.2 %], WSOC [(LG/WSOC)BB, av. 17.0 %] and PM2.5 [(LG/PM2.5)BB av. 4.5 %] as reference values in biomass burning smoke to estimate biomass burning source contributions (Zhang et al., Citation2007, Citation2008, Citation2010; Sang et al., Citation2011; Ding et al., Citation2013; Ho et al., Citation2014). In addition, source apportionment analysis was also carried out by EPA-PMF (v5.0) receptor model (Zhang et al., Citation2010). In our study, PMF runs were performed using a total of 21 parameters including 20 chemical species (Si, Al, Ca, Ti, Fe, Mn, V, Ni, Pb, Zn, Na+, Cl−, nss-K+, nss-
![]() (non-sea salt
(non-sea salt
![]() ),
),
![]() ,
,
![]() , OC, EC, LG and WSOC) and light absorption at 365 nm (Abs365) (Zhang et al., Citation2010; Reche et al., Citation2012). The EPA-PMF (v5.0) model can be found on US EPA website (http://www.epa.gov/heasd/research/pmf.html). The data of inorganic ions and elements, OC and EC have been already reported by Wu et al. (Citation2015a). The nss-K+ and nss-
, OC, EC, LG and WSOC) and light absorption at 365 nm (Abs365) (Zhang et al., Citation2010; Reche et al., Citation2012). The EPA-PMF (v5.0) model can be found on US EPA website (http://www.epa.gov/heasd/research/pmf.html). The data of inorganic ions and elements, OC and EC have been already reported by Wu et al. (Citation2015a). The nss-K+ and nss-
![]() were calculated from the measured K+ and
were calculated from the measured K+ and
![]() minus the corresponding sea-salt fraction of K+ and
minus the corresponding sea-salt fraction of K+ and
![]() , that is, nss-K+=K+−0.036×Na+, nss-
, that is, nss-K+=K+−0.036×Na+, nss-
![]() =
=
![]() −0.252×Na+ (Seinfeld and Pandis, Citation2006). The number of base model runs was 20 and the base run with the minimum Q value (goodness-of-fit parameter) was retained. Numerous PMF runs were performed with 5–8 factors. Based on Q-values and physical interpretation of the solution, a seven-factor solution (including biomass burning, fuel oil, vehicular emission, secondary inorganic aerosol, crustal dust, metallurgical emission/mixed source of metallurgical emission and secondary sulphate aerosol and secondary aerosol/waste incineration emission) was selected as the most reasonable one.
−0.252×Na+ (Seinfeld and Pandis, Citation2006). The number of base model runs was 20 and the base run with the minimum Q value (goodness-of-fit parameter) was retained. Numerous PMF runs were performed with 5–8 factors. Based on Q-values and physical interpretation of the solution, a seven-factor solution (including biomass burning, fuel oil, vehicular emission, secondary inorganic aerosol, crustal dust, metallurgical emission/mixed source of metallurgical emission and secondary sulphate aerosol and secondary aerosol/waste incineration emission) was selected as the most reasonable one.
3. Results and discussion
3.1. Seasonal variations of LG and nss-K+
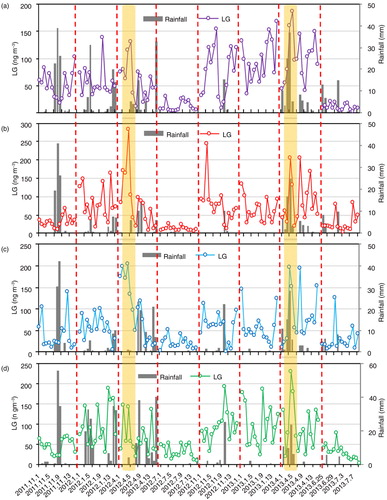
presents the temporal variations in the concentrations of LG in PM2.5 and rainfall at the four coastal urban sites in Fujian province during the eight sampling periods. The LG concentrations ranged from 1.26 to 283 ng m−3, with minimum seasonal means in summer (21.5±14.5 ng m−3) and maximum means in spring (83.5±58.1 ng m−3) and annual mean of 59.2±46.8 ng m−3 (Supplementary Table 1). In general, LG concentrations obtained in this study were much lower than those reported in megacities such as Guangzhou and Beijing and biomass burning impacted regions such as Chiang Mai in Thailand, Morogoro in Tanzania, and Florence in Italy and locations in the southeastern US (references in Supplementary Table 1). However, results of this study were considerably higher with respect to those measured on Okinawa Island in the northwestern Pacific and at a remote station on the Tibetan Plateau (Supplementary Table 1), suggesting minor impact from biomass burning in these regions. The seasonal variations of LG as seen from are consistent with results from other studies dealing with LG measurements (Zhang et al., Citation2008, Citation2010; Giannoni et al., Citation2012; Zhu et al., Citation2015) and similar to those of polycyclic aromatic hydrocarbons, dicarboxylic acids and other major water soluble ions associated with particulate matter observed in this region in different years (Hsu et al., Citation2010; Xu et al., Citation2012a; Li et al., Citation2013; Wu et al., Citation2014, Citation2015a, Citation2015b). As discussed previously, the seasonal pattern can be partly explained by the transport of air masses from upwind sources under the influence of the East Asian monsoons.
Fig. 2 Temporal variations of LG concentration and rainfall measured at (a) XM, (b) QZ, (c) PT and (d) FZ sites during the eight sampling periods. The two orange dashed bars represent high biomass burning activities around the traditional Ching-Ming festival.
During the summer sampling periods, the prevailing wind direction is southeast–southwest (Supplementary Fig. 2) and the input of clean marine air masses transported over South China Sea could more readily dilute the PM2.5 along the coastal region (Wu et al., Citation2015a, Citation2015b). Moreover, fewer biomass burning activities were observed in the upwind regions of Philippines during the summer sampling periods, as seen from MODIS fire counts (Supplementary Fig. 1). As mentioned earlier, MODIS fire count data can be used as a measure of field biomass burning. As shown in , the fire counts variation in Fujian didn't match the patterns of LG and nss-K+. The post-harvest wheat or rape straw burning emissions in summer sampling period in southeastern China move northward driven by summer monsoon and have little influence on ambient LG measured at the coastal urban sites in Fujian. Consequently, local small scale combustion activities such as agricultural residues and joss paper/incense burning should be the major sources and lower levels of LG were expected in summer due to the favourable dilution, diffusion and photodegradation conditions.
Fig. 3 Variations of LG and K+ average concentrations and MODIS fire counts in Fujian province.
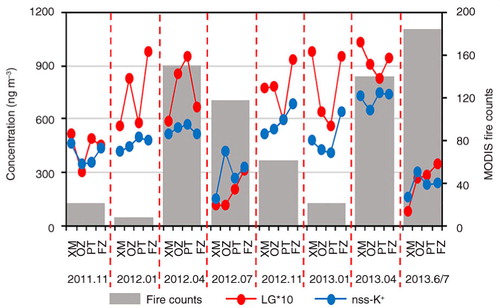
Analogously, the impact of biomass burning on ambient atmospheric pollutants should be low in winter as the minimum fire spots were detected (Supplementary Fig. 1 and 3). However, much higher concentrations of LG were observed in winter in comparison with those in summer, which deviated too much from fire counts shown in . According to the LG concentrations obtained in previous studies listed in Supplementary Table 1, higher levels were generally found in the cold season due to the use of biofuels for domestic heating than those in the warm season in places like Beijing, southeastern US and Florence. Zhu et al. (Citation2015) reported that the highest concentrations of LG in Okinawa aerosols collected from 28 December 2010 to 4 January 2011 were not consistent with fire spots detected in the upwind region of northeastern China and Russia, implying that biomass burning was likely in the form of indoor biofuel burning. In this study, however, the high levels of LG measured in winter should be more attributed to the stable atmospheric stratification resulting accumulation than to the burning activities in the upwind regions of northern and eastern China. Although the emission of LG from the indoor biofuel burning activities could significantly enhance for indoor heating in the upwind regions, they might not be transported as far as plumes from stacks because the emission sources were close to the surface. Nevertheless, the air masses along the southeastern coastal region could carry small scale biomass burning smoke to the sampling sites based on the backward trajectories in Supplementary Fig. 2. In addition, low temperature and solar radiation in winter might decrease the loss of LG due to the photodegradation and thus enhanced its ambient levels.
In April, intense biomass burning activities are apparent in southern, eastern and northern China (Supplementary Fig. 1), which are consistent with the common field burning of agricultural residues (e.g. crop stubble and wild grass) before spring ploughing. Owing to the elevated field burning of agricultural residues in Fujian () and prevailing northeast winds (Supplementary Fig. 1) during the pre-monsoonal periods, concentrations of the LG were comparable to and even higher than those in winter ( and ). The importance of local biomass burning was also observed at a background site in Ningbo where much higher levels of LG were found in summer with respect to other seasons due to the intensive biomass burning around the site (Liu et al., Citation2013). In November sampling periods, biomass burning activities such as post-harvest wheat and corn straw burning were much reduced (Supplementary Fig. 1) and the statistical fire counts in Fujian were also relatively low (). Therefore, less LG would be transported to the sampling sites by the air masses from the upwind regions (Supplementary Fig. 2) and less LG were emitted from local sources resulting low levels of LG ( and ).
As shown in , there was a substantial day-to-day variation in the LG concentration at the same site in the same sampling period. Although there is some coherence between the time series of rainfall and low LG level, LG concentration didn't correlate well with rainfall, probably due to the ineffective wash-out of PM2.5 by the light rain and/or a time lag between the reduction of PM2.5 and the rain event (Wu et al., Citation2015a). In addition, occasional local biomass burning activities such as outdoor and indoor incense and joss paper burning as well as open burning of weeds, leaves and other plant materials on graveyards around the traditional Ching-Ming festival (the 4th of April in 2012 and 2013) to worship deceased ancestors might contribute to some short-lived enhancements of LG in this study (Tsai et al., Citation2010; Sang et al., Citation2011).
Nss-K+ exhibited a similar seasonal trend to LG with minimum means in summer (155–423 ng m−3) and higher values in other seasons (349–744 ng m−3) (Supplementary Fig. 3). A comparison of LG and nss-K+ shows different degrees of correlation among the four sites (). At the XM site on the Xiamen Island where road sweeping is more frequent, the temporal correlation between the two tracers was higher than at other sites (r 2=0.5393 vs 0.3467–0.3802, p<0.01). The lower correlation at the QZ, PT and FZ sites may be due to sources other than biomass burning for nss-K+, such as fugitive dusts, meat cooking and waste incinerators (Simoneit, Citation2002; Duvall et al., Citation2008). Although the correlations between LG and nss-K+ are significant at p<0.05 level at the four sites (), the distinct seasonal variations of LG to nss-K+ ratio (LG/nss-K+), with much lower values in summer sampling periods (0.03–0.13, b), appear to be evidence for enhanced loss of LG through photo-oxidation along the atmospheric transport of air masses and/or different biomass burning in summer sampling periods (Simoneit, Citation2002; Wang et al., Citation2007; Duvall et al., Citation2008; Hennigan et al., Citation2010; Cheng et al., Citation2013). Similar seasonal trends of LG/nss-K+ ratio have also been reported in Beijing (Cheng et al., Citation2013; Wang et al., Citation2014), Guangzhou (Zhang et al., Citation2015), and southeastern US (Zhang et al., Citation2010) and variable emission sources and combustion conditions were suggested to be the main cause. Cheng et al. (Citation2013) summarised the (LG/nss-K+)BB in all kinds of source samples and concluded that the LG/nss-K+ ratios are able to distinguish the wood burning [(LG/K+)BB>1.0] from crop residues [(LG/K+)BB<1.0]. In this case, the LG/nss-K+ ratios averaged from 0.03±0.01 to 0.24±0.13, which were close to the corresponding source ratios of wheat straw (0.1) and corn straw (0.21) burning smoke (Cheng et al., Citation2013), slightly lower than the ratios for rice straw burning (0.24–0.57, Engling et al., Citation2009; 0.323, Viana et al., Citation2008; 0.07–1.22, Sullivan et al., Citation2008) and rape and wheat straw open burning (0.10–1.0, Tao et al., Citation2013), but much lower than those of wood burning smoke (5.89–23.96, Cheng et al., Citation2013; 1.45–6.40, Andreae and Merlet, Citation2001) (Supplementary Table 2). However, the (LG/K+)BB ratio of US grass burning varied over a wide range from 0.06 to 9.5 depending on the variety of grass and combustion conditions (dried or fresh) (Sullivan et al., Citation2008, Citation2014). Consequently, the measured LG in PM2.5 at the four coastal urban sites in Fujian province was more likely associated with the combustion of crop residues and/or grass than wood based on the published (LG/K+)BB ratios for different type of biomass (Supplementary Table 2), and the clear seasonal trend of LG/nss-K+ was mainly due to the different loss of LG through atmospheric photochemical oxidation which depends on ambient atmospheric conditions in each sampling periods (Hennigan et al., Citation2010; Cheng et al., Citation2013; Wu et al., Citation2015b).
Fig. 4 Correlations between LG and nss-K+ for all samples at each site.
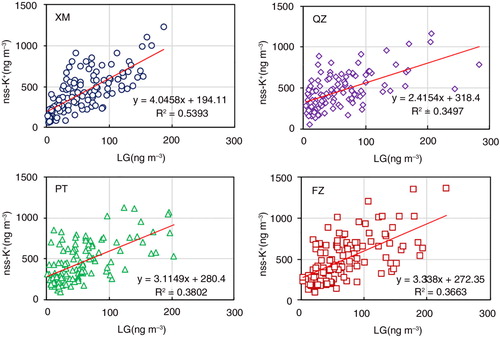
Fig. 5 (a) Seasonal variations of WSOC concentration, and ratios of (b) LG/nss-K+, (c) WSOC/OC, (d) SOC/OC, (e) LG/OC, (f) LG/WSOC, (g) OCBB/OC and (h) WSOCBB/WSOC in PM2.5 at the four urban sites.
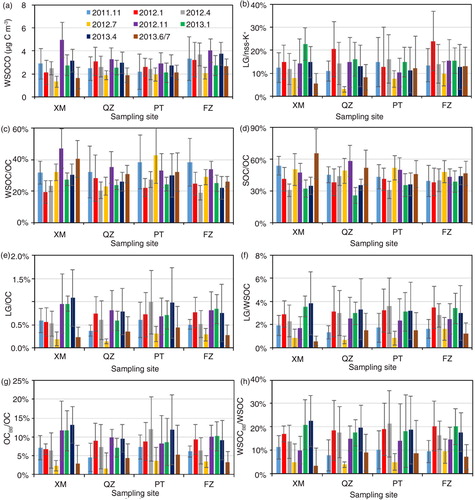
Table 1. Correlation coefficient between species (n=60)
3.2. Relationship between LG and carbon species
Like LG and nss-K+, WSOC also exhibited clear seasonal variations with minimum concentrations observed in summer season (a), which showed a similar trend as those reported in PRD (Ho et al., Citation2014), largely due to the Asian monsoon influence. The seasonal mean of WSOC among the four sites varied from 1.31±0.51 µg C m−3 to 4.94±1.55 µg C m−3, with an annual average of 2.69±1.21 µg C m−3, which were comparable to the levels of WSOC in PM2.5 at four sites in the PRD region (2.1±1.6 µg C m−3, Ho et al., Citation2014) and a rural site at Changdao Island (2.10–5.89 µg C m−3, Feng et al., Citation2007) but much lower than those reported in Beijing (7.2±5.5 µg C m−3, Du et al., Citation2014b). As listed in , strong correlations were found between WSOC and OC (p<0.001) with relatively higher correlations in summer and fall compared to those in spring and winter (r=0.715–0.886 vs 0.650–0.713), which looks like the trend of correlation between WSOC and SOC (secondary OC estimated by the EC-tracer method and the details of SOC estimation can be found in Wu et al., Citation2015a). Furthermore, both the contribution of WSOC to OC (WSOC/OC) and SOC to OC (SOC/OC) exhibited a similar seasonal variation with higher values in fall and summer and lower values in spring and winter, as illustrated in c and d. According to Weber et al. (Citation2007) and Ding et al. (Citation2008b), the increase of WSOC/OC can be related to the enhancement of secondary organic aerosol (SOA) formation and/or biomass burning activities. The WSOC/OC ratios were on average lower than those measured in biomass burning smoke (48 %, Guo et al., Citation2014). In summer and fall when the levels of LG were relatively low, both the stronger correlations between WSOC and OC and the higher WSOC/OC ratios could be attributed to the favourable ambient conditions such as the higher concentrations of O3, OH and NO3· radicals as well as higher temperature and UV intensity for photochemical processes (Sullivan et al., Citation2004; Seinfeld and Pandis, Citation2006; Feng et al., Citation2007; Wu et al., Citation2015a, Citation2015b). The WSOC/OC ratios obtained in this study (18.9–46.7 %) were comparable with those reported in fall-winter in PRD (38.8–57.9%, Ding et al., Citation2013) but lower than those in Beijing (38.8–62.6% annual, Du et al., Citation2014b), southeastern US (44–72 % annual, Ding et al., Citation2008b) and Changdao Island, China (40–59%, Feng et al., Citation2007). It is worth noting that the SOC/OC ratio was on average 1.5±0.6 times of WSOC/OC; that is, the amount of SOC was higher than that of WSOC. In other words, considerable WSOC was likely from secondary formation instead of primary biomass burning.
Since WSOC is mainly derived from biomass burning and secondary photochemical reaction of volatile organic compounds (VOCs) (Weber et al., Citation2007), Ding et al. (Citation2013) calculated secondary organic carbon (SOC) contribution by the difference between measured WSOC (WSOCmeasured) and WSOC from biomass burning (WSOCBB, estimated using LG-tracer method); that is, SOC = WSOCmeasured− WSOCBB. They found much higher concentrations of WSOC (7.63–11.5 µg C m−3) than those of SOC (4.18–5.79 µg C m−3) in PRD rural and urban areas. Using EC-tracer method, however, Kunwar and Kawamura (Citation2014) found lower SOC to WSOC ratios in winter-spring (0.49–0.78) but higher ratios in summer-fall (1.53–1.65) on Okinawa Island. Ding et al. (Citation2012) has pointed out the significant overestimation of SOC by EC-tracer method, which could result in the higher amount of SOC with respect to WSOC throughout the sampling campaigns in this study. Nevertheless, the factors of LG in WSOC from BB sources used for the estimation of WSOCBB depend strongly on fire conditions (fuel type and fire flaming/smouldering ratios) (Ding et al., Citation2008a; Sullivan et al., Citation2014; Yan et al., Citation2015). Therefore, particular caution is needed to investigate SOC because it is estimated using indirect approaches and much influenced by the selected reference OC/EC and LG/WSOC ratios in source emissions.
As also can be seen in , the correlations between WSOC and sulphate were positively significant as well (r=0.497–0.743, p<0.001, n=120) throughout the eight sampling periods and much higher than those between WSOC and LG (r=0.253–0.596, p<0.05, n=120) in the same sampling period. The correlation between WSOC and nitrate was similar with that between WSOC and sulphate in different sampling periods. In Beijing and Nanjing, strong correlations between WSOC with sulphate and nitrate were also observed throughout a year except summer, which possibly indicate their similar sources or formation pathways (Du et al., Citation2014b). The stronger correlations between WSOC and nss-
![]() compared to that between WSOC and LG further indicate that WSOC was more closely related to secondary formation pathways (Seinfeld and Pandis, Citation2006; Du et al., Citation2014b). In previous studies carried out in winter in Beijing and Tokyo, considerable WSOC was suggested to be from photochemical production in spite of the high correlations existed between WSOC and biomass burning (Du et al., Citation2014b). In addition, no clear seasonal trend for the correlation between WSOC and LG was observed in this study, further indicating that the influences of biomass burning emissions on WSOC are not very important in Fujian, even in winter and spring due to the relatively low concentrations of LG compared to those measured in Beijing (Cheng et al., Citation2013; Du et al., Citation2014b; Wang et al., Citation2014), Guangzhou (Ho et al., Citation2014; Zhang et al., Citation2015) and Chiang Mai (Tsai et al., Citation2013). It is noteworthy that the correlations between WSOC and nss-
compared to that between WSOC and LG further indicate that WSOC was more closely related to secondary formation pathways (Seinfeld and Pandis, Citation2006; Du et al., Citation2014b). In previous studies carried out in winter in Beijing and Tokyo, considerable WSOC was suggested to be from photochemical production in spite of the high correlations existed between WSOC and biomass burning (Du et al., Citation2014b). In addition, no clear seasonal trend for the correlation between WSOC and LG was observed in this study, further indicating that the influences of biomass burning emissions on WSOC are not very important in Fujian, even in winter and spring due to the relatively low concentrations of LG compared to those measured in Beijing (Cheng et al., Citation2013; Du et al., Citation2014b; Wang et al., Citation2014), Guangzhou (Ho et al., Citation2014; Zhang et al., Citation2015) and Chiang Mai (Tsai et al., Citation2013). It is noteworthy that the correlations between WSOC and nss-
![]() or
or
![]() were relatively low in summer sampling seasons with respect to other seasons (). In summer, WSOC was more influenced by strong solar radiation and biogenic source than direct biomass burning activities. As for nss-
were relatively low in summer sampling seasons with respect to other seasons (). In summer, WSOC was more influenced by strong solar radiation and biogenic source than direct biomass burning activities. As for nss-
![]() and
and
![]() , low concentrations were measured due to their decreased precursors such as SO2 and NOx under the influence of southwest monsoon as well as the enhanced loss of NH4NO3 at high temperature (Wu et al., Citation2015a). Despite the similar influencing factor in summer, WSOC and inorganic ions behaved differently resulting in lower correlations with respect to other seasons.
, low concentrations were measured due to their decreased precursors such as SO2 and NOx under the influence of southwest monsoon as well as the enhanced loss of NH4NO3 at high temperature (Wu et al., Citation2015a). Despite the similar influencing factor in summer, WSOC and inorganic ions behaved differently resulting in lower correlations with respect to other seasons.
As mentioned in the introduction section, the absorption at 365 nm (Abs365) can be used as an indicator of the light absorption properties of carbonaceous species or brown carbon. It is well accepted that biomass burning is one important sources of brown carbon in the atmosphere, especially in regions heavily affected by biomass burning emissions (Zhang et al., Citation2010; Du et al., Citation2014a). Other potential sources of brown carbon include tar materials from coal combustion, humic-like organics from soil, atmospheric aging of organics, and organic matter from ocean surface through bubble-bursting (Hecobian et al., Citation2010). The correlations between Abs365 and WSOC (r=0.690–0.889, p<0.001) were much stronger than those between Abs365 and LG (r=0.283–0.415, p<0.05) during the eight sampling periods, implying that secondary formation pathways might be more important than primary biomass burning emissions for brown carbon in PM2.5. Although the temporal correlation between LG and nss-K+ was significant (r=0.353–0.575, p<0.001) in each sampling period, no clear seasonal trend for the correlation was observed (), probably related to the interruption of K+ from non-biomass burning emissions. Moderate to high correlation of LG with OC and EC were also obtained but without clear seasonal trends. These significant, but not very high, correlations of LG with other components (Abs365, OC, WSOC, EC and K+) documented that the temporal variation of LG was characterised by the biomass burning–related components to some extent.
3.3. Contributions of biomass burning based on tracer method and PMF analysis
While LG is expected to be potentially oxidised by atmospheric oxidants (Hennigan et al., Citation2010; Hoffmann et al., Citation2010), the significant correlations between LG and nss-K+ shown in and indicate that LG still can be considered as a good tracer to estimate biomass burning contribution to carbonaceous aerosol. The (LG/OC)BB ratio has been used to estimate the contribution of biomass burning emissions to carbonaceous aerosols (Zhang et al., Citation2008, Citation2010; Mkoma et al., Citation2013; Ho et al., Citation2014). In this study, we used a widely used (LG/OC)BB value of ~8.2 % in the estimation of biomass burning contributions to OC (OCBB) (Zhang et al., Citation2008, Citation2012; Sang et al., Citation2011; Mkoma et al., Citation2013; Ho et al., Citation2014; Zhu et al., Citation2015). Besides the (LG/OC)BB ratio, the LG to WSOC ratio (LG/WSOC)BB has also been used to estimate biomass burning derived WSOC (WSOCBB) (Ding et al., Citation2013; Feng et al., Citation2013; Yan et al., Citation2015). The (LG/WSOC)BB ratio was reported as 9.94 % and 8.06 % for forest fire plume and rice straw residues open burning, respectively (Ding et al., Citation2008b; Viana et al., Citation2008). Tao et al. (Citation2013) reported higher values of (LG/WSOC)BB from wheat straw burning (23.8–24.2 %) than those from rape straw burning (9.1 %). A value of 17 % from the test burns of rice and wheat straws was used to estimate WSOCBB for summer aerosols in Beijing (Yan et al., Citation2015). The measured values for (LG/WSOC)BB from controlled laboratory burns ranged from 1.7 % for marsh grass to 14.9 % for grass (Sullivan et al., Citation2014) (Supplementary Table 2). According to Yan et al. (Citation2015), the (LG/WSOC)BB ratio of 17 % from Chinese rice and wheat straws burning was applied to estimate WSOCBB in this study.
As can be seen in e and f, both the LG/OC and LG/WSOC values in the ambient PM2.5 were much lower than the reference value for biomass burning smoke (8.2 % for (LG/OC)BB and 17 % for (LG/WSOC)BB) but exhibited very similar seasonal trends with minimum values in summer largely due to the enhanced loss of LG through photochemical oxidation processes. The LG/OC values ranged from 0.14 % to 0.44 % during summer sampling campaigns, which was 0.24 to 0.65 times of the values in other seasons, while the LG/WSOC value was 0.65–1.63 %, which was 0.42 times on average the values in other seasons. The seasonal trend of LG/OC ratio is consistent with those reported for Changdao Island located between Bohai Sea and Yellow Sea in north China (0.12 % vs 0.54–1.0 %, Feng et al., Citation2007), Okinawa (0.03 % vs 0.15–0.46 %) and Chichi-jima (0.062 % vs 0.11–0.38 %) over the western North Pacific (Mochida et al., Citation2010; Zhu et al., Citation2015), four cities in PRD in southern China (0.6 % vs 1.0–1.9 %, Ho et al., Citation2014) and Beijing urban area (1.4 % vs 1.5–3.3 %, Du et al., Citation2014b). In Beijing, however, the maximum values of LG/OC were observed in fall instead of winter due to the intensive post-harvest crop residues burning in the neighbouring regions (Du et al., Citation2014b). Similarly, minimum LG/WSOC values were also reported in summer in four cities in PRD (2.6 % vs 2.8–5.9 %, Ho et al., Citation2014), Beijing urban area (2.2 % vs 3.3–7.8 %, Du et al., Citation2014b), Changdao Island (0.2 % vs 0.96–2.51 %, Feng et al., Citation2007) and Okinawa (0.09 % vs 0.17–0.22 %, Zhu et al., Citation2015).
Using the (LG/OC)BB ratio of 8.2 % and (LG/WSOC)BB ratio of 17 % from the crop straw burning smoke, the calculated relative contributions from biomass burning to OC (OCBB/OC = LG/8.2 %/OC) and WSOC (WSOCBB/WSOC=LG/17 %/WSOC) in each sampling campaign varied in 3.3–13.1 % (av. 8.3 %) and 7.1–22.5 % (av. 15.2 %), respectively (g and h). Using the same (LG/OC)BB ratio of ~8.2 %, the calculated biomass burning contributions to OC were 18–38 % in Beijing (Zhang et al., Citation2008), 6.5–11 % in PRD during spring time (Sang et al., 2011), 7.6–21.6 % in four cities in PRD (Ho et al., Citation2014), 1.9–7.9 % in wet season and 15.8–23.3 % in dry season in PRD region (Zhang et al., Citation2015), 26–68 % in Tanzania (Mkoma et al., Citation2013) and 0.4–5.6 % on Okinawa island (Zhu et al., Citation2015). Using a radiocarbon-based source apportionment method, the contribution of biomass burning emissions to OC in PM2.5 was estimated to be 32–40 % at a regional background site on Hainan Island, South China (Zhang et al., Citation2014). During the 2-yr sampling period, the values of WSOCBB/WSOC were lower than those reported in Shanghai (11–54 %, Feng et al., Citation2013), PRD region during fall-winter period (42–47 %, Ding et al., Citation2013), and urban Beijing in winter and summer (23 % and 16 %, Yan et al., Citation2015). The underestimation of WSOCBB/WSOC in this study may be partly caused by the higher (LG/WSOC)BB of 17 % than those used in Shanghai (12.5 %) and PRD region (9 %) (Ding et al., Citation2013; Feng et al., Citation2013). Radiocarbon measurements of WSOC in PM2.5 at a background site in Yellow Sea in spring with outflow from northern China showed that the non-fossil source fraction (biogenic and biomass burning) to WSOC was estimated to be 30–50 % (Kirillova et al., Citation2014).
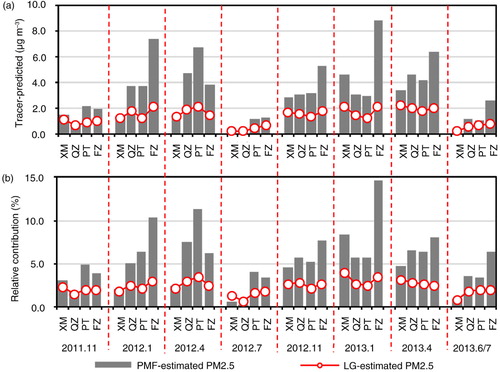
In addition, the impact of biomass burning on ambient PM2.5 could be assessed by using the ratio of LG to PM2.5 (LG/PM2.5)BB for typical biomass (Wang et al., Citation2007; Sang et al., Citation2011). The reported (LG/PM2.5)BB values for wood burning in fireplaces varied from 7.13 % to 22.6 % (Fine et al., Citation2001; Schauer et al., Citation2001), which were much higher than those reported for Chinese cereal straw burning with an average ratio of 4.52 % (Zhang et al., Citation2007). Since crop residues or grass burning are suggested to be the major type of biomass burning based on the measured LG/K+ ratios, the (LG/PM2.5)BB ratio of 4.52 % is used to estimate the biomass burning contributions to ambient PM2.5 at the four site along Fujian coastal line. The results showed that on average 0.67–1.99 % (av. 1.49 %) in summer and 1.44–3.91 % (av. 2.58 %) in other seasons of ambient PM2.5 were due to biomass burning (), which were comparable to the biomass burning estimates (1.6–3.7 %) at the rural site in PRD during springtime (Sang et al., Citation2011), but were lower than the values (3.0–19 %) reported in Guangzhou in October (Wang et al., Citation2007) and in the range of 1.52–12.09 % using bottom-up methodology for biomass burning emission inventory in PRD (Supplementary Table 3). It is noted that the contributions of biomass burning based on the simplified tracer method could be underestimated due to the loss through degradation by hydroxyl radicals, dry/wet deposition and dispersion during the atmospheric transport (Hennigan et al., Citation2010; Zhang et al., Citation2012). It should also be noted that using fixed values of (LG/OC)BB, (LG/WSOC)BB and (LG/PM2.5)BB in different seasons would lead to considerable uncertainty given the known strong dependence of LG and carbonaceous aerosol emissions on biomass burning conditions.
Fig. 6 (a) Mass contributions and (b) relative mass contributions of biomass burning on PM2.5 between LG-predicted and PMF-predicted analysis.
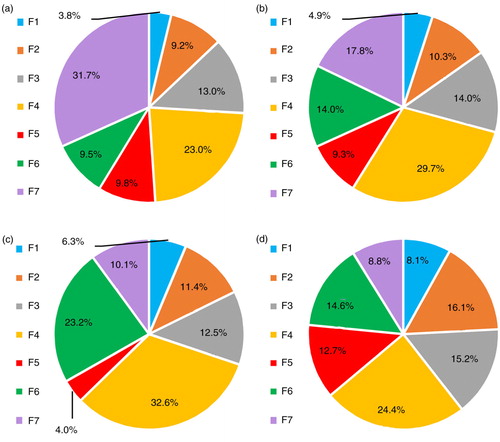
A further source apportionment of PM2.5 was carried out using USEPA PMF 5.0 software and a total of seven factors were resolved (Supplementary Figs. 3–6). The first factor was biomass burning, reflected in the high loading LG (varying from 62 % at FZ to 80 % at PT) but low K+ (varying from 6 % at XM to 18 % at QZ), which further confirmed that LG was a better biomass burning tracer with respect to K+ in this study. Moreover, much lower characteristic values of WSOC (9–17 %) and Abs365 (4–18 %) were observed in this factor, again indicating that biomass burning was a minor contributor of WSOC and brown carbon in PM2.5.
The second factor had the highest characteristic values of V, which is a good marker for fuel oil combustion (Chow and Watson, Citation2002). Huang et al. (2014a, 2014b) attributed the factor with high contribution of V to the residual oil or heavy oil combustion from ship emissions in the coastal cities of Hong Kong and Shenzhen in South China. Moreover, moderate contributions of Na+ were also found in this factor, suggesting that this factor can be determined to be fishing and/or cargo vessel emissions along the coastal line of Taiwan Straits.
The third factor, vehicular emission, was characterised by relatively higher EC with respect to OC and moderate Pb. Relatively higher EC compared to OC has also been reported in vehicular emissions factors resolved by PMF in Shenzhen and Hong Kong in China (Huang et al., Citation2014a, Citation2014b). Since unleaded fuel oil still contains lead derived from the crude oil, the vast fuel oil consumed by vehicles could be an important source of atmospheric lead in China. In this study, 24–38 % of annual PM2.5 associated Pb was attributed to vehicular emissions, which was comparable to the reported values in Xi'an (~30 %, Xu et al., Citation2012b) and Shanghai (~55 %, Li et al., Citation2009).
The fourth factor was distinguished by the high characteristic value of
![]() followed by
followed by
![]() and
and
![]() with a strong seasonal variation peaking in spring or winter and is suggested to be associated with the formation of secondary nitrate and sulphate aerosol. The fifth factor had high characteristic values of crustal elements such as Si, Al, Ca and Ti, so this factor is considered to be soil and road dust.
with a strong seasonal variation peaking in spring or winter and is suggested to be associated with the formation of secondary nitrate and sulphate aerosol. The fifth factor had high characteristic values of crustal elements such as Si, Al, Ca and Ti, so this factor is considered to be soil and road dust.
For the sixth factor, Zn had the prominent characteristic values (52–64 %) probably due to the emission of metallurgical processes (Kulshrestha et al., Citation2009). In addition, garbage burning is another important potential source of atmospheric Zn because more and more municipal wastes are treated by incineration system instead of traditional landfill in this region. Industrial activities and waste incineration have been suggested to be the main sources of Zn particles in Mexico City and Beijing (Moffet et al., Citation2008; Li and Shao, Citation2009). At the PT and FZ sites, relatively high characteristic values of
![]() , WSOC and Abs365 were also observed in this factor documenting the mixed source of secondary aerosol formation and Zn-related sources. At the XM and QZ sites, however, relatively high characteristic values of
, WSOC and Abs365 were also observed in this factor documenting the mixed source of secondary aerosol formation and Zn-related sources. At the XM and QZ sites, however, relatively high characteristic values of
![]() , WSOC and Abs365 were observed in the seventh factor. The seventh factor at the PT and FZ sites was characterised by moderate Zn, Fe and Mn, suggesting that this factor was associated with metallurgical industrial emissions.
, WSOC and Abs365 were observed in the seventh factor. The seventh factor at the PT and FZ sites was characterised by moderate Zn, Fe and Mn, suggesting that this factor was associated with metallurgical industrial emissions.
Annually, the highest contribution of biomass burning to PM2.5 resolved by PMF was 8.08 % at the FZ, followed by 6.32 % at the PT, 4.94 % at the QZ and 3.75 % at the XM ( and Supplementary Table 3). The PMF-estimated annual contributions were lower than those PMF results using total K+ in urban Beijing (11 %, Song et al., Citation2006; 7.0–16.4 %, Song et al., Citation2007; 24 %, Cheng et al., Citation2013; 13 %, Zhang et al., Citation2013c), urban Chengdu (11 %, Tao et al., Citation2014), suburban Hong Kong (19.5 %, Huang et al., Citation2014b) and urban Shenzhen (9.8 %, Huang et al., Citation2014a), and PMF results using LG in the southeastern US (13 %, Zhang et al., Citation2010) (Supplementary Table 3).
Fig. 7 Pie-charts showing the source apportionment of PM2.5 at (a) XM, (b) QZ, (c) PT and (d) FZ. The sources include biomass burning (F1), fuel oil (F2), vehicular emission (F3), secondary nitrate and sulphate aerosol (F4), crustal dust (F5), metallurgical emission at XM and QZ or mixed source of metallurgical emission and secondary sulphate aerosol at PT and FZ (F6), secondary sulphate and organic aerosol at XM and QZ or waste incineration emission at PT and FZ (F7).
As shown in , the average values of LG-estimated PM2.5 were generally lower than those of PMF-estimated, especially in winter and spring sampling periods. The seasonal patterns of biomass burning contributions were consistent with the trends of LG and backward trajectories of air masses or wind direction. Both PMF- and LG-estimated results suggest that biomass burning might not significantly affect the ambient PM2.5 along the coastal line. However, the estimated biomass burning contribution could be underestimated due to the loss of LG during the atmospheric transport (Hennigan et al., Citation2010; Zhang et al., Citation2012). Nevertheless, the influence of WSOC derived from biomass burning can enhance the hygroscopic property of particles in the atmosphere and serve as cloud condensation nuclei. Further studies at more locations on SOA tracers together with LG and 14C measurements are needed to get better understanding of the contributing sources of carbonaceous species in PM2.5 (Ding et al., Citation2013; Feng et al., Citation2013; Liu et al., Citation2013; Kirillova et al., Citation2014; Zhang et al., Citation2014).
4. Conclusions
In this study, the concentrations of LG and WSOC as well as the light absorption at 365 nm of WSOC in PM2.5 were measured during the eight sampling campaigns at four urban sites along the coastal line of southeast China. LG showed large seasonal variations with summer minima and winter/spring maxima. The summer low levels may be largely due to the joint effects of fewer biomass burning activities in the upwind regions of Philippines, enhanced degradation of LG and enhanced thermal convection associated with summer monsoon. On the contrary, biomass burning emissions either from crop residues open field burning or domestic cooking using biofuel in Fujian and Zhejiang coastal regions in winter and spring affect the levels of LG at the four coastal urban sites via northeastern winds. Similar to PM2.5, the day-to-day variations of LG were much influenced by rainfall scavenging. In addition, abrupt local biomass burning activities during traditional Ching-Ming festival could enhance the levels of LG at the urban sites. Although LG correlated well with nss-K+ in each sampling periods, the lack of clear seasonal pattern for the correlations between LG and nss-K+ suggest multiple nss-K+ sources in addition to biomass burning sources. Nevertheless, the minimum LG and nss-K+ concentrations as well as LG/nss-K+ ratios observed in summer appeared to be more influenced by enhanced photochemistry when there was little biomass burning than different types of biomass burning. Higher WSOC/OC and SOC/OC ratios and stronger correlations between WSOC and OC and SOC were obtained in fall and summer when the ambient conditions were favourable for photochemical processes, indicating that WSOC and SOC should have similar formation pathways (i.e. atmospheric photochemical oxidation). The stronger relationship between WSOC and sulphate with respect to that between WSOC and LG seemed to further suggest the importance of secondary formation for WSOC during all the sampling periods. Clear seasonal trends of the contributions of LG to WSOC and OC were obtained with summer minima and spring/winter maxima.
Using the characteristic ratios of (LG/OC)BB and (LG/WSOC)BB in the biomass burning smoke from previous studies, it was estimated that on average 13.6 % of OC and 26 % of WSOC at the four coastal urban sites may be contributed from biomass burning activities. Through the PMF source apportionment model, seven major potential source factors were identified. The factor, characterised by high values of LG (62–80 %), was identified as biomass burning sources. However, much lower characteristic values of WSOC (9–17 %) and Abs365 (4–18 %) associated with this factor suggest that biomass burning contribution to WSOC or brown carbon is less of importance. The biomass burning sources contributed 3.75–8.08 % to the PM2.5 annually, with minimum values in summer and maximum values in spring/winter. Generally, the levels of LG-estimated PM2.5 were lower than those of PMF-estimated PM2.5, especially in spring and winter. Considering the potential loss of LG in ambient PM2.5 as a specific marker for biomass burning and the significant difference between PMF- and LG-estimated results, PMF method is expected to give a reliable estimate of biomass burning contribution. This study also suggests that the influence of biomass burning activities on PM2.5 cannot be ignored along the coastal line of southeast China, especially during the northeastern monsoon season. Owing to the hygroscopic nature of WSOC and the relative high contribution of biomass burning (av. 15.2 %), it is expected that the addition of biomass burning smoke could affect cloud condensation nuclei activity.
Supplementary figures
Download PDF (1.8 MB)5. Acknowledgements
This study is financially supported by the National Natural Science Foundation of China (Project No. 41471390 and 41171365) and the National Key Research and Development Program of China (2016YFC0502901).
Notes
To access the supplementary material to this article, please see Supplementary files under ‘Article Tools’.
References
- Andreae M. O. , Gelencser A . Black carbon or brown carbon? The nature of light-absorbing carbonaceous aerosols. Atmos. Chem. Phys. 2006; 6: 3131–3148.
- Andreae M. O. , Merlet P . Emissions of trace gases and aerosols from biomass burning. Global Biogeochem. Cycle. 2001; 15: 955–966.
- Andreae M. O. , Rosenfeld D . Aerosol-cloud-precipitation interactions. Part I. The nature and sources of cloud-active aerosols. Earth-Sci. Rev. 2008; 89: 13–41.
- Bond T. C., Streets D. G., Yarber K. F., Nelson S. M., Woo J. H., co-authors. A technology-based global inventory of black and organic carbon emissions from combustion. J. Geophys. Res. 2004; 109 D14203. DOI: http://dx.doi.org/10.1029/2003JD003697.
- Chen Y. , Bond T. C . Light absorption by organic carbon from wood combustion. Atmos. Chem. Phys. 2010; 10: 1773–1787.
- Cheng Y. , Engling G. , He K.-B. , Duan F.-K. , Du Z.-Y. , co-authors . The characteristics of Beijing aerosol during two distinct episodes: Impacts of biomass burning and fireworks. Environ. Pollut. 2014; 185: 149–157.
- Cheng Y. , Engling G. , He K.-B. , Duan F.-K. , Ma Y.-L. , co-authors . Biomass burning contribution to Beijing aerosol. Atmos. Chem. Phys. 2013; 13: 7765–7781.
- Chow J. C. , Watson J. G . Review of PM2.5 and PM10 apportionment for fossil fuel combustion and other sources by chemical mass balance receptor model. Energy Fuels. 2002; 16: 222–260.
- Ding X., Wang X., Gao B., Fu X., He Q., co-authors. Tracer based estimation of secondary organic carbon in the Pearl River Delta, South China. J. Geophys. Res. 2012; 117 D05313. DOI: http://dx.doi.org/10.1029/2011JD016596.
- Ding X. , Wang X.-M. , He Q.-F. , Fu X.-X. , Gao B . Water-soluble organic carbon over the Pearl River Delta region during fall-winter: spatial variations and source apportionment. Atmos. Chem. Phys. Discuss. 2013; 13: 13773–13798.
- Ding X. , Zheng M. , Edgerton E. S. , Jansen J. J. , Wang X . Contemporary or fossil origin: split of estimated secondary organic carbon in the southeastern United States. Environ. Sci. Technol. 2008a; 42: 9122–9128.
- Ding X. , Zheng M. , Yu L. , Zhang X. , Weber R. J. , co-authors . Spatial and seasonal trends in biogenic secondary organic aerosol tracers and water-soluble organic carbon in the southeastern United States. Environ. Sci. Technol. 2008b; 42: 5171–5176.
- Du Z. , He K. , Cheng Y. , Duan F. , Ma Y. , co-authors . A yearlong study of water-soluble organic carbon in Beijing II: light absorption properties. Atmos. Environ. 2014a; 89: 235–241.
- Du Z. , He K. , Cheng Y. , Duan F. , Ma Y. , co-authors . A yearlong study of water-soluble organic carbon in Beijing I: sources and its primary vs. secondary nature. Atmos. Environ. 2014b; 92: 514–521.
- Duvall R. M. , Majestic B. J. , Shafer M. M. , Chuang P. Y. , Simoneit B. R. T. , co-authors . The water-soluble fraction of carbon, sulfur, and crustal elements in Asian aerosols and Asian soils. Atmos. Environ. 2008; 42: 5872–5884.
- Engling G. , Lee J. J. , Tsai Y.-W. , Lung S.-C. C. , Chou C. C.-K. , co-authors . Size-resolved anhydrosugar composition in smoke aerosol from controlled field burning of rice straw. Aerosol Sci. Technol. 2009; 43: 662–672.
- Ervens B., Feingold G., Kreidenweis S. M. Influence of water-soluble organic carbon on cloud drop number concentration. J. Geophys. Res. 2005; 110 D18211. DOI: http://dx.doi.org/10.1029/2004JD005634.
- Feng J. , Guo Z. , Chan C. K. , Fang M . Properties of organic matter in PM2.5 at Changdao Island, China-A rural site in the transport path of the Asian continental outflow. Atmos. Environ. 2007; 41: 1924–935.
- Feng J. , Li M. , Zhang P. , Gong S. , Zhong M. , co-authors . Investigation of the sources and seasonal variations of secondary organic aerosols in PM2.5 in Shanghai with organic tracers. Atmos. Environ. 2013; 79: 614–622.
- Feng J. L. , Hu M. , Chan C. K. , Lau P. S. , Fang M. , co-authors . A comparative study of the organic matter in PM2.5 from three Chinese megacities in three different climatic zones. Atmos. Environ. 2006; 40: 3983–3994.
- Fine P. M. , Cass G. R. , Simoneit B. R. T . Chemical characterization of fine particle emissions from fireplace combustion of woods grown in the Northeastern United States. Environ. Sci. Technol. 2001; 35: 2665–2675.
- Fraser M. P. , Lakshmanan K . Using levoglucosan as a molecular marker for the long-range transport of biomass combustion aerosols. Environ. Sci. Technol. 2000; 34: 4560–4564.
- Giannoni M. , Martellini T. , Bubba M. D. , Gambaro A. , Zangrando R. , co-authors . The use of levoglucosan for tracing biomass burning in PM2.5 samples in Tuscany (Italy). Environ. Pollut. 2012; 167: 7–15.
- Graber E. R. , Rudich Y . Atmospheric HULIS: how humic-like are they? A comprehensive and critical review. Atmos. Chem. Phys. 2006; 6: 729–753.
- Guo S. , Hu M. , Guo Q. , Shang D . Comparison of secondary organic aerosol estimation method. Acta Chimica Sinica. 2014; 72: 658–666 (in Chinese with English abstract).
- He M. , Zheng J. , Yin S. , Zhang Y . Trends, temporal and spatial characteristics, and uncertainties in biomass burning emissions in the Pearl River Delta, China. Atmos. Environ. 2011; 45: 4051–4059.
- Hecobian A. , Zhang X. , Zheng M. , Frank N. , Edgerton E. S. , co-authors . Water soluble organic aerosol material and the light-absorption characteristics of aqueous extracts measured over the southeastern United States. Atmos. Chem. Phys. 2010; 10: 5965–5977.
- Hennigan C. J., Sullivan A. P., Collett J. L., Robinson A. L. Levoglucosan stability in biomass burning particles exposed to hydroxyl radicals. Geophys. Res. Lett. 2010; 37 L09806. DOI: http://dx.doi.org/10.1029/2010GL043088.
- Ho K. F., Engling G., Ho S. S. H., Huang R., Lai S., co-authors. Seasonal variations of anhydrosugars in PM2.5 in the Pearl River Delta Region, China. Tellus B. 2014; 66: 22577. DOI: http://dx.doi.org/10.3402/tellusb.v66.22577.
- Hoffmann D. , Tilgner A. , Iinum Y. , Herrmann H . Atmospheric stability of levoglucosan: a detailed laboratory and modeling study. Environ. Sci. Technol. 2010; 44: 694–699.
- Hsu S. C., Liu S. C., Tsai F., Engling G., Lin I. I., co-authors. High wintertime particulate matter pollution over an offshore Island (Kinmen) off southeastern China: an overview. J. Geophys. Res. 2010; 115 D17309. DOI: http://dx.doi.org/10.1029/2009JD013641.
- Huang X. , Yun H. , Gong Z. , Li X. , He L. , co-authors . Source apportionment and secondary organic aerosol estimation of PM2.5 in an urban atmosphere in China. Sci. China Earth Sci. 2014a; 57: 1352–1362.
- Huang X. H. H. , Bian Q. , Ng W. M. , Louie P. K. K. , Yu J. Z . Characterization of PM2.5 major components and source investigation in suburban Hong Kong: a one year monitoring study. Aerosol Air Qual. Res. 2014b; 14: 237–250.
- Kirillova E. N. , Andersson A. , Han J. , Lee M. , Gustafsson Ö . Sources and light absorption of water-soluble organic carbon aerosols in the outflow from northern China. Atmos. Chem. Phys. 2014; 14: 1413–1422.
- Kulshrestha A. , Satsangi P. G. , Masih J. , Taneja A . Metal concentration of PM2.5 and PM10 particles and seasonal variations in urban and rural environment of Agra, India. Sci. Total Environ. 2009; 407: 6196–6204.
- Kunwar B. , Kawamura K . One-year observations of carbonaceous and nitrogenous components and major ions in the aerosols from subtropical Okinawa Island, an outflow region of Asian dusts. Atmos. Chem. Phys. 2014; 14: 1819–1836.
- Lai C. , Liu Y. , Ma J. , Ma Q. , He H . Degradation kinetics of levoglucosan initiated by hydroxyl radical under different environmental conditions. Atmos. Environ. 2014; 91: 32–39.
- Latif M. T. , Anuwar N. Y. , Srithawirat T. , Razak I. S. , Ramli N. A . Composition of levoglucosan and surfactants in atmospheric aerosols from biomass burning. Aerosol Air Qual. Res. 2011; 11: 837–845.
- Li T.-C. , Wu C.-Y. , Chen W.-H. , Yuan C.-S. , Wu S.-P. , co-authors . Diurnal variation and chemical characteristics of atmospheric aerosol particles and their source fingerprints at Xiamen Bay. Aerosol Air Qual. Res. 2013; 13: 596–607.
- Li W., Shao L. Transmission electron microscopy study of aerosol particles from the brown hazes in northern China. J. Geophys. Res. 2009; 114 D09302. DOI: http://dx.doi.org/10.1029/2008JD011285.
- Li X. L. , Zhang Y. X. , Tan M. G. , Liu J. F. , Bao L. M. , co-authors . Atmospheric lead pollution in fine particulate matter in Shanghai, China. J. Environ. Sci. 2009; 21: 1118–1124.
- Liu D. , Li J. , Zhang Y. , Xu Y. , Liu X. , co-authors . The use of levoglucosan and radiocarbon for source apportionment of PM2.5 carbonaceous aerosols at a background site in east China. Environ. Sci. Technol. 2013; 47: 10454–10461.
- Lu Z. , Zhang Q. , Streets D. G . Sulfur dioxide and primary carbonaceous aerosol emissions in China and India, 1996–2010. Atmos. Chem. Phys. 2011; 11: 9839–9864.
- Mkoma S. L. , Kawamura K. , Fu P. Q . Contributions of biomass/biofuel burning to organic aerosols and particulate matter in Tanzania, East Africa, based on analysis of ionic species, organic and elemental carbon, levoglucosan and mannosan. Atmos. Chem. Phys. 2013; 13: 10325–30338.
- Mochida M. , Kawamura K. , Fu P. , Takemura T . Seasonal variation of levoglucosan in aerosols over the western North Pacific and it assessment as a biomass-burning tracer. Atmos. Environ. 2010; 44: 3511–3518.
- Moffet R. C. , de Foy B. , Molina L. T. , Molina M. J. , Prather K. A . Measurement of ambient aerosols in northern Mexico City by single particle mass spectrometry. Atmos. Chem. Phys. 2008; 8: 4499–4516.
- Naeher L. P. , Brauer M. , Lipsett M. , Zelikoff J. T. , Simpson C. D. , co-authors . Wood smoke health effects: a review. Inhal. Toxicol. 2007; 19: 67–106.
- Oanh N. T. K. , Bich T. L. , Tipayarom D. , Manadhar B. R. , Prapat P. , co-authors . Characterization of particulate matter emission from open burning of rice straw. Atmos. Environ. 2011; 45(2): 493–502.
- Park S. S. , Cho S. Y . Tracking sources and behaviors of water-soluble organic carbon in fine particulate matter measured at an urban site in Korea. Atmos. Environ. 2011; 45: 60–72.
- Puxbaum H., Caseiro A., Sánchez-Ochoa A., Kasper-Giebl A., Claeys M., co-authors. Levoglucosan levels at background sites in Europe for assessing the impact of biomass combustion on the European aerosol background. J. Geophys. Res. 2007; 112 D23S05. DOI: http://dx.doi.org/10.1029/2006JD008114.
- Reche C. , Viana M. , Amato F. , Alastuey A. , Moreno T. , co-authors . Biomass burning contributions to urban aerosols in a coastal Mediterranean City. Sci. Total Environ. 2012; 427–428: 175–190.
- Sang X.-F. , Chan C.-Y. , Engling G. , Chan L.-Y. , Wang X.-M. , co-authors . Levoglucosan enhancement in ambient aerosol during springtime transport events of biomass burning smoke to southeast China. Tellus B. 2011; 63: 129–139.
- Schauer J. J. , Kleeman M. J. , Cass G. R. , Simoneit B. R. T . Measurement of emissions from air pollution sources. 3. C1-C29 organic compounds from fireplace combustion of wood. Environ. Sci. Technol. 2001; 39: 1716–1728.
- Seinfeld J. H. , Pandis S. N . Atmospheric Chemistry and Physics: From Air Pollution to Climate Change. 2nd ed . 2006; Hoboken, NJ: John Wiley & Sons, Inc..
- Simoneit B. R. T . Biomass burning-a review of organic tracers for smoke from incomplete combustion. Appl. Geochem. 2002; 17: 129–162.
- Song Y. , Zhang Y. , Xie S. , Zeng L. , Zheng M. , co-authors . Source apportionment of PM2.5 in Beijing by Positive Matrix Factorization. Atmos. Environ. 2006; 40: 1526–1537.
- Song Y. , Tang X. , Xie S. , Zhang Y. , Wei Y. , co-authors . Source apportionment of PM2.5 in Beijing in 2004. J. Hazard. Mater. 2007; 146: 124–130.
- Streets D. G., Yarber K. F., Woo J. H., Carmichael G. R. Biomass burning in Asia: annual and seasonal estimates and atmospheric emissions. Global Biogeochem. Cycles. 2003; 17(4): 1099. DOI: http://dx.doi.org/10.1029/2003GB002040.
- Sullivan A. P., Holden A. S., Patterson L. A., McMeeking G. R., Kreidenweis S. M., co-authors. A method for smoke marker measurements and its potential application for determining the contribution of biomass burning from wildfires and prescribed fires to ambient PM2.5 organic carbon. J. Geophys. Res. 2008; 113 D22302. DOI: http://dx.doi.org/10.1029/2008JD010216.
- Sullivan A. P. , May A. A. , Lee T. , McMeeking G. R. , Kreidenweis S. M. , co-authors . Airborne characterization of smoke marker ratios from prescribed burning. Atmos. Chem. Phys. 2014; 14: 10535–10545.
- Sullivan A. P., Weber R. J., Clements A. L., Turner J. R., Bae M. S., co-authors. A method for on-line measurement of water-soluble organic carbon in ambient aerosol particles: results from an urban site. Geophys. Res. Lett. 2004; 31 L13105. DOI: http://dx.doi.org/10.1029/2004GL019681.
- Tao J. , Gao J. , Zhang L. , Che H. , Zhang Z. , co-authors . PM2.5 pollution in a megacity of southwest China: source apportionment and implication. Atmos. Chem. Phys. 2014; 14: 8679–8699.
- Tao J. , Zhang L. , Engling G. , Zhang R. , Yang Y. , co-authors . Chemical composition of PM2.5 in an urban environment in Chengdu, China: importance of springtime dust storms and biomass burning. Atmos. Res. 2013; 122: 270–283.
- Taraniuk I., Kostinski A. B., Rudich Y. Enrichment of surface-active compounds in coalescing cloud drops. Geophys. Res. Lett. 2008; 35 L19810. DOI: http://dx.doi.org/10.1029/2008GL034973.
- Tian D. , Hu Y. T. , Wang Y. H. , Boylan J. W. , Zheng M. , co-authors . Assessment of biomass burning emissions and their impacts on urban and regional PM2.5, a Georgia case study. Environ. Sci. Technol. 2009; 43: 299–305.
- Tsai Y. I. , Sopajaree K. , Chotruksa A. , Wu H.-C. , Kuo S.-C . Source indicators of biomass burning associated with inorganic salts and carboxylates in dry season ambient aerosol in Chiang Mai Basin, Thailand. Atmos. Environ. 2013; 78: 93–104.
- Tsai Y. I. , Wu P.-L. , Hsu Y.-T. , Yang C.-R . Anhydrosugar and sugar alcohol organic markers associated with carboxylic acids in particulate matter from incense burning. Atmos. Environ. 2010; 44: 3708–3718.
- Viana M. , López J. M. , Querol X. , Alastuey A. , García-Gacio D. , co-authors . Tracers and impact of open burning of rice straw residues on PM in Eastern Spain. Atmos. Environ. 2008; 42: 1941–1957.
- Wang Q. , Shao M. , Liu Y. , William K. , Paul G. , co-authors . Impact of biomass burning on urban air quality estimated by organic tracers: Guangzhou and Beijing as cases. Atmos. Environ. 2007; 41: 8380–8390.
- Wang W. , Maenhaut W. , Yang W. , Liu X. , Bai Z. , co-authors . One-year aerosol characterization study for PM2.5 and PM10 in Beijing. Atmos. Pollut. Res. 2014; 5: 554–562.
- Wang Y. , Zhang Q. Q. , He K. , Zhang Q. , Chai L . Sulfate-Nitrate-Ammonium Aerosols over China: response to 2000–2015 emission changes of Sulfur Dioxide, Nitrogen Oxides, and Ammonia. Atmos. Chem. Phys. 2013; 13: 2635–2652.
- Weber R. J., Sullivan A. P., Peltier R. E., Russell A., Yan B., co-authors. A study of secondary organic aerosol formation in the anthropogenic-influenced southeastern United States. J. Geophys. Res. 2007; 112 D13302. DOI: http://dx.doi.org/10.1029/2007JD008408.
- Wu S.-P. , Schwab J. , Liu B.-L. , Li T.-C. , Yuan C.-S . Seasonal variations and source identification of selected organic acids associated with PM10 in the coastal area of Southeastern China. Atmos. Res. 2015b; 155: 37–51.
- Wu S.-P. , Schwab J. , Yang B.-Y. , Zheng A. , Yuan C.-S . Two-years PM2.5 observations at four urban sites along the coast of southeastern China. Aerosol Air Qual. Res. 2015a; 15: 1799–1812.
- Wu S.-P. , Yang B.-Y. , Wang X.-H. , Yuan C.-S. , Hong H.-S . Polycyclic aromatic hydrocarbons in the atmosphere of two subtropical cities in Southeast China: seasonal variation and gas/particle partitioning. Aerosol Air Qual. Res. 2014; 14: 1232–1246.
- Xu H. M. , Cao J. J. , Ho K. F. , Ding H. , Han Y. M. , co-authors . Lead concentrations in fine particulate matter after the phasing out of leaded gasoline in Xi'an, China. Atmos. Environ. 2012b; 46: 217–224.
- Xu L. , Chen X. , Chen J. , Zhang F. , He C. , co-authors . Seasonal variations and chemical composition of PM2.5 aerosol in the urban area of Fuzhou, China. Atmos. Res. 2012a; 104–105: 264–272.
- Yan C. , Zheng M. , Sullivan A. P. , Bosch C. , Desyaterik Y. , co-authors . Chemical characteristics and light-absorbing property of water-soluble organic carbon in Beijing: Biomass burning contributions. Atmos. Environ. 2015; 121: 4–12.
- Yan X. Y. , Ohara T. , Akimoto H . Bottom-up estimate of biomass burning in mainland China. Atmos. Environ. 2006; 40: 5262–5273.
- Zhang R. , Jing J. , Tao J. , Hsu S.-C. , Wang G. , co-authors . Chemical characterization and source apportionment of PM2.5 in Beijing: seasonal perspective. Atmos. Chem. Phys. 2013c; 13: 7053–7074.
- Zhang T. , Claeys M. , Cachier H. , Dong S. , Wang W. , co-authors . Identification and estimation of the biomass burning contribution to Beijing aerosol using levoglucosan as a molecular marker. Atmos. Environ. 2008; 42: 7013–7021.
- Zhang X. , Hecobian A. , Zheng M. , Frank N. H. , Weber R. J . Biomass burning impact on PM2.5 over the southeastern US during 2007: integrating chemically speciated FRM filter measurements, MODIS fire counts and PMF analysis. Atmos. Chem. Phys. 2010; 10: 6839–6853.
- Zhang Y. , Obrist D. , Zielinska B. , Gertler A . Particulate emissions from different types of biomass burning. Atmos. Environ. 2013a; 72: 27–35.
- Zhang Y. , Shao M. , Lin Y. , Luan S. , Mao N. , co-authors . Emission inventory of carbonaceous pollutants from biomass burning in the Pearl River Delta Region, China. Atmos. Environ. 2013b; 76: 189–99.
- Zhang Y.-L. , Li J. , Zhang G. , Zotter P. , Huang R.-J. , co-authors . Radiocarbon-based source apportionment of carbonaceous aerosols at a regional background site on Hainan Island, south China. Environ. Sci. Technol. 2014; 48: 2651–2659.
- Zhang Y.-N. , Zhang Z.-S. , Chan C.-Y. , Engling G. , Sang X.-F. , co-authors . Levoglucosan and carbonaceous species in the background aerosol of coastal southeast China: case study on transport of biomass burning smoke from the Philippines. Environ. Sci. Pollut. Res. 2012; 19: 244–255.
- Zhang Y.-X. , Shao M. , Zhang Y.-H. , Zeng L.-M. , He L.-Y. , co-authors . Source profiles of particulate organic matters emitted from cereal straw burnings. J. Environ. Sci. 2007; 19: 167–175.
- Zhang Z. , Gao J. , Engling G. , Tao J. , Chai F. , co-authors . Characteristics and applications of size-segregated biomass burning tracers in China's Pearl River Delta region. Atmos. Environ. 2015; 102: 290–301.
- Zhu C. , Kawamura K. , Kunwar B . Effect of biomass burning over the western North Pacific Rim: wintertime maxima of anhydrosugars in ambient aerosols from Okinawa. Atmos. Chem. Phys. 2015; 15: 1959–1973.