
Abstract
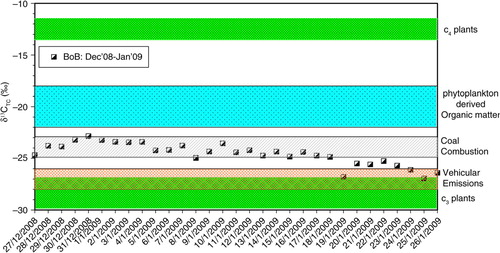
This study reports on stable carbon (δ13CTC) and nitrogen (δ15NTN) isotopic composition of total carbon and nitrogen (TC and TN) in the fine mode aerosols (PM2.5; N=31) collected over the Bay of Bengal (BoB). The samples represent two distinct wind regimes during the cruise (27 December 2008–28 January 2009); one from the Indo-Gangetic Plain (referred as IGP-outflow) and another from Southeast Asia (SEA-outflow). The PM2.5 samples from the IGP-outflow show higher δ13CTC (−25.0 to −22.8 ‰; −23.8±0.6 ‰) than those from the SEA-outflow (−27.4 to −24.7 ‰; −25.3±0.9 ‰). Similarly, δ15NTN varied from +11.8 to +30.6 ‰ (+20.4±5.4 ‰) and +10.4 to +31.7 ‰ (+19.4±6.1 ‰) for IGP- and SEA-outflows, respectively. Based on the literature data, MODIS-derived fire hotspots and back trajectories, we infer that higher δ13CTC in the IGP-outflow is predominantly associated with fossil fuel and biofuel combustion. In contrast, contribution of primary organic aerosols from the combustion of C3 plants or secondary organic aerosol (SOA) formation from biomass/biofuel-burning emissions (BBEs) can explain the lower δ13CTC values in the SEA-outflow. This inference is based on the significant linear correlations among δ13CTC, water-soluble organic carbon and non-sea-salt potassium (nss-K+, a proxy for BBEs) in the SEA-outflow. A significant linear relationship of δ15N with
![]() and equivalent mass ratio of
and equivalent mass ratio of
![]() /
/
![]() is evident in both the continental outflows. Since
is evident in both the continental outflows. Since
![]() abundance dominates the TN over the BoB (>90 %), atmospheric processes affecting its concentration in fine mode aerosols can explain the observed large variability of δ15NTN.
abundance dominates the TN over the BoB (>90 %), atmospheric processes affecting its concentration in fine mode aerosols can explain the observed large variability of δ15NTN.
To access the supplementary material to this article, please see Supplementary files under ‘Article Tools’.
1. Introduction
The rapidly growing human activities and significant increase in emissions of airborne pollutants from South Asia are of considerable interest owing to their impact on regional climate (Ramanathan et al., Citation2001a; Lawrence and Lelieveld, Citation2010). In this context, organic aerosols are considered to be one of the important components of atmospheric particulate matter for their crucial role in regional radiative forcing through direct and indirect effects (Kanakidou et al., Citation2005; Jimenez et al., Citation2009). Several studies have attempted to characterize the sources, transport and transformation pathways of organic aerosols over South Asia (Jayaraman et al., Citation1998; Novakov et al., Citation2000; Lelieveld et al., Citation2001; Ramanathan et al., Citation2001b; Mayol-Bracero et al., Citation2002a; Rengarajan et al., Citation2007; Lawrence and Lelieveld, Citation2010; Ram et al., Citation2010; Rajput et al., Citation2011; Srinivas and Sarin, Citation2013a, Citation2014). Jimenez et al. (Citation2009) demonstrated that the identified fraction of atmospheric organic aerosols is no more than 20–30 % of total organic matter. These observations emphasize our ability to assess the impact of organic aerosols on climate forcing, mainly due to limited observations. Therefore, the chemical characterization of various organics and their sources from different geographical locations could provide a better means to reassess their realistic aerosol radiative forcing (Jacobson, Citation2012).
Recent studies on stable isotopic composition of bulk carbon and nitrogen (δ13C and δ15N) of airborne particulatematter have demonstrated their usefulness to apportion the sources and formation pathways of organic aerosols (Kawamura et al., Citation2004; Aggarwal and Kawamura, Citation2008; Narukawa et al., Citation2008; Pavuluri et al., Citation2011; Aggarwal et al., Citation2013; Kirillova et al., Citation2013). Previous studies have used δ13C and δ15N of bulk particulate matter to assess the contribution of biomass/biofuel-burning sources (Martinelli et al., Citation2002; Kundu et al., Citation2006; Ometto et al., Citation2006; Widory, Citation2007; Aggarwal and Kawamura, Citation2008; Agnihotri et al., Citation2011; Aggarwal et al., Citation2013; Mkoma et al., Citation2014). Although the stable isotopic composition of OA produced from various sources are significantly different, several processes can affect their δ13C and δ15N, viz., ageing of air masses, condensation/evaporation of volatile organic compounds (VOCs) on/from a pre-existing particles, oxidation or chemical reactions of primary organic aerosols (POA) by O3 or NO x (Kirillova et al., Citation2013 and references therein).
However, studies from South Asia are limited in assessing the stable C- and N-isotopic composition of ambient aerosols (Agnihotri et al., Citation2011; Pavuluri et al., Citation2011; Hegde and Kawamura, Citation2012; Aggarwal et al., Citation2013). Based on the physicochemical properties of aerosols, earlier studies have demonstrated the continental impact from South and Southeast Asia over the northern Indian Ocean (NIO) (Lelieveld et al., Citation2001; Ramanathan et al., Citation2001b; Mayol-Bracero et al., Citation2002a). Furthermore, the predominant continental influence on the eastern part of the NIO [the Bay of Bengal (BoB)] has been emphasized by subsequent studies compared to that over the Arabian Sea, western side of the NIO (Kumar et al., Citation2008; Kedia et al., Citation2010; Sarin et al., Citation2010; Srinivas et al., Citation2011a; Srinivas and Sarin, Citation2012, Citation2013a). These studies have further suggested that the strength of the continental sources decreases from winter (December–February) to spring–intermonsoon (March–April) (Srinivas et al., Citation2011b; Srinivas and Sarin, Citation2013b, Citation2014).
A recent study by Agnihotri et al. (Citation2011) has assessed stable C- and N-isotopic composition of marine aerosols from the BoB and Arabian Sea during spring to intermonsoon (March–May 2006). However, no single study deals with the assessment of δ13C of bulk carbon and δ15N of total nitrogen in marine aerosols from the BoB during the wintertime when marine atmospheric boundary layer (MABL) is influenced by continental air masses from South and Southeast Asia. Here, we have studied the stable isotopic composition of total carbon and nitrogen (TC and TN) of fine mode aerosols (PM2.5) collected from the BoB during winter season. We have also made a comparison of our results from the Bay region with those from the nearby continental sites as well as other oceanic regions. The overall objective of this study is to understand the measured stable C- and N-isotopic composition of aerosol-TC and TN, respectively, in terms of their source contribution as well as changes in composition (if any) during atmospheric transport to the oceanic region (BoB) located downwind of pollution sources.
2. Methodology
2.1. Cruise track and prevailing meteorology
Aerosol samples (PM2.5) were collected during a cruise (SK-254) conducted in the BoB as part of Indian national programme on integrated campaign of aerosols, trace gases and radiation budget (ICARB) during 27 December 2008–28 January 2009. During the study period, prevailing winds were mostly north-easterly/westerly. The shallow boundary layer along with the relatively weak winds brings continental air masses to the MABL during the wintertime (December–February). We obtained the meteorological parameters on board (viz., relative humidity, ambient temperature, wind speed and wind direction) every hour, which were averaged for daily means. The daily average of relative humidity, ambient temperature and wind speed during the cruise varied from 49.1 to 79.8 %, 22.3 to 26.8 °C and 1.2 to 6.3 m s−1, respectively (Kumar et al., Citation2010). Further details on wind regimes and meteorological conditions are described in our earlier publications (Kumar et al., Citation2010; Srinivas et al., Citation2011b).
2.2. Aerosol sampling and measurement of chemical constituents
In this study, we used a total number of 31 PM2.5 samples that were collected using a high volume air sampler (HVS, Thermo-Anderson Tech., flow rate: 1.13 m3 minute−1) on board ORV Sagar Kanya. The sampler was placed on the upper deck in front of the ship's navigation room in order to avoid the contamination from the ship's smoke stack and was operated when the wind direction is from the bow and ship cruising at a speed of more than 10 knots h−1. The sampler was calibrated before and after the cruise, and the variation in the flow rate was within 3 %. On average, the samples were collected for a period of ~20 h, and the volume of filtered air ranged between 1300 and 1400 m3. All PM2.5 samples were collected on pre-combusted (at 450 °C, for 3–4 h) quartz filters (PALLFLEX®™, 2500 QAT-UP). After collection, aerosol filters were wrapped in aluminium foils, sealed in zip-lock bags and stored in deep freezer at −19 °C until the chemical analyses.
In PM2.5, water-soluble inorganic ions (Na+,
![]() , K+, Mg2+, Ca2+, Cl−,
, K+, Mg2+, Ca2+, Cl−,
![]() and
and
![]() ) were determined withDionex-500 ion chromatograph equipped with suppressed conductivity detector (Srinivas et al., Citation2011b). Similarly, carbonaceous components (EC/OC) were measured on Sunset EC/OC analyser using NIOSH-5040 method (Srinivas and Sarin, Citation2013a), whereas water-soluble organic carbon (WSOC) was measured using Schimadzu TOC-5000 analyser (Srinivas and Sarin, Citation2013a). A part of the chemical composition data (K+,
) were determined withDionex-500 ion chromatograph equipped with suppressed conductivity detector (Srinivas et al., Citation2011b). Similarly, carbonaceous components (EC/OC) were measured on Sunset EC/OC analyser using NIOSH-5040 method (Srinivas and Sarin, Citation2013a), whereas water-soluble organic carbon (WSOC) was measured using Schimadzu TOC-5000 analyser (Srinivas and Sarin, Citation2013a). A part of the chemical composition data (K+,
![]() ,
,
![]() ,
,
![]() , EC, OC and WSOC) from earlier publications have been used here to support the inferences related to stable C- and N-isotopic composition of PM2.5 over the BoB. For more details, see our earlier publications (Rengarajan et al., Citation2007; Kumar et al., Citation2010; Srinivas and Sarin, Citation2014).
, EC, OC and WSOC) from earlier publications have been used here to support the inferences related to stable C- and N-isotopic composition of PM2.5 over the BoB. For more details, see our earlier publications (Rengarajan et al., Citation2007; Kumar et al., Citation2010; Srinivas and Sarin, Citation2014).
To determine the blank levels, one quarter of the filter aliquot (ca. ~100 cm2) was extracted with 50 ml of Milli-Q water (specific resistivity ~18.2 MΩ-cm) like samples and the extracts were measured for water-soluble inorganic constituents. Except for Na+, K+ and Cl−, no signals were detected on ion chromatogram. The detection limits, as defined by three times of standard deviation of the concentrations of procedural filter blanks (N=8) normalized to average filtered volume of air for the PM2.5 (~1400 m3), were 30 ng m−3 for Na+, 18 ng m−3 for K+ and 24 ng m−3 for Cl−. We have corrected the K+ and
![]() concentrations in PM2.5 for the sea-salt contribution to derive the non-sea-salt (nss) K+ and
concentrations in PM2.5 for the sea-salt contribution to derive the non-sea-salt (nss) K+ and
![]() , respectively, using measured Na+ in aerosols (Keene et al., Citation1986). All PM2.5 samples were analysed to assess the mass concentrations of total carbon and nitrogen (TC and TN) along with their stable isotopic composition (δ13CTC and δ15NTN) using an elemental analyser (EA) and EA/isotope ratio mass spectrometer as reported in Kawamura et al. (Citation2004) and Kundu et al. (Citation2010).
, respectively, using measured Na+ in aerosols (Keene et al., Citation1986). All PM2.5 samples were analysed to assess the mass concentrations of total carbon and nitrogen (TC and TN) along with their stable isotopic composition (δ13CTC and δ15NTN) using an elemental analyser (EA) and EA/isotope ratio mass spectrometer as reported in Kawamura et al. (Citation2004) and Kundu et al. (Citation2010).
2.3. Stable C- and N-isotopic composition
For this study, stable isotopic composition of δ13CTC and δ15NTN were determined using an EA interfaced online to an isotope ratio mass spectrometer (EA/irMS, model: Carlo Erba NA 1500 EA+Finnigan MAT Delta Plus), and the protocol described in Kawamura et al. (Citation2004). Briefly, the filter aliquot (ca. 2.0 cm in diameter) of aerosol sample was sealed in a tin cup, which is pre-cleaned with acetone to remove organic contaminants and dried prior to use, and introduced into EA where it is oxidized in the combustion column packed with copper oxide (CuO) filings at a temperature of 1020 °C. The evolved gases (CO2 and NO
x
) were subsequently introduced into a reduction column, where NO
x
is converted to molecular N2 and thereby separated by a gas chromatograph equipped within EA. To measure stable isotopic composition of evolved CO2 and N2, an interface (ConFlo II) is used to transfer the gases from EA to irMS. The measured isotopic composition of aerosol-TC and TN was expressed as δ13CTC and δ15NTN relative to Pee Dee Beleminite carbon standard and atmospheric N2, respectively, using the following equations:
2.4. Quality assurance
Prior to the measurements of δ13CTC and δ15NTN, instrumental blanks are checked with pre-cleaned tin cups (N=3) and a five-point calibration, having standard amount between 0.2 and 0.6 mg of acetanilide (Thermo Scientific) with known stable carbon and nitrogen isotopic composition as −27.26 ‰ (Cao et al., Citation2016) and +11.88 ‰ (Kundu et al., Citation2010), respectively. Filter (lab+field) blanks were also analysed and the analytical signal of samples was suitably corrected for blanks using isotopic mass balance equations described in Turekian et al. (Citation2003). The overall analytical uncertainties in the measurement of δ13CTC and δ15NTN were 0.15 ‰ and 0.25 ‰, respectively, as ascertained by repeat analyses of acetanilide and samples, being consistent with those reported in Kawamura et al. (Citation2004). The uncertainties associated with each measurement were propagated and discussed when comparing the significant differences between the Indo-Gangetic Plain (IGP)- and Southeast Asia (SEA)-outflows (Supplementary Table 1).
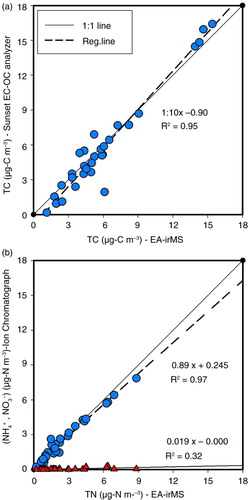
In this study, TC concentrations (OC+EC) were measured in PM2.5 soon after their collection on Sunset EC–OC analyser using NIOSH protocol (Rengarajan et al., Citation2007). These measurements show consistency with total carbon content obtained from the EA-irMS. This comparison clearly demonstrates that artefacts, if any, related to shelf storage of aerosol filters have not caused any error in the isotopic measurements. Similarly, the closure of mass concentration of water-soluble inorganic nitrogen (mainly as
![]() -N; >90 %) in the TN () further establishing the consistency between previous measurements (Srinivas et al., Citation2011b) and this study. This observation clearly demonstrates the lack of artefacts related to the storage of aerosol filters.
-N; >90 %) in the TN () further establishing the consistency between previous measurements (Srinivas et al., Citation2011b) and this study. This observation clearly demonstrates the lack of artefacts related to the storage of aerosol filters.
3. Results and discussion
3.1. Temporal variability
During a winter cruise, the PM2.5 collected over the N-BoB is influenced by the continental outflow from the IGP-outflow (27 December 2008 to 10 January 2009, ), whereas those sampled over the S-BoB has influence from SEA-outflow (11–28 January 2009; ). This is inferred based on the origin of 7-d isentropic air mass back trajectories (AMBTs) for the sampling days, computed using hybrid single particle Lagrangian-integrated trajectory model, HYSPLIT-4 (Draxler et al., Citation1999). The impact of IGP- and SEA-outflows on the chemical composition of aerosols over the BoB is a conspicuous seasonal meteorological phenomenon, occurring in winter and spring, documented through large-scale field campaigns (INDOEX and ICARB-I & II) using various optical and chemical properties of aerosols (Kumar et al., Citation2010; Lawrence and Lelieveld, Citation2010; Srinivas et al., Citation2011b).
Fig. 1 Seven-day isentropic air mass back trajectories (AMBTs) computed using hybrid single particle Lagrangian-integrated trajectory model, HYSPLIT-4 (Draxler et al., Citation1999) for the sampling days (27 December 2008 to 26 January 2009) along the cruise track in the Bay of Bengal. Blue pins and red dots over the Indo-Gangetic Plain represent the locations of coal-fired power plants and MODIS-derived fire spots, respectively.
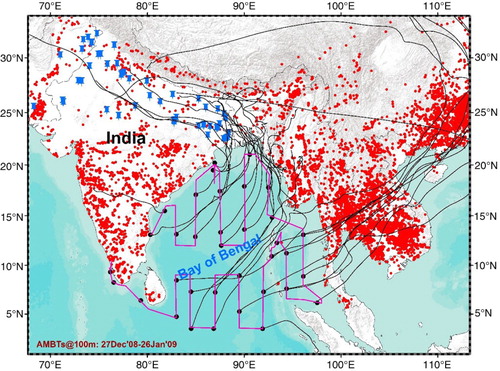
Organic aerosols in winter over the IGP are mostly emitted from the fossil fuel combustion sources (FF-comb) and biomass/biofuel-burning emissions (BBEs) (wood/crop-residue combustion) (Sudheer and Sarin, Citation2008; Rajput et al., Citation2011; Srinivas and Sarin, Citation2014; Rastogi et al., Citation2015). However, with the exception of a few studies emphasizing the contribution of organic aerosols from the forest fires over South-east Asia (Narukawa et al., Citation1999; Streets et al., Citation2003; Srinivas and Sarin, Citation2013a), no such detailed information exists in the literature about other pollution sources. To understand the influence of different pollution sources to atmospheric organic aerosols sampled over the BoB (this study), we have superimposed the locations of coal-fired thermal power plants in the IGP (see blue pins in ) and MODIS-derived fire count data (red dots in ) from South and Southeast Asia on the back trajectory cluster information ().
From , it is implicit that the SEA-outflow has a contribution from intense forest fires occurring over Indonesia, Thailand, Vietnam and Myanmar. However, no such influence from BBEs was observed in the IGP-outflow during winter. On the other hand, the IGP-outflow has a contribution of organic aerosols from coal-fired thermal power plants in the IGP [also referred as ‘coal belt of India’ (Prasad et al., Citation2006; Nair et al., Citation2007)]. Besides this, the residential biofuel (wood) combustion emissions (particularly significant in winter) also contribute to organic aerosols in the IGP-outflow (Gustafsson et al., Citation2009; Ram and Sarin, Citation2012). Therefore, we try to infer the relative significance of various sources and compositional changes in the continental outflows (consisting of emissions from coal-fired power plants, vehicular traffic and biomass burning) by comparing the observed δ13CTC over the BoB with source-specific signatures and regression analysis between isotopic composition and other chemical tracers measured in the MABL.
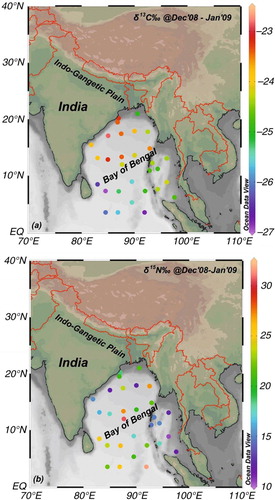
TC and TN in PM2.5 exhibit strong latitudinal variability with relatively high concentrations in the IGP-outflow (close to the continent) compared to those in the SEA-outflow (open ocean samples; ). Similar north (high in the IGP-outflow) to south (low in the SEA-outflow) concentration gradient is also noteworthy for other chemical species in the PM2.5 (e.g. OC, EC, WSOC and
![]() ; Supplementary Fig. 1). The δ13CTC has shown pronounced spatial variability over the BoB () with significantly higher δ13CTC (t-score: 5.5, df=29; p<0.001) in the IGP-outflow (−25.0 to −22.8 ‰; average −23.8±0.6 ‰) than SEA-outflow (−26.9 to −24.2 ‰; average −25.3±0.9 ‰). This discrepancy is due to varying contributions of aerosol-TC from FF-comb and BBEs over the North and South BoB, respectively. However, no significant differences were observed for δ15NTN (t-score: 0.5, df=29, p>0.05) in both the outflows (IGP: +20.4±5.4 ‰ and SEA: +19.4±6.1 ‰; ).
; Supplementary Fig. 1). The δ13CTC has shown pronounced spatial variability over the BoB () with significantly higher δ13CTC (t-score: 5.5, df=29; p<0.001) in the IGP-outflow (−25.0 to −22.8 ‰; average −23.8±0.6 ‰) than SEA-outflow (−26.9 to −24.2 ‰; average −25.3±0.9 ‰). This discrepancy is due to varying contributions of aerosol-TC from FF-comb and BBEs over the North and South BoB, respectively. However, no significant differences were observed for δ15NTN (t-score: 0.5, df=29, p>0.05) in both the outflows (IGP: +20.4±5.4 ‰ and SEA: +19.4±6.1 ‰; ).
Table 1. Statistical description of mass concentrations (in µg m−3) of chemical constituents and stable carbon and nitrogen isotopic compositions (δ15N and δ13C) in PM2.5 collected over the Bay of Bengal during January 2009
In comparison to δ13CTC, δ15NTN show large variability in both outflows (IGP: +11.8 to +31.6 ‰; SEA: +10.4 to +31.7 ‰; ). The wide spread combustion of biofuels and agricultural crop residue from South and Southeast Asia is a major source of aerosol-TN over the BoB during winter and spring seasons (Srinivas et al., Citation2011b). In this regard, Turekian et al. (Citation1998) documented that unlike δ13CTC, δ15NTN in particles emitted from the combustion of C3 and C4 vegetation overlap within spread of the data. However, their study suggested that changes in combustion temperature during BBEs lead to large variability in the stable N-isotopic composition of aerosols. This is partly due to accessibility of various nitrogenous pools in the source plant at different temperatures during biomass combustion (Turekian et al., Citation1998). Therefore, observed large variability in the δ15NTN over the BoB is attributed to variations in the combustion temperature during BBEs in the continental outflows (i.e. wood burning in the IGP or forest fires in the SEA).
Although wood-burning emissions usually involved with low-temperature combustion processes than forest fires (i.e. high-temperature combustion), however, we observe no significant differences (t-score: 0.5, df=29, p>0.05) in the mean δ15NTN between both the outflows (IGP: +20.4±5.4 ‰ and SEA: +19.4±6.1 ‰; ). This feature indicates that δ15NTN over the BoB in winter season is mostly governed by the atmospheric processes affecting aerosol-TN concentrations during long-range transport rather than contribution from different sources (i.e., δ15NTN is ‘process dependent’ over the BoB). From , it is obvious that the concentrations of water-soluble inorganic nitrogen species (
![]() and
and
![]() ) in the MABL account for more than 90 % of the TN mass. Therefore, processes affecting the relative abundances of
) in the MABL account for more than 90 % of the TN mass. Therefore, processes affecting the relative abundances of
![]() and
and
![]() in aerosol-TN might control the δ15NTN (Section 3.3 for a more detailed discussion).
in aerosol-TN might control the δ15NTN (Section 3.3 for a more detailed discussion).
Fig. 2 (a) Comparison of mass concentrations of total carbon (TC) measured by elemental analyser coupled to isotope ratio mass spectrometer (EA-irMS) versus estimated TC concentration based on the atmospheric abundances of elemental and organic carbon (as EC+OC, measured on Sunset Carbon Analyzer), and (b) correlation plot between total nitrogen (TN) measured by EA-irMS and water-soluble inorganic nitrogen (i.e.
![]()
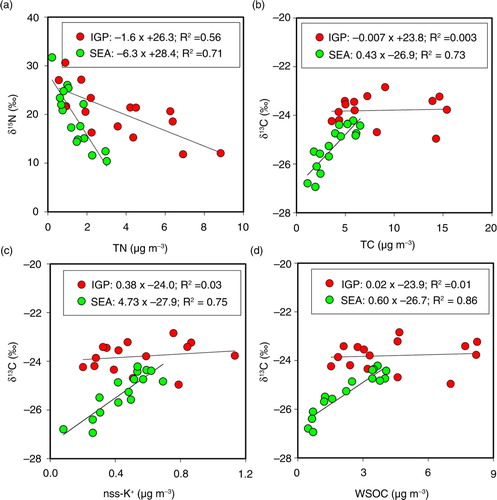
The sudden change (t-score: 5.5, df=29; p<0.001) in wind regimes from the IGP- to SEA-outflow was characterized by distinct δ13CTC over the BoB (−23.8±0.6 ‰ and −25.3±0.9 ‰, respectively). This observation indicates that stable C-isotopic composition of aerosols over the BoB is ‘source dependent’. A significant linear relationship is noteworthy between TN and δ15NTN in both the IGP- and SEA-outflows (a). However, such a significant linear relationship between TC and δ13CTC is observed only in the SEA-outflow but not in the IGP-outflow (b). This could be due to variability in the sources of aerosol-TN and TC in the IGP-outflow (wood burning and FF-comb, respectively) than those in the SEA-outflow (forest fires). Thus, a significant depletion of 13C in TC for the SEA-outflow compared with that for the IGP-outflow, perhaps, indicates a source-specific contribution from BBEs in Southeast Asia during the cruise.
Overall, 13C enrichment and depletion of TC in the IGP- and SEA-outflows, respectively, can be explained based on the differences in the source contribution of carbonaceous species and their transport history to the BoB. A noteworthy feature of the data is evident from a change in the TC concentration in the IGP-outflow with no variability in δ13CTC (b). This feature suggests that dominant contribution of aerosol-TC in the IGP-outflow is derived from point sources in the IGP. Based on the analyses of various aerosol properties (e.g. AOD, Angstrom exponent), derived from Multiangle Imaging SpectroRadiometer (MISR) level 3 remote sensing data, Prasad et al. (Citation2006) have documented that emissions from coal-fired power plant in the IGP is a dominant source of absorbing organic aerosols and other airborne particulate matters in winter season. Furthermore, there exists a notable declining trend in the emission of organic aerosols from the biofuel (wood) combustion and an ongoing rise in coal combustion based on the comparison of energy consumption between 1990 and 2000 (Prasad et al., Citation2006). Therefore, we attribute coal-fired power plant emissions in the IGP is a major source of organic aerosols sampled over the N-BoB (i.e. in the IGP-outflow).
The forest fires, occurring over Southeast Asia during the cruise in the BoB (January 2009), contribute to large-scale emissions of POA as well as VOCs. Thus, the observed depletion in 13C of TC in the SEA-outflow (b) can be explained in terms of contribution of POA from C3 vegetation burning and/or from the secondary organic aerosol (SOA) formation through the photochemical oxidation of VOCs. Similar to our study, lower values of δ13CTC (−26.6 to −23.2 ‰, average −25.0 ‰) were observed for the wheat residue-burning aerosols sampled over Mt. Tai in East Asia (Fu et al., Citation2012). Furthermore, Fu et al. (Citation2012) documented a non-linear (exponential) relationship between δ13CTC and levoglucosan (a tracer of BBEs), suggesting that an increased contribution of BBEs causes a significant depletion of 13C in aerosols (δ13C: −26 to −27 ‰) (Fu et al., Citation2012). Narukawa et al. (Citation1999) also reported a conspicuous decrease in δ13CTC from −25.5 to −27.5 ‰ for the fine mode aerosols sampled from the Indonesian forest fires, in response to an increased contribution of organics from C3 vegetation. Also, the fractionation of stable carbon isotopes during the combustion of C3 plants is not significant (~0.5 ‰ enrichment between unburned plant and aerosols (Turekian et al., Citation1998).
Fig. 3 Spatial distributions of (a) stable carbon (δ13CTC) and (b) nitrogen (δ15NTN) isotopic composition of fine mode (PM2.5) aerosols collected from the marine atmospheric boundary layer of the Bay of Bengal during a winter cruise (27 December 2008 to 28 January 2009).
Based on the above arguments, the lower δ13CTC in the SEA-outflow can be attributed to contribution of organic aerosols from the combustion of C3 plants. However, SOAs produced from the photooxidation of biogenic VOCs could also contribute to lower the δ13CTC (Kirillova et al., Citation2013). A recent laboratory photooxidation/smog chamber experiment of toluene (a VOC emitted from motor vehicles) has demonstrated formation of SOA, whose δ13C values were ~6 ‰ lower than that of the parent toluene (Irei et al., Citation2006, Citation2011). Furthermore, δ13C fractionation between gas and aerosol phases is found to be small during photooxidation (Irei et al., Citation2006, Citation2011). Similarly, the laboratory photooxidation on gaseous isoprene and ozone system results in the formation of less volatile methacrolein and methyl vinyl ketone (i.e. known gaseous isoprene oxidation products), whose δ13C values are depleted by more than 3.6 and 4.5 ‰, respectively (Iannone et al., Citation2010). These observations, thus, support the argument that photooxidation of anthropogenic/biogenic VOCs results in not only more oxidized semi-volatile organics for which isotopic fractionation effects are found to be minimal (Irei, Citation2008) but also lowers the δ13C values than those of precursor fuel/vegetation.
These semi-VOCs subsequently partition to SOAs and, hence, can explain their lower δ13C signatures. In this regard, lower δ13C values in the SEA-outflow can, therefore, be attributed to the contribution of SOAs derived from atmospheric oxidation of VOCs emitted from the BBEs in Southeast Asia. We have also observed a significant linear relationship of δ13CTC with nss-K+ (R 2=0.58, p<0.05) and WSOC (R 2=0.60, p<0.05) in the SEA-outflow (c and d) but not in the IGP-outflow (δ13CTC vs. WSOC: R 2=0.01; p>0.05 and δ13CTC vs. nss-K+: R 2=0.03; p>0.05). In the literature, the occurrence of nss-K+ in the fine mode aerosols and linear relationship with WSOC are used to assess the contribution of carbonaceous aerosols from the BBEs (Andreae, Citation1983; Andreae and Merlet, Citation2001; Paris et al., Citation2010; Pachon et al., Citation2014; Srinivas and Sarin, Citation2014). Therefore, a lack of significant linear relationship between nss-K+ and δ13CTC in the IGP-outflow sampled over the BoB (c), which is consistent with that of TC and δ13CTC (b), indicate the role of other sources of organic aerosols over the IGP (e.g. coal-fired power plants or vehicular emissions) than BBEs. Based on the literature, SOAs contribute significantly to atmospheric WSOC (Graham et al., Citation2002; Mayol-Bracero et al., Citation2002b; Sciare et al., Citation2008; Ram and Sarin, Citation2010; Hegde and Kawamura, Citation2012; Rajput et al., Citation2014; Srinivas and Sarin, Citation2014). In this regard, the BBE-derived POA and/or SOA causes 13C depletion of TC in the SEA-outflow, which can also be supported by the strong correlations of δ13C with nss-K+ and WSOC (c and d).
Fig. 4 Correlation plots for (a) TN versus δ15NTN, (b) TC versus δ13CTC, (c) nss-K+ versus δ13CTC and (d) WSOC versus δ13CTC for fine mode aerosols collected over the Bay of Bengal during a winter cruise (27 December 2008 to 28 January 2009).
The impact of BBEs over FF-comb sources over the BoB can also be inferred based on the relative increase in mass ratio of nss-K+ to EC () as the latter contains negligible potassium content (Novakov et al., Citation2000; Mayol-Bracero et al., Citation2002b). Furthermore, higher nss-K+/EC ratios in the SEA-outflow (0.39±0.09) compared with those in the IGP-outflow (0.29±0.09) suggest the dominance of BBEs in the former samples. A significant linear relationship is noteworthy between δ13CTC and δ15NTN in the SEA-outflow (slope=− 5.5; R
2=0.63; p<0.05; Supplementary Fig. 3); however, no such correlation is observed for the IGP-outflow (slope=− 3.5; R
2=0.15; p=0.15; Supplementary Fig. 3). The observed weak (or no) and strong correlation of δ13CTC with δ15NTN for the IGP- and SEA-outflows, respectively, could be due to variable contribution of TC and TN from FF-comb and BBEs over the BoB. Furthermore, moderate linear correlation is found between nss-
![]() and EC for the IGP-outflow samples (R
2=0.57; p<0.05), which indicates an impact of FF-combustion sources over the north BoB. However, rather weak linear correlation was observed for SEA-outflow between nss-
and EC for the IGP-outflow samples (R
2=0.57; p<0.05), which indicates an impact of FF-combustion sources over the north BoB. However, rather weak linear correlation was observed for SEA-outflow between nss-
![]() and EC (R
2=0.26; p=0.03). This observation emphasizes a significant contribution of TC from FF-comb sources in the IGP over the BoB during the study period.
and EC (R
2=0.26; p=0.03). This observation emphasizes a significant contribution of TC from FF-comb sources in the IGP over the BoB during the study period.
3.2. Relative contribution of fossil fuel versus biomass/biofuel-burning source
The δ13CTC in PM2.5 over the BoB during a winter cruise can be explained based on two end-member mixing between FF-comb and BBEs. Since the IGP is a densely populated and industrialized region of India with intense ongoing anthropogenic activities (viz., coal-fired power plants, vehicular emissions, wood/post-harvest crop-residue burning), it is not logical to assume that biogenic emissions mainly contribute to aerosol-TC in the IGP-outflow. The dominant contribution of aerosol-TC in the SEA-outflow samples is from forest fires occurring in Southeast Asia (as inferred from MODIS satellite-derived fire count data; Supplemantary Fig. 3).
Organic compounds, derived from phytoplankton debris and zooplankton excreta in the sea surface microlayer, are coated on sea-salt particles, contributing to marine aerosols collected over the BoB. Therefore, marine phytoplankton-derived organic aerosols have an average δ13C value of ca. −22 ‰ (Miyazaki et al., Citation2011). However, the BoB is not a productive oceanic basin and is perennially influenced by fresh water influx from the Ganga–Brahmaputra and other peninsular rivers. Moreover, the persistence of weak NE-monsoonal winds (<3 m second−1) are not likely to trigger sea-to-air transfer of organics from the surface waters of the BoB during the continental outflow. Therefore, contribution from marine organic matter is unlikely due to prevailing winds during the study period. This is further supported by the relative contribution of sea-salts and hence particulate organic matter from the ocean surface by bubble bursting to ambient aerosols over the BoB is no more than 5 % (Srinivas and Sarin, Citation2014). Therefore, we believe that a two end-member mixing model is a reasonable first-order pseudo-approximation to assess the relative contribution of aerosol-TC from BBEs and FF-comb over the BoB.
The rationale for the contribution from these two sources is further supported by the observed nss-K+/EC and nss-
![]() /EC ratios in PM2.5 over the BoB (for additional information, see Section 3.1). Higher nss-K+/EC ratios in the SEA-outflow than those in the IGP-outflow samples indicate a dominance of BBEs over the South BoB () (Srinivas and Sarin, Citation2014). The nss-
/EC ratios in PM2.5 over the BoB (for additional information, see Section 3.1). Higher nss-K+/EC ratios in the SEA-outflow than those in the IGP-outflow samples indicate a dominance of BBEs over the South BoB () (Srinivas and Sarin, Citation2014). The nss-
![]() /EC ratio, a proxy for fossil fuel combustion with higher values documented for coal-fired power plants (~6) (Ramana et al., Citation2010), showed somewhat consistency between the IGP- and SEA-outflows (Srinivas and Sarin, Citation2014) (), indicating a contribution from point sources in the IGP (e.g. coal-fired power plants). Also, the 7-d AMBTs for the PM2.5 samples collected over the north BoB have the source origin from the IGP (), which intercept the receptor sites dominated by carbonaceous aerosols (and hence TC) derived from coal-fired power plants (see blue pins in ).
/EC ratio, a proxy for fossil fuel combustion with higher values documented for coal-fired power plants (~6) (Ramana et al., Citation2010), showed somewhat consistency between the IGP- and SEA-outflows (Srinivas and Sarin, Citation2014) (), indicating a contribution from point sources in the IGP (e.g. coal-fired power plants). Also, the 7-d AMBTs for the PM2.5 samples collected over the north BoB have the source origin from the IGP (), which intercept the receptor sites dominated by carbonaceous aerosols (and hence TC) derived from coal-fired power plants (see blue pins in ).
Widory (Citation2006) and Mori et al. (Citation1999) have documented that δ13C of aerosols from coal combustion as −23.6±0.7 ‰ (−22.9 to −24.9 ‰) and −23.4±1.2 ‰, respectively, with almost zero fractionation (or slightly negative). On the other hand, combustion-derived particles from liquid fossil fuels (e.g. unleaded/leaded gasoline; δ13C: −26.4 to −28.0 ‰) are depleted in 13C relative to those originated from solid fuel (coal: −24 to −21 ‰) (Widory, Citation2006) but are enriched with 13C relative to gaseous fuels (−40 to −28 ‰) (Huang et al., Citation2006; Widory, Citation2006; López-Veneroni, Citation2009; Agnihotri et al., Citation2011; Kawashima and Haneishi, Citation2012). A comparison of δ13CTC (−23.8±0.6 ‰) over the north BoB with those representative of various fossil fuels as mentioned above (coal, diesel, gasoline, etc.) suggest a dominant contribution from coal-fired power plant emissions in the IGP ().
Fig. 5 Comparison of δ13C of aerosol-TC over the BoB during a winter cruise (January 2009) with literature values of various sources such as combustion/emissions from C3, C4 and marine phytoplankton (Turekian et al., Citation1998; Cao et al., Citation2013), coal combustion (Mori et al., Citation1999; Widory, Citation2006) and vehicular emissions (Widory, Citation2006; Cao et al., Citation2013).
Although we have observed a decrease in the number (intensity) of fire counts (derived from MODIS data) over the IGP than those over SEA, the contribution of wood-burning emissions to aerosol-TC (Gustafsson et al., Citation2009; Ram and Sarin, Citation2012) cannot be ruled out in the IGP-outflow sampled over the BoB. In this context, laboratory and natural field burning chars from C3 grasses and trees (wood and leaves) are enriched and/or depleted in 13C (e.g. δ13C for Eucalyptus wood: −27.2 ‰; Sphagnum: −26.0 ‰; C3 grasses: −28.2 to −32.4 ‰; Eucalyptus leaf: −28.2 ‰) compared with plant materials (Krull et al., Citation2003). On a similar note, based on the laboratory-based combustion, Agnihotri et al. (Citation2011) documented that aerosols from typical BBEs in India exhibit a very narrow range of δ13C (−27.9±1.1 ‰). However, the observed δ13CTC in the IGP-outflow (−23.8±0.6 ‰) is consistent with that of coal-derived emissions compared with other sources (i.e. gasoline combustion and wood-burning emissions; ). Therefore, we have used coal-burning emissions as one end-member (δ13CTC: −23 ‰; Widory, Citation2006) for explaining the observed stable carbon isotopic signatures of TC in the continental outflow sampled over the BoB during winter. We can further support the significance of coal-fired power plants as a potential source of organic aerosols in the IGP-outflow sampled over the BoB as follows.
As mentioned earlier, FF-comb (coal combustion and vehicular emissions: VEs) and BBEs (wood/crop-residue) in the IGP contribute to organic aerosols over the BoB during the winter period (Rengarajan et al., Citation2007; Sudheer and Sarin, Citation2008; Kumar et al., Citation2010; Srinivas and Sarin, Citation2013, Citation2014). In such cases, the δ13CTC of PM2.5 over the BoB can be expressed as a product of individual fractions of TC from each of these three respective sources times their stable C-isotopic composition as below
1
Based on the 14C-analysis of EC, Gustafsson et al. (Citation2009) documented near equal contribution of wood-burning emissions and fossil fuel combustion sources to Atmospheric Brown Clouds over South Asia. Therefore, we have assumed 50 % contribution from biofuels (Gustafsson et al. Citation2009), 30 % from coal-fired thermal power plants and 20 % from vehicular emissions (Prasad et al., Citation2006) to atmospheric organic aerosols in the IGP-outflow. Agnihotri et al. (Citation2011) documented that source-specific δ13CTC of various biofuels and crop-residue combustion-derived aerosols from South Asia centred on −27.9±1.1 ‰. Similarly, a source-specific δ13CTC of −23.6±0.7 ‰ from coal combustion-derived particles has been documented by Widory (Citation2006). Also, the δ13CTC of particles generated from diesel combustion emissions span from −28 to −26 ‰ (Widory, Citation2006).
Using the respective source contributions and their corresponding δ13CTC in eq. (1), we have estimated δ13C of organic aerosols collected in the IGP-outflow to be −26 to −27 ‰. Based on the narrow spread of δ13CTC in the IGP-outflow (−23.8±0.6 ‰), we estimated δ13CTC from the contribution of above-mentioned three major sources in the IGP. However, it may be argued that atmospheric oxidation, and hence, enrichment in 13C could be compensated by SOA formation (with overall 13C depletion) during transport. Therefore, the observed overlap of δ13CTC over the N-BoB with coal-fired power plant emissions in the IGP emphasizes the source significance in the IGP-outflow. However, further studies on seasonal variability of the IGP-outflow are needed along with the δ13CTC.
The δ13CTC in the SEA-outflow (−26.9 to −24.2 ‰) overlap with those derived from both vehicular emissions and forest fires (). However, the SEA-outflow samples are collected over the pelagic (deep) waters (i.e. away from the coast and unlike samples from the IGP-outflow, where vehicular emissions could contribute) and, therefore, not likely to have contribution from vehicular emissions. Furthermore, AMBTs originating from Southeast Asia have a significant contribution from forest fires, inferred from the MODIS fire count data (Supplemantary Fig. 2). Therefore, we have considered BBEs as another end-member to account for the variability in δ13CTC in the SEA-outflow.
Aerosol-TC in the SEA-outflow (−25.3±0.9 ‰) is significantly depleted in 13C than that derived from C4 plants (−17 to −9 ‰; average −13 ‰), being somewhat consistent with those originated from C3 vegetation burning (−32 to −20 ‰; average −28 ‰) (Smith and Epstein, Citation1971). In a previous study, Turekian et al. (Citation1998) suggested that particles from C3 plant burning emissions showed a slight enrichment in 13C in aerosol-TC (or higher in δ13C by only 0.5 ‰ or less) than host plant, while C4 plants resulted in a depletion of 13C (or lower in δ13C by 3.5 ‰) (Turekian et al., Citation1998). According to Turekian et al. (Citation1998), the increased relative proportion of refractory components (e.g. lipids; 13C depleted than bulk plant) over labile carbon pools (13C enrichment) in aerosols during C4 plant combustion causes 13C depletion of TC; however, no sucheffects were observed for C3 plant combustion-derived aerosols. A similar result has been reported for the smoke and ash that are derived from the combustion of C3 plants which show negligible (or no) fractionation (Krull et al., Citation2003; Das et al., Citation2010).
Taken together of all these findings, we have assumed −23 and −28 ‰ to be the representative end-member δ13C signatures for FF-comb source and BBEs, respectively, based on the two end-member mixing model, which is described as follows:
2
3
4
Here, fFF-comb and fBBEs refer to the fractional contribution of TC from fossil fuel combustion and biomass-burning emission sources, respectively. The end-member δ13C for FF-comb and BBEs are −23.0 and −28.0 ‰, respectively. Using eq. (4), we estimated the contribution of fossil fuel combustion to both the IGP- and SEA-outflows. In this study, the estimated contribution of FF-comb source to δ13CTC varied from 61 to 100 % (average 84±12 %) for the IGP-outflow samples and 12 to 66 % (average 44±18 %) for the SEA-outflow samples.
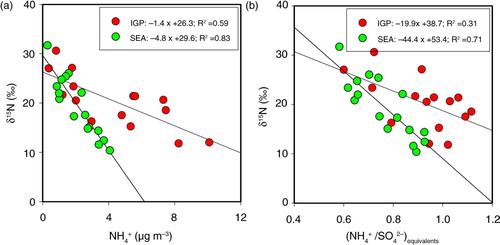
3.3. Elevated δ15N of TN: transformation of gaseous NH3 to particulate

In both the IGP- and SEA-outflows, the water-soluble inorganic nitrogen (i.e.
![]() -N accounting for 81–100 %) dominates the total soluble nitrogen (Srinivas et al., Citation2011b). Further, a moderate-to-strong linear correlation of δ15NTN with
-N accounting for 81–100 %) dominates the total soluble nitrogen (Srinivas et al., Citation2011b). Further, a moderate-to-strong linear correlation of δ15NTN with
![]() and equivalent mass ratio of
and equivalent mass ratio of
![]() /
/
![]() is observed in both continental outflows (). Since
is observed in both continental outflows (). Since
![]() dominates aerosol-TN over the BoB (i.e. >90 %; R
2=0.95; ), atmospheric processes affecting the concentration of particulate
dominates aerosol-TN over the BoB (i.e. >90 %; R
2=0.95; ), atmospheric processes affecting the concentration of particulate
![]() in fine mode aerosols might explain the observed δ15NTN. The particulate
in fine mode aerosols might explain the observed δ15NTN. The particulate
![]() concentration in the MABL, however, is influenced by the atmospheric reactions of gaseous NH3 with acidic species (e.g. H2SO4, HNO3) to form NH4HSO4, (NH4)2SO4 and NH4NO3. Furthermore, NH4NO3 is formed mostly under ammonia-rich conditions (i.e. for which
concentration in the MABL, however, is influenced by the atmospheric reactions of gaseous NH3 with acidic species (e.g. H2SO4, HNO3) to form NH4HSO4, (NH4)2SO4 and NH4NO3. Furthermore, NH4NO3 is formed mostly under ammonia-rich conditions (i.e. for which
![]() to
to
![]() equivalent mass ratio is greater than unity) because the reaction between ammonia and sulphate is preferable. However, NH4NO3 is thermodynamically not stable and, therefore, often dissociated into precursor chemical constituents during atmospheric transport, which also affects the ambient
equivalent mass ratio is greater than unity) because the reaction between ammonia and sulphate is preferable. However, NH4NO3 is thermodynamically not stable and, therefore, often dissociated into precursor chemical constituents during atmospheric transport, which also affects the ambient
![]() concentration. As a result,
concentration. As a result,
![]() mainly exists in coarse mode due to the reaction with mineral dust and sea-salt (Jickells, Citation2006). All these processes/reactions could influence δ15NTN in ambient aerosols. It is implicit from that linear relationship of
mainly exists in coarse mode due to the reaction with mineral dust and sea-salt (Jickells, Citation2006). All these processes/reactions could influence δ15NTN in ambient aerosols. It is implicit from that linear relationship of
![]() concentration and the equivalent mass ratios of
concentration and the equivalent mass ratios of
![]() to
to
![]() with δ15NTN can explain the observed enrichment of 15N in the PM2.5 sampled over the BoB.
with δ15NTN can explain the observed enrichment of 15N in the PM2.5 sampled over the BoB.
Fig. 6 Linear regression analysis between (a) concentration of
![]()
The mean equivalent mass ratio of
![]() /
/
![]() in the samples from IGP- and SEA-outflow corresponds to 0.92±0.15 and 0.77±0.12, respectively, suggesting an ammonia-deficit (poor) condition. Moreover, the observed ambient temperature during the cruise averages around 26.7 °C (IGP-outflow: 24.4–27.4 °C; SEA-outflow: 25.9–29.0 °C) and high nss-
in the samples from IGP- and SEA-outflow corresponds to 0.92±0.15 and 0.77±0.12, respectively, suggesting an ammonia-deficit (poor) condition. Moreover, the observed ambient temperature during the cruise averages around 26.7 °C (IGP-outflow: 24.4–27.4 °C; SEA-outflow: 25.9–29.0 °C) and high nss-
![]() concentrations facilitate the dissociation of NH4NO3. Interestingly, Srinivas et al. (Citation2011b) have documented the predominant occurrence of
concentrations facilitate the dissociation of NH4NO3. Interestingly, Srinivas et al. (Citation2011b) have documented the predominant occurrence of
![]() in coarse mode and
in coarse mode and
![]() in fine mode aerosols during the January 2009 cruise. This implies that particulate
in fine mode aerosols during the January 2009 cruise. This implies that particulate
![]() in the MABL mainly occur due to the formation of more stable NH4HSO4 or (NH4)2SO4. In this regard, we observed a very strong correlation between
in the MABL mainly occur due to the formation of more stable NH4HSO4 or (NH4)2SO4. In this regard, we observed a very strong correlation between
![]() and
and
![]() (Srinivas et al., Citation2011b), suggesting the formation (NH4)2SO4 and NH4HSO4 over the BoB during the study period. Therefore, we believe that atmospheric transformation of gaseous NH3 to particulate
(Srinivas et al., Citation2011b), suggesting the formation (NH4)2SO4 and NH4HSO4 over the BoB during the study period. Therefore, we believe that atmospheric transformation of gaseous NH3 to particulate
![]() might be responsible for the observed large variability in δ15N of TN over the BoB.
might be responsible for the observed large variability in δ15N of TN over the BoB.
Similar to our study, Pavuluri et al. (Citation2010) reported an elevated δ15N of TN and its significant positive linear correlation with sulphate to ammonium molar ratio (or negative correlation with that of
![]() /
/
![]() molar ratio) for the urban coastal aerosols from Chennai, India, during the late winter (January). Further, they observed a positive relationship between ambient temperature and δ15N; in particular, higher δ15N are noteworthy for those sampling days with temperatures >20 °C (Pavuluri et al., Citation2010). The ambient temperature range over the BoB in this study is higher than that documented in Pavuluri et al. (Citation2010). During a laboratory experiment, an exposure of gaseous NH3 to aerosol filters loaded with sulphuric acid results in the formation of (NH4)2SO4 (i.e. ascertained through stoichiometric equilibrium between
molar ratio) for the urban coastal aerosols from Chennai, India, during the late winter (January). Further, they observed a positive relationship between ambient temperature and δ15N; in particular, higher δ15N are noteworthy for those sampling days with temperatures >20 °C (Pavuluri et al., Citation2010). The ambient temperature range over the BoB in this study is higher than that documented in Pavuluri et al. (Citation2010). During a laboratory experiment, an exposure of gaseous NH3 to aerosol filters loaded with sulphuric acid results in the formation of (NH4)2SO4 (i.e. ascertained through stoichiometric equilibrium between
![]() and
and
![]() ), which is enriched in 15N with isotope enrichment factor of +33 ‰ (Heaton et al., Citation1997). Combining all the above arguments, we believe that gas to particle formation of NH3 to particulate
), which is enriched in 15N with isotope enrichment factor of +33 ‰ (Heaton et al., Citation1997). Combining all the above arguments, we believe that gas to particle formation of NH3 to particulate
![]() in the MABL can explain the enrichment of 15N in the PM2.5 sampled over the BoB during winter.
in the MABL can explain the enrichment of 15N in the PM2.5 sampled over the BoB during winter.
The mean value of δ15NTN in the IGP-outflow sampled over the BoB during a winter cruise (this study) is higher than those obtained during a spring–intermonsoon cruise [+10.6±2.7 ‰ (Agnihotri et al., Citation2011)]. Although the continental outflow from the IGP persists during spring intermonsoon, the observed depletion of 15N could be explained based on the decrease in source strength/variability. The weakening of the IGP-outflow during spring–intermonsoon, compared with winter months (), is inferred by a decrease in the atmospheric concentrations of
![]() (0.01–2.3 µg m−3; 0.9±0.6 µg m−3) and nss-
(0.01–2.3 µg m−3; 0.9±0.6 µg m−3) and nss-
![]() (2.5–10.3 µg m−3; 10.3±2.5 µg m−3), and equivalent mass ratios of
(2.5–10.3 µg m−3; 10.3±2.5 µg m−3), and equivalent mass ratios of
![]() to nss-
to nss-
![]() (0.01–0.66; average 0.41±0.20) over the BoB. Therefore, we believe that the observed decrease in particulate
(0.01–0.66; average 0.41±0.20) over the BoB. Therefore, we believe that the observed decrease in particulate
![]() in the marine aerosols during spring intermonsoon might indicate the non-availability of gaseous NH3 to form NH4HSO4 and (NH4)2SO4 aerosols and, thus, explain the observed lower δ15NTN.
in the marine aerosols during spring intermonsoon might indicate the non-availability of gaseous NH3 to form NH4HSO4 and (NH4)2SO4 aerosols and, thus, explain the observed lower δ15NTN.
Similar to our study, higher δ15N values (+13.4 to +22.1 ‰) have been reported for fine mode aerosols sampled over Tanzania during dry season, which is attributed to a significant 15N enrichment by isotopic exchange reaction of N between gaseous NH3 and aerosol
![]() during atmospheric transport (Mkoma et al., Citation2014). Similarly, Pavuluri et al. (Citation2010) have also reported similar δ15N values in PM10 aerosols, ranging from +18.0 to +27.8 ‰ and +18.6 to +25.7 ‰ in day and night samples, respectively, collected during winter from a coastal site in India (Chennai). Therefore, observed variability in δ15NTN for the IGP-outflow samples (+11.8 to +30.6 ‰) can be attributed to pronounced continental impact of anthropogenic sources (reflected from their higher ambient abundances of
during atmospheric transport (Mkoma et al., Citation2014). Similarly, Pavuluri et al. (Citation2010) have also reported similar δ15N values in PM10 aerosols, ranging from +18.0 to +27.8 ‰ and +18.6 to +25.7 ‰ in day and night samples, respectively, collected during winter from a coastal site in India (Chennai). Therefore, observed variability in δ15NTN for the IGP-outflow samples (+11.8 to +30.6 ‰) can be attributed to pronounced continental impact of anthropogenic sources (reflected from their higher ambient abundances of
![]() and
and
![]() over the north BoB) to TN and also the exchange reactions between gaseous NH3 and particulate
over the north BoB) to TN and also the exchange reactions between gaseous NH3 and particulate
![]() during transport. It is important to emphasize that δ13CTC and δ15NTN showed a good correlation for the SEA-outflow (influenced by BBEs; see ), but not in the IGP-outflow. Similar to this study, Agnihotri et al. (Citation2011) have documented a strong correlation between δ13C and δ15N over the BoB during spring–intermonsoon cruise, which is also influenced by the BBEs. In a previous study, Turekian et al. (Citation1998) documented that various stages of biomass combustion resulted in a large spread in stable nitrogen isotopic signatures of aerosol-TN. Therefore, variability in δ15NTN in the SEA-outflow (+10.4to +30.7 ‰; average +19.4±6.1 ‰) can be explained by the highly variable temperature conditions that prevail during the forest fires in Southeast Asia.
during transport. It is important to emphasize that δ13CTC and δ15NTN showed a good correlation for the SEA-outflow (influenced by BBEs; see ), but not in the IGP-outflow. Similar to this study, Agnihotri et al. (Citation2011) have documented a strong correlation between δ13C and δ15N over the BoB during spring–intermonsoon cruise, which is also influenced by the BBEs. In a previous study, Turekian et al. (Citation1998) documented that various stages of biomass combustion resulted in a large spread in stable nitrogen isotopic signatures of aerosol-TN. Therefore, variability in δ15NTN in the SEA-outflow (+10.4to +30.7 ‰; average +19.4±6.1 ‰) can be explained by the highly variable temperature conditions that prevail during the forest fires in Southeast Asia.
3.4. Comparison with studies from the Northern Indian Ocean
The stable isotopic composition of TC and TN from this study (January 2009) was compared with those from earlier cruises conducted in the NIO (Agnihotri et al., Citation2011) and other sampling sites from South Asia. A significant difference in the δ13CTC is noteworthy during the cruises conducted in the BoB in January 2009 () and March–April 2006 [range: −26.6 to −24.1 ‰; average −25.6±0.6 ‰ for TSP samples (Agnihotri et al., Citation2011)]. Although δ13C of TC for both cruises refers to different size fractions of aerosols, it is relevant to state that during long-range transport the mass size distribution of atmospheric particulates changes from coarse to fine mode due to the settling of coarser particles (Duce et al., Citation1991). This is most relevant for our sampling from the MABL of the BoB and the chemical composition mostly comprised dominant fine particles (Srinivas et al., Citation2011b). Although source strength of carbonaceous aerosols in the IGP-outflow is varied in between the cruises (i.e. higher abundances in winter than spring–intermonsoon) over the BoB, their sources remain the same, as inferred from the diagnostic mass ratios of chemical composition of aerosols (Sarin et al., Citation2010; Srinivas and Sarin, Citation2012).
Table 2. Comparison of stable carbon and nitrogen isotopic compositions of aerosols from this study with those documented in the literature over South Asia
The δ13CTC in the IGP-outflow from a winter cruise (January 2009) in the BoB (this study) is significantly higher than that obtained during spring–intermonsoon (Agnihotri et al., Citation2011) (). However, δ13CTC in the SEA-outflow sampled over the BoB in winter (11–28 January, 2009) is somewhat similar with that from spring–intermonsoon cruise (Agnihotri et al., Citation2011). The observed differences in δ13CTC during the two cruises could be related to temporal shift in the source contributions (anthropogenic aerosols accounting for more than 80 % in winter vis-à-vis near equal contribution of dust and anthropogenic species during spring–intermonsoon, March–April 2006) (Srinivas and Sarin, Citation2012). Analysis of MODIS fire images (Supplementary Fig. 3) clearly showed hotspots over the IGP during spring–intermonsoon (March–April 2006) and Southeast Asia during winter (January 2009; ). Therefore, 13C depleted values of TC in the IGP-outflow samples in spring–intermonsoon and the SEA-outflow samples in winter can be explained by a significant contribution of carbonaceous species from BBEs. The impact of BBEs in the IGP-outflow sampled over the BoB during spring–intermonsoon and the SEA-outflow during a winter cruise was also reflected through consistent nss-K+/EC ratios (0.35±0.11and 0.39±0.09, respectively).
We have also observed consistency in the δ13CTC from this study with those documented for wintertime aerosols (−25.9±0.3 ‰) (Aggarwal et al., Citation2013) from Mumbai (a continental site in India). The biofuel/biomass burning is a dominant source of TC over Mumbai (Venkataraman et al., Citation2002, Citation2005) and also over the IGP during winter (Rengarajan et al., Citation2007; Ram and Sarin, Citation2012; Rajput et al., Citation2014; Srinivas and Sarin, Citation2014). Therefore, the overlapping δ13CTC in the SEA-outflow samples in winter with those of the IGP-outflow samples from the BoB during spring–intermonsoon and of continental aerosols from Mumbai might correspond to biofuel/biomass-burning emissions.
4. Conclusions
This study reports the stable C- and N-isotopic composition of wintertime aerosols (PM2.5) over the BoB. During the study period (December 2008–January 2009), the MABL is influenced by the continental outflow from the IGP- and SEA-outflows, respectively, as inferred from the 7-d AMBTs over the BoB. The δ13CTC in the IGP-outflow (−23.8±0.6 ‰) is distinctly different than that in the SEA-outflow (−25.3±0.9 ‰). A significant linear relationship of δ13CTC with TC, nss-K+ and WSOC is noteworthy in the SEA-outflow but not in the IGP-outflow, which indicates the impact of BBEs in the former samples (which is also supported by the MODIS fire count data). However, no such influence from BBEs was observed for the IGP-outflow. Besides, the temporal variability of δ13CTC in the IGP-outflow is rather small unlike TC concentration and overlaps with those derived from coal combustion sources (−23.6±0.7 ‰) in the IGP. The observed 13C-depletion of aerosol-TC in the SEA-outflow is attributed to the contribution of POA directly emitted from the BBEs or due to SOAs formed by the oxidation of BVOCs from the forest fires. We observe no significant differences in the δ15NTN between IGP- and SEA-outflows. Moreover, mass concentration of
![]() dominates the aerosol-TN over the BoB, showing significant linear relationship with δ15NTN. Thus, we infer that δ15NTN in aerosols over the BoB during winter is governed by the atmospheric processes affecting the concentrations of aerosol water-soluble inorganic nitrogen species (e.g.
dominates the aerosol-TN over the BoB, showing significant linear relationship with δ15NTN. Thus, we infer that δ15NTN in aerosols over the BoB during winter is governed by the atmospheric processes affecting the concentrations of aerosol water-soluble inorganic nitrogen species (e.g.
![]() ,
,
![]() ) during transport.
) during transport.
Supplementary Material
Download PDF (703.9 KB)5. Acknowledgements
The authors thank all the crewmembers of ORV Sagar Kanya for their help during aerosol collection. The authors acknowledge the partial financial support provided from the ISRO-Geosphere Biosphere Programme. The logistic support provided by Drs. K. Krishnamoorthy and C.B.S. Dutt is thankfully acknowledged. The financial support provided by the Japanese Society for the Promotion of Science (JSPS) through grant-in-aid no. 24221001 is acknowledged for carrying out C and N isotope analyses at Hokkaido University.
Notes
To access the supplementary material to this article, please see Supplementary files under ‘Article Tools’.
References
- Aggarwal S. G. , Kawamura K . Molecular distributions and stable carbon isotopic compositions of dicarboxylic acids and related compounds in aerosols from Sapporo, Japan: implications for photochemical aging during long-range atmospheric transport. J. Geophys. Res. Atmos. 2008; 113: D14301.
- Aggarwal S. G. , Kawamura K. , Umarji G. S. , Tachibana E. , Patil R. S. , co-authors . Organic and inorganic markers and stable C-, N-isotopic compositions of tropical coastal aerosols from megacity Mumbai: sources of organic aerosols and atmospheric processing. Atmos. Chem. Phys. 2013; 13: 4667–4680.
- Agnihotri R. , Mandal T. K. , Karapurkar S. G. , Naja M. , Gadi R. , co-authors . Stable carbon and nitrogen isotopic composition of bulk aerosols over India and northern Indian Ocean. Atmos. Environ. 2011; 45: 2828–2835.
- Andreae M. O . Soot carbon and excess fine potassium: long-range transport of combustion-derived aerosols. Science. 1983; 220: 1148–1151.
- Andreae M. O. , Merlet P . Emission of trace gases and aerosols from biomass burning. Glob. Biogeochem. Cycles. 2001; 15: 955–966.
- Cao F., Zhang S.-C., Kawamura K., Zhang Y.-L. Inorganic markers, carbonaceous components and stable carbon isotope from biomass burning aerosols in Northeast China. Sci. Total Environ. 2016. DOI: http://dx.doi.org/10.1016/j.scitotenv.2015.09.099.
- Cao J.-J. , Zhu C.-S. , Tie X.-X. , Geng F.-H. , Xu H.-M. , co-authors . Characteristics and sources of carbonaceous aerosols from Shanghai, China. Atmos. Chem. Phys. 2013; 13: 803–817.
- Das O. , Wang Y. , Hsieh Y.-P . Chemical and carbon isotopic characteristics of ash and smoke derived from burning of C3 and C4 grasses. Org. Geochem. 2010; 41: 263–269.
- Draxler R. R. , Stunder B. , Rolph G. , Taylor A . HYSPLIT4 users guide. NOAA Tech. Memo. ERL ARL. 1999; 230: 35.
- Duce R. , Liss P. , Merrill J. , Atlas E. , Buat-Menard P. , co-authors A . The atmospheric input of trace species to the world ocean. Glob. Biogeochem. Cycles. 1991; 5: 193–259.
- Fu P. , Kawamura K. , Chen J. , Li J. , Sun Y. , co-authors . Diurnal variations of organic molecular tracers and stable carbon isotopic composition in atmospheric aerosols over Mt. Tai in the North China Plain: an influence of biomass burning. Atmos. Chem. Phys. 2012; 12: 8359–8375.
- Graham B. , Mayol-Bracero O. L. , Guyon P. , Roberts G. C. , Decesari S. , co-authors . Water-soluble organic compounds in biomass burning aerosols over Amazonia 1. Characterization by NMR and GC-MS. J. Geophys. Res. Atmos. 2002; 107: LBA 14-11–LBA 14-16.
- Gustafsson O. , Krusa M. , Zencak Z. , Sheesley R. J. , Granat L. , co-authors . Brown clouds over South Asia: biomass or fossil fuel combustion?. Science. 2009; 323: 495–498.
- Heaton T. H. E. , Spiro B. , Robertson S. M. C . Potential canopy influences on the isotopic composition of nitrogen and sulphur in atmospheric deposition. Oecologia. 1997; 109: 600–607.
- Hegde P. , Kawamura K . Seasonal variations of water-soluble organic carbon, dicarboxylic acids, ketocarboxylic acids, and α-dicarbonyls in Central Himalayan aerosols. Atmos. Chem. Phys. 2012; 12: 6645–6665.
- Huang L. , Brook J. , Zhang W. , Li S. , Graham L. , co-authors A . Stable isotope measurements of carbon fractions (OC/EC) in airborne particulate: a new dimension for source characterization and apportionment. Atmos. Environ. 2006; 40: 2690–2705.
- Iannone R. , Koppmann R. , Rudolph J . Stable carbon kinetic isotope effects for the production of methacrolein and methyl vinyl ketone from the gas-phase reactions of isoprene with ozone and hydroxyl radicals. Atmos. Environ. 2010; 44: 4135–4141.
- Irei S. , Huang L. , Collin F. , Zhang W. , Hastie D. , co-authors . Flow reactor studies of the stable carbon isotope composition of secondary particulate organic matter generated by OH-radical-induced reactions of toluene. Atmos. Environ. 2006; 40: 5858–5867.
- Irei S . Laboratory Studies of Stable Carbon Isotope Ratio of Secondary Particulate Organic Matter in the Gas-Phase. 2008; PhD Dissertation, Department of Chemistry, York University, Toronto, Canada.
- Irei S. , Rudolph J. , Huang L. , Auld J. , Hastie D . Stable carbon isotope ratio of secondary particulate organic matter formed by photooxidation of toluene in indoor smog chamber. Atmos. Environ. 2011; 45: 856–862.
- Jacobson M. Z . Investigating cloud absorption effects: global absorption properties of black carbon, tar balls, and soil dust in clouds and aerosols. J. Geophys. Res. 2012; 117: D06205.
- Jayaraman A. , Lubin D. , Ramachandran S. , Ramanathan V. , Woodbridge E. , co-authors . Direct observations of aerosol radiative forcing over the tropical Indian Ocean during the January–February 1996 pre-INDOEX cruise. J. Geophys. Res. 1998; 103: 13827–13836.
- Jickells T . The role of air-sea exchange in the marine nitrogen cycle. Biogeosci. Discuss. 2006; 3: 183–210.
- Jimenez J. L. , Canagaratna M. R. , Donahue N. M. , Prevot A. S. H. , Zhang Q. , co-authors . Evolution of organic aerosols in the atmosphere. Science. 2009; 326: 1525–1529.
- Kanakidou M. , Seinfeld J. H. , Pandis S. N. , Barnes I. , Dentener F. J. , co-authors . Organic aerosol and global climate modelling: a review. Atmos. Chem. Phys. 2005; 5: 1053–1123.
- Kawamura K. , Kobayashi M. , Tsubonuma N. , Mochida M. , Watanabe T. , co-authors . Hill R. J. , etal. Organic and inorganic compositions of marine aerosols from East Asia: seasonal variations of water-soluble dicarboxylic acids, major ions, total carbon and nitrogen, and stable C and N isotopic composition. The Geochemical Society Special Publications. 2004; New York: Elsevier Science. 243–265.
- Kawashima H. , Haneishi Y . Effects of combustion emissions from the Eurasian continent in winter on seasonal δ13C of elemental carbon in aerosols in Japan. Atmos. Environ. 2012; 46: 568–579.
- Kedia S. , Ramachandran S. , Kumar A. , Sarin M . Spatiotemporal gradients in aerosol radiative forcing and heating rate over Bay of Bengal and Arabian Sea derived on the basis of optical, physical, and chemical properties. J. Geophys. Res. 2010; 115: D07205.
- Keene W. C. , Pszenny A. A. P. , Galloway J. N. , Hawley M. E . Sea-salt corrections and interpretation of constituent ratios in marine precipitation. J. Geophys. Res. 1986; 91: 6647–6658.
- Kirillova E. N. , Andersson A. , Sheesley R. J. , Kruså M. , Praveen P. , co-authors . 13C- and 14C-based study of sources and atmospheric processing of water-soluble organic carbon (WSOC) in South Asian aerosols. J. Geophys. Res. 2013; 118: 614–626.
- Krull E. S. , Skjemstad J. O. , Graetz D. , Grice K. , Dunning W. , co-authors . 13C-depleted charcoal from C4 grasses and the role of occluded carbon in phytoliths. Org. Geochem. 2003; 34: 1337–1352.
- Kumar A. , Sudheer A. , Sarin M . Chemical characteristics of aerosols in MABL of Bay of Bengal and Arabian Sea during spring inter-monsoon: a comparative study. J. Earth Syst. Sci. 2008; 117: 325–332.
- Kumar A. , Sarin M. M. , Srinivas B . Aerosol iron solubility over Bay of Bengal: role of anthropogenic sources and chemical processing. Mar. Chem. 2010; 121: 167–175.
- Kundu S. , Kawamura K. , Andreae T. W. , Hoffer A. , Andreae M. O . Diurnal variation in the water-soluble inorganic ions, organic carbon and isotopic compositions of total carbon and nitrogen in biomass burning aerosols from the LBA-SMOCC campaign in Rondônia, Brazil. J. Aerosol Sci. 2006; 41: 118–133.
- Kundu S. , Kawamura K. , Lee M . Seasonal variation of the concentrations of nitrogenous species and their nitrogen isotopic ratios in aerosols at Gosan, Jeju Island: implications for atmospheric processing and source changes of aerosols. J. Geophys. Res. 2010; 115: D20305.
- Lawrence M. G. , Lelieveld J . Atmospheric pollutant outflow from southern Asia: a review. Atmos. Chem. Phys. 2010; 10: 11017–11096.
- Lelieveld J. , Crutzen P. , Ramanathan V. , Andreae M. , Brenninkmeijer C. , co-authors . The Indian Ocean experiment: widespread air pollution from South and Southeast Asia. Science. 2001; 291: 1031–1036.
- López-Veneroni D . The stable carbon isotope composition of PM2.5 and PM10 in Mexico City Metropolitan Area air. Atmos. Environ. 2009; 43: 4491–4502.
- Martinelli L. , Camargo P. , Lara L. , Victoria R. , Artaxo P . Stable carbon and nitrogen isotopic composition of bulk aerosol particles in a C4 plant landscape of southeast Brazil. Atmos. Environ. 2002; 36: 2427–2432.
- Mayol-Bracero O. , Gabriel R. , Andreae M. , Kirchstetter T. , Novakov T. , co-authors . Carbonaceous aerosols over the Indian Ocean during the Indian Ocean Experiment (INDOEX): chemical characterization, optical properties, and probable sources. J. Geophys. Res. 2002a; 107: INX2 29-21–INX22 29-21.
- Mayol-Bracero O. , Guyon P. , Graham B. , Roberts G. , Andreae M. , co-authors . Water-soluble organic compounds in biomass burning aerosols over Amazonia 2. Apportionment of the chemical composition and importance of the polyacidic fraction. J. Geophys. Res. 2002b; 107: 8091.
- Miyazaki Y. , Kawamura K. , Jung J. , Furutani H. , Uematsu M . Latitudinal distributions of organic nitrogen and organic carbon in marine aerosols over the western North Pacific. Atmos. Chem. Phys. 2011; 11: 3037–3049.
- Mkoma S. L., Kawamura K., Tachibana E., Fu P. Stable carbon and nitrogen isotopic compositions of tropical atmospheric aerosols: sources and contribution from burning of C 3 and C 4 plants to organic aerosols. Tellus B. 2014; 66 20176. DOI: http://dx.doi.org/10.3402/tellusb.v66.20176.
- Mori I. , Nishikawa M. , Quan H. , Iwasaka Y . Regional characteristics of Chinese atmospheric aerosols in terms of the stable carbon isotope ratios. 1999. Proceedings of the Abstract of Annual Meeting of Japan Society for Atmospheric Environment, Tokyo, 40, p. 419. (in Japanese).
- Nair V. S. , Moorthy K. K. , Alappattu D. P. , Kunhikrishnan P. , George S. , co-authors . Wintertime aerosol characteristics over the Indo-Gangetic Plain (IGP): impacts of local boundary layer processes and long-range transport. J. Geophys. Res. 2007; 112: D13205.
- Narukawa M. , Kawamura K. , Takeuchi N. , Nakajima T . Distribution of dicarboxylic acids and carbon isotopic ratios in aerosols from 1997 Indonesian forest fires. Geophys. Res. Lett. 1999; 26: 3101–3104.
- Narukawa M. , Kawamura K. , Li S. M. , Bottenheim J . Stable carbon isotopic ratios and ionic composition of the high-Arctic aerosols: an increase in (13C values from winter to spring. J. Geophys. Res. 2008; 113: D18307.
- Novakov T. , Andreae M. , Gabriel R. , Kirchstetter T. , Mayol-Bracero O. , co-authors . Origin of carbonaceous aerosols over the tropical Indian Ocean: biomass burning or fossil fuels?. Geophys. Res. Lett. 2000; 27: 4061–4064.
- Ometto J. P. , Ehleringer J. R. , Domingues T. F. , Berry J. A. , Ishida F. Y. , co-authors . The stable carbon and nitrogen isotopic composition of vegetation in tropical forests of the Amazon Basin, Brazil. Biogeochemistry. 2006; 79: 251–274.
- Pachon J. E. , Weber R. J. , Zhang X. , Mulholland J. A. , Russell A. G . Revising the use of potassium (K) in the source apportionment of PM2.5 . Atmos. Pollut. Res. 2014; 4: 14–21.
- Paris R. , Desboeufs K. , Formenti P. , Nava S. , Chou C . Chemical characterisation of iron in dust and biomass burning aerosols during AMMA-SOP0/DABEX: implication for iron solubility. Atmos. Chem. Phys. 2010; 10: 4273–4282.
- Pavuluri C. M. , Kawamura K. , Tachibana E. , Swaminathan T . Elevated nitrogen isotope ratios of tropical Indian aerosols from Chennai: implication for the origins of aerosol nitrogen in South and Southeast Asia. Atmos. Environ. 2010; 44: 3597–3604.
- Pavuluri C. M. , Kawamura K. , Swaminathan T. , Tachibana E . Stable carbon isotopic compositions of total carbon, dicarboxylic acids and glyoxylic acid in the tropical Indian aerosols: implications for sources and photochemical processing of organic aerosols. J. Geophys. Res. 2011; 116: D18307.
- Prasad A. K. , Singh R. P. , Kafatos M . Influence of coal based thermal power plants on aerosol optical properties in the Indo-Gangetic basin. Geophys. Res. Lett. 2006; 33: L05805.
- Rajput P. , Sarin M. M. , Rengarajan R. , Singh D . Atmospheric polycyclic aromatic hydrocarbons (PAHs) from post-harvest biomass burning emissions in the Indo-Gangetic Plain: isomer ratios and temporal trends. Atmos. Environ. 2011; 45: 6732–6740.
- Rajput P., Sarin M., Sharma D., Singh D. Characteristics and emission budget of carbonaceous species from post-harvest agricultural-waste burning in source region of the Indo-Gangetic Plain. Tellus B. 2014; 66 , 21026. DOI: http://dx.doi.org/10.3402/tellusb.v66.21026.
- Ram K. , Sarin M . Spatio-temporal variability in atmospheric abundances of EC, OC and WSOC over Northern India. J. Aerosol Sci. 2010; 41: 88–98.
- Ram K. , Sarin M. , Tripathi S . A 1 year record of carbonaceous aerosols from an urban site in the Indo-Gangetic Plain: characterization, sources, and temporal variability. J. Geophys. Res. 2010; 115: D24313.
- Ram K. , Sarin M . Carbonaceous aerosols over Northern India: sources and spatio-temporal variability. Proc. Indian Natl. Sci. Acad. 2012; 78: 523–533.
- Ramana M. V. , Ramanathan V. , Feng Y. , Yoon S. C. , Kim S. W. , co-authors . Warming influenced by the ratio of black carbon to sulphate and the black-carbon source. Nat. Geosci. 2010; 3: 542–545.
- Ramanathan V. , Crutzen P. , Kiehl J. , Rosenfeld D . Aerosols, climate, and the hydrological cycle. Science. 2001a; 294: 2119–2124.
- Ramanathan V. , Crutzen P. J. , Lelieveld J. , Mitra A. , Althausen D. , co-authors . Indian Ocean experiment: an integrated analysis of the climate forcing and effects of the great Indo-Asian haze. J. Geophys. Res. 2001b; 106: 28371–28398.
- Rastogi N. , Singh A. , Sarin M. M. , Singh D . Temporal variability of primary and secondary aerosols over northern India: impact of biomass burning emissions. Atmos. Environ. 2015; 125: 396–403.
- Rengarajan R. , Sarin M. M. , Sudheer A. K . Carbonaceous and inorganic species in atmospheric aerosols during wintertime over urban and high-altitude sites in North India. J. Geophys. Res. 2007; 112: D21307.
- Sarin M. , Kumar A. , Srinivas B. , Sudheer A. , Rastogi N . Anthropogenic sulphate aerosols and large Cl-deficit in marine atmospheric boundary layer of tropical Bay of Bengal. J. Atmos. Chem. 2010; 66: 1–10.
- Sciare J. , Oikonomou K. , Favez O. , Liakakou E. , Markaki Z. , co-authors . Long-term measurements of carbonaceous aerosols in the Eastern Mediterranean: evidence of long-range transport of biomass burning. Atmos. Chem. Phys. 2008; 8: 5551–5563.
- Smith B. N. , Epstein S . Two categories of 13C/12C ratios for higher plants. Plant Physiol. 1971; 47: 380–384.
- Srinivas B. , Sarin M. , Kumar A . Impact of anthropogenic sources on aerosol iron solubility over the Bay of Bengal and the Arabian Sea. Biogeochemistry. 2011a; 110: 257–268.
- Srinivas B. , Sarin M. M. , Sarma V. V. S. S . Atmospheric dry deposition of inorganic and organic nitrogen to the Bay of Bengal: impact of continental outflow. Mar. Chem. 2011b; 127: 170–179.
- Srinivas B., Sarin M. Atmospheric pathways of phosphorous to the Bay of Bengal: contribution from anthropogenic sources and mineral dust. Tellus B. 2012; 64: 17174. DOI: http://dx.doi.org/10.3402/tellusb.v64i0.17174.
- Srinivas B. , Sarin M . Light absorbing organic aerosols (brown carbon) over the tropical Indian Ocean: impact of biomass burning emissions. Environ. Res. Lett. 2013a; 8: 044042.
- Srinivas B. , Sarin M. M . Atmospheric dry-deposition of mineral dust and anthropogenic trace metals to the Bay of Bengal. J. Mar. Syst. 2013b; 126: 56–68.
- Srinivas B. , Sarin M. M . PM2.5, EC and OC in atmospheric outflow from the Indo-Gangetic Plain: temporal variability and aerosol organic carbon-to-organic mass conversion factor. Sci. Total Environ. 2014; 487: 196–205.
- Streets D. G. , Bond T. C. , Carmichael G. R. , Fernandes S. D. , Fu Q. , co-authors . An inventory of gaseous and primary aerosol emissions in Asia in the year 2000. J. Geophys. Res. 2003; 108: 8809.
- Sudheer A. K. , Sarin M. M . Carbonaceous aerosols in MABL of Bay of Bengal: influence of continental outflow. Atmos. Environ. 2008; 42: 4089–4100.
- Turekian V. C. , Macko S. , Ballentine D. , Swap R. J. , Garstang M . Causes of bulk carbon and nitrogen isotopic fractionations in the products of vegetation burns: laboratory studies. Chem. Geol. 1998; 152: 181–192.
- Turekian V. C. , Macko S. A. , Keene W. C . Concentrations, isotopic compositions, and sources of size-resolved, particulate organic carbon and oxalate in near-surface marine air at Bermuda during spring. J. Geophys. Res. 2003; 108: 4157.
- Venkataraman C. , Reddy C. K. , Josson S. , Reddy M. S . Aerosol size and chemical characteristics at Mumbai, India, during the INDOEX-IFP (1999). Atmos. Environ. 2002; 36: 1979–1991.
- Venkataraman C. , Habib G. , Eiguren-Fernandez A. , Miguel A. , Friedlander S . Residential biofuels in South Asia: carbonaceous aerosol emissions and climate impacts. Science. 2005; 307: 1454–1456.
- Widory D . Combustibles, fuels and their combustion products: a view through carbon isotopes. Combust. Theory Model. 2006; 10: 831–841.
- Widory D . Nitrogen isotopes: tracers of origin and processes affecting PM10 in the atmosphere of Paris. Atmos. Environ. 2007; 41: 2382–2390.