
Abstract
Mutation is the ultimate source of all genetic variation in populations and yet they remain unobservable and buried in the past. Long-lived individuals of Armillaria gallica, a common opportunistic fungal pathogen of tree roots in temperate forests of the northern hemisphere, provide a spatial context for examining the mutational dynamic. Each individual of A. gallica arises in a single mating between two haploid gametes and the resulting diploid then grows vegetatively to occupy a discrete spatial territory often including many adjacent tree root systems. In effect, this leaves a spatial record of growth over time within which mutations can be localized. To identify mutations, the entire genomes of three spatially separated samples of one individual of A. gallica approximately 200 × 60 m were sequenced and compared. In this comparison, mutations and regions of loss of heterozygosity (LOH) were identified then assayed in another 20 isolates from the same individual by conventional PCR and Sanger sequencing. The genotype network of all mutations and LOH were without internal conflict. Further, the spatial pattern of genotypes was nonrandom and appeared to reflect the vegetative expansion leading to the present-day individual. The results reflect the spectrum of spontaneous mutation in nature and provide insight into cellular generation times.
Introduction
Mutation is the ultimate source of variability in populations, and yet remarkably little is known about the full spectrum of spontaneous mutation before selection has had a chance to act on the population. Further, the timing and location of mutations also is unknown, especially in spatially mixed populations. Only the products of mutations, the mutant alleles, are accessible to observation. Long-lived individuals of Armillaria gallica, a common opportunistic fungal pathogen of tree roots in temperate forests of the northern hemisphere, provide a spatial context for the mutational dynamic. Each individual of A. gallica arises from a single mating between two haploid gametes and the resulting diploid, which is of unique genotype in the population, then grows vegetatively to occupy a discrete spatial territory often including many adjacent tree-root systems (CitationSmith et al. 1992). In effect, this leaves a spatial record of growth over time within which mutations may leave recognizable sectors. Because the growth rate of the fungus is known, the time of individual mutations can be estimated.
In this study we used whole-genome sequencing to examine the mutation dynamic in a single individual of A. gallica. The rationale was twofold. First, we wished to establish proof-of-principle in capturing the spectrum of spontaneous mutation. Under these conditions only dominant mutations with a deleterious effect on cellular growth rate are expected to be lost; all other types of mutations should be preserved in the spatial record. Individuals of A. gallica therefore resemble laboratory mutation-accumulation lines (CitationLynch et al. 2008), but in two spatial dimensions reflecting growth on a substrate. In addition to mutation, mitotic loss-of-heterozygosity (LOH) and their extent on the chromosomes (CitationJudd and Petes 1988) also should be observable. LOH may happen in a number of ways with different expectations for the size of the region affected. For example, in gene conversion a short chromosomal segment of one homolog is replaced by new DNA templated by the other homolog. In a mitotic crossover the assortment of a recombinant with a non-recombinant homolog results in homozygosity of the entire portion of a chromosome arm distal to the point of exchange. Second, we wished to examine the spatial distributions of mutant sectors to infer the history of growth, including the effective number of cell divisions required per unit distance of growth.
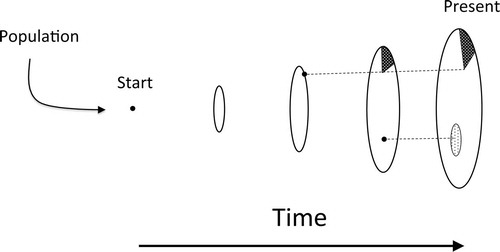
We envision three models that explain the growth of individuals (). Under Model 1, the individual grows to occupy a contiguous territory, leaving discrete mutant sectors. This model should result in a genotype network with internal branching structure because each unit of linear growth on average is equally represented in the mutation record. Under Model 2, after occupying a territory, an individual remains in place, but localized patches within the individual may die off or serve as inoculum for recolonization of new food bases that become available. The localized patches accumulate additional, unique mutant alleles over time, but each local recolonization represents a bottleneck that reduces diversity in the patch to as little as one genotype. This process should result in a lengthening of the terminal branches of the genotype network. Under Model 3, the mutant genotypes become intermixed over time and signal of the original expansion becomes degraded. A mutant sector effectively diffuses out and mixes spatially with the other genotypes of the same individual. Model 3 applies to planktonic populations (or to worms in a bucket) where genotypes are highly intermixed and no spatial structure is apparent or expected. Our data were consistent with Model 1 and possibly Model 2 but were inconsistent with model three.
Fig. 1. Possible patterns of growth of individuals of A. gallica: Model 1. Under Model 1 a unique individual is established through mating and then grows vegetatively to occupy a space, often including many adjacent tree root systems. The dots represent mutations that leave behind mutant sectors. Model 2 is an extension of Model 1; after an individual colonizes a space, it remains in place, but localized patches may die off or serve as inoculum for recolonization of newly available substrates. Under Model 3, any given genotypic sector diffuses outward and becomes spatially mixed with other genotypes of the same individual, thus degrading the spatial signatures of Models 1 and 2. None of the three models is mutually exclusive of any of the other models.
Materials and Methods
The collection site, Exe Island, Rideau Lakes, Ontario, was selected because two genetic individuals of A. gallica were identified on the island in 1992 (CitationSaville et al. 1996). One of the individuals extended over the length of the island and provided the material examined here. In 2010 and 2011, 26 samples, 23 from rhizomorphs and three from the tissues of fruit bodies of A. gallica, were collected. Cultures were made, and DNA extracted, as described by CitationSaville et al. (1996). In addition dried mycelia were available from five 1992 collections and DNA was extracted and genotyped.
To identify individuals, all collections were genotyped by amplifying and sequencing 10 genomic regions () examined in CitationHodnett and Anderson (2000). In the present sample, the two individuals on Exe Island were distinct at numerous sites within these regions (); there were 23 isolates of an individual covering a larger territory and six of another covering a smaller territory. The genotype of the larger individual matched the genotypes of five collections obtained in 1992 (CitationSaville et al. 1996); we designate the larger as Individual 1 and the smaller as Individual 2. In addition, one individual from a nearby location on the mainland (Individual 3) and one (Individual 4), the “humungous fungus” of Michigan (CitationSmith et al. 1992), also had unique sequence types.
Table I. Primers and genomic sequences used in genotyping individuals of A. gallica
Table II. Sequence polymorphisms distinguishing individuals of A. gallica
The isolates were characterized further by somatic incompatibility reactions. The 29 cultures from Exe Island plus one from the individual on the mainland were paired in all possible combinations by the method of CitationShaw and Roth (1976). Cultures from the same individual merged seamlessly, but cultures from different individuals (as identified by sequencing) produced a brown reaction line at the junctions of the paired mycelia. All further analysis was done on Individual 1.
One culture (designated Ar7) was subjected to Illumina sequencing by the BGI with four different paired-end libraries (inserts 200, 350, 700, 5000 bp) and a total of 18 GB of data. Assembly also was done by the BGI (Soap de novo 1.05), resulting in 7502 contigs with a total size of ca. 86 MB, a ND50 of 26.4 kbp, a maximum of 531 kbp and a minimum of 1000 kbp.
As an initial check on the quality of the assembly, the 10 sequences used for genotyping were assembled to the reference genome sequence and all aligned cleanly to single locations (). In addition, a single region resembled the divergently transcribed homeodomain genes of A-mating-type locus and corresponded to actual mating types determined in test pairings of haploids (data not shown). Several genes resembling alpha pheromone receptors also were identified but were not investigated further. In addition to the reference, two collections (Ar9, Ar14) were resequenced, each from one paired-end library (500 bp inserts) for a total of 9 GB of data. Reads were aligned with the reference with SOAPaligner 2.21.
SNPs were called in collections Ar7, Ar9 and Ar14 in comparison to the Ar7 reference to identify potential mutant sites (SOAPsnp), most often evident as mixed bases, presumably representing heterozygosities. The total numbers of SNPs, as well as SNP sites that were heterozygous in Nos. Ar9 and Ar14 but not in Ar7 are included herein (); these sites comprised the candidate list for variation due to mutation or LOH. It is important to note that the amount of variation discovered is dependent on the number of comparisons, which in this study was two: Ar7 vs. Ar9 and Ar7 vs. Ar14; more genomewide comparisons among collections could reveal more variation.
Table III. SNPs in Ar9 and Ar14, relative to the reference Ar7
Candidate SNPs were tested by DNA amplification and Sanger sequencing (). Primers were designed using the default setting of Geneious 6.1.5; only primers with none of the putative SNP sites () were used. A total 10 candidate sites chosen randomly from the unfiltered lists of SNPs () revealed no variation on testing; either the SNP was not present in any of Ar7, Ar9 and Ar14 (SNP falsely called in all three) or the SNP sites were heterozygous in all (SNP failed to be called in either Ar9 or Ar14 or both).
Table IV. Primers for detecting SNPs within Individual 1
To increase the chances of finding variation, filters were applied to the candidate lists for Ar9 and Ar14. Only SNPs with the highest quality sequence score (99) were considered. Of these, we also required that no Illumina reads for alternate allele in Ar9 or Ar14 were registered in Ar7. These filters narrowed the candidate lists to 248 SNPs for Ar9 and 68 for Ar14. Of 40 primer pairs, 37 yielded amplicons and Sanger sequence data for Ar7, Ar9 and Ar14. Of these, 12 primer pairs revealed true variation (success rate of 30%) and these were the focus of this study (, ).
Fig. 2. Exploded map of genotype sectors on the collection site, Exe Island, Portland, Ontario. The changes associated with the genotype network are provided ().
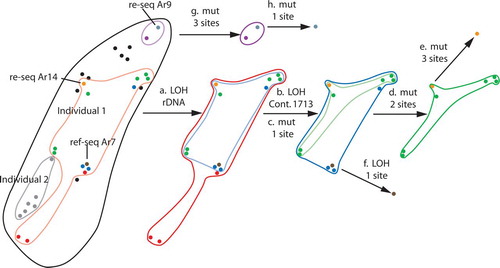
Table V. Changes in the genotype network
In addition to the SNPs, another marker was followed, a 0.4 kb indel in the 26 rRNA gene that was polymorphic in the A. gallica population (CitationSaville et al. 1996); this polymorphism was assayed by amplification of a region including the indel and gel electrophoresis. The primers used for this polymorphism are provided ().
Results and Discussion
The key question was how genotypic variation would be distributed spatially within Individual 1. Remarkably the resident genotypes within Individual 1 occurred in a spatially coherent pattern in which the mutant sectors were perfectly nested; the exploded mapped mutant sectors () and recorded genotypic changes (). The mutations and LOH separating the parts of the map constitute the genotype network (). A spatial autocorrelation test of the spatial distributions of the rDNA types based on longitude and latitude coordinates indicated a highly nonrandom pattern (P < 0.001).
In addition to the coherent spatial distribution, the genotype network (, ) was without phylogenetic conflict; considering each pair of sites at which changes occurred, there were no examples of all four possible combinations of nucleotides. Therefore, each change was unique and there was no recombination among mutant sites. However there were two changes that affected the same nucleotide site. On contig 757, site 4700, one T in the TT homozygote first changed to a C to create a T/C (Y) heterozygote (step c in ) and subsequently the remaining T also changed to a C (step f in ) to yield a CC homozygote. This kind of anomaly would be highly improbable given random mutation in a genome of 90 MB. A possible explanation would be ectopic alignment of small repeated regions, with attendant gene conversion. A genomewide search, however, failed to detect any substantial repeats of this region in the genome. The site in question lies in a putatively noncoding region and so the involvement of a regular genetic switching mechanism, like that for mating types, is not likely.
The events in the rDNA and in contig 1713 were particularly revealing in the genotype network because they can be explained only by LOH, not mutation. These two LOH events occurred internally in the network and effectively polarize the remaining single-site changes by their constrained ancestral and derived states. The rDNA marker is polymorphic in the general population (the frequency of the 0.4 kb insertion is approximately 12% in the population). A loss is therefore much more plausible than a gain of precisely the same fragment size as found in the general population during growth of the individual. Further, the event on 1713 is much more plausible as a single LOH affecting 34 adjacent single sites over a 4 kb segment of chromosome than simultaneous mutational events independently affecting the same 34 sites. Because the region without heterozygosity is flanked by regions that retain heterozygous sites, we surmise that the most likely cause of this LOH was gene conversion. The sizes of gene conversion tracts in Saccharomcyes cerevisiae are commonly similar (CitationJudd and Petes 1988). The LOH in contig 1713 was the only one of its kind found in the entire genome.
With the genotype network and the spatial distribution of the genotypes in hand, the three models of growth can be evaluated. The finding of perfectly nested sectors is consistent with expansion of the individual from a single point of origin (Model 1), like the appearance of mutant sectors in a fungal colony growing on an agar surface. The three mutations unique to Ar14 and the one unique to Ar9 are consistent with Model 2, the localized recolonization of substrates by the fungus, but more genomewide analysis of more isolates are necessary to conclusively test this model. In contrast to Models 1 and 2, Model 3, the randomization of sectors in space, is rejected for this fungal individual because the nesting pattern of mutant sectors would have been degraded by this mode of growth colonization. It remains to be seen whether other individuals of A. gallica reveal the same kind of spatial pattern of mutant sectors.
With the spatially nested pattern of mutant sectors, it would seem possible at first glance to estimate the rate of mutation. Unfortunately mutation rate and numbers of cell divisions are confounded: The pairwise count of site differences between collection points (D) equals the mutation rate (μ) times the total numbers of cell generations (N) separating the pair (D = Nμ). Although the linear growth rate of rhizomorphs has been estimated (Saville et al. 1995), the rate of cell division in the rhizomorph tips is not known and cannot easily be estimated.
Even though mutation rate cannot be estimated from our data, limited speculation about cell-division rates is possible if we conservatively assume a mutation rate of 10−10. This value is well within the range for microorganisms with DNA genomes (CitationDrake 1991, CitationDrake et al. 1998) and is about threefold lower than the rate of spontaneous mutation in Saccahromcyes cerevisiae (CitationLynch et al. 2008). With a genome in A. gallica of 108 bp, one mutation would be expected on average for every 100 cell divisions in a haploid and 50 in a diploid. Taking the pair of Ar7 and Ar9, only four mutations in total were found among 27 candidates from the filtered list. Of the remaining 228 candidate sites not examined here, we might expect to discover another 60 mutations given our success rate of 30% in finding true variation among the filtered lists of candidate sites. Rounding up to the nearest order of magnitude, 100 mutations, it follows that there should be about 5000 cell divisions of growth separating Ar7 from Ar9. The minimum total distance covered by the growing fungus between the collection points of Ar7 and Ar9 was ca. 100 m. The effective rate of cell division therefore could be approximately one for every 2 cm of linear growth. This is a surprisingly large value given the small fungal cells in rhizomorphs. (Setting the mutation rate higher than 10−10, i.e. less conservatively, would increase the estimate of the linear distance of growth per cell division). The distance between the collection points of Ar7 and Ar14 is ca. 60 m and the total estimated number of mutations is estimated to be about 30, suggesting 1500 cells divisions, or one division for each 3 cm growth.
How can the rate of cell division be so low in rhizomorph tips? One possibility is that most of the linear extension of a rhizomorph tip may be due primarily to cell division and expansion in the subapical regions. The inoculum potential for new infection, however, is concentrated at the tip. This suggests that the rhizomorph tips may behave analogously to the apical meristems of plant roots. In plants, the rates of molecular evolution are strongly dependent on the number of mitotic divisions (CitationLanfear et al. 2013). In both root and shoot meristems, the quiescent zone in which cell division rates are reduced may shelter the population from mutations, some of which are deleterious. Rhizomorph tips may function analogously to apical meristems in plants, reducing the number of cell divisions per unit length of growth and similarly sheltering the population from mutation. This model postulates that the subtending cells of the rhizomorph do most of the division and expansion that propel the tip forward. The cells in the tip divide less and therefore accumulate mutations more slowly than the subtending cells. With its long periods of vegetative growth, selection may have favored this mechanism for reducing the effect of mutation, some proportion of which is always deleterious.
Another possibility, not mutually exclusive with the possibility of minimizing cell division per unit length of rhizomorph growth, is that our conservative mutation rate of 10−10 still might be too high; selection might have driven mutation rates even lower in A. gallica by ramping up the fidelity of DNA repair systems. The current view is that the lower bound of mutation rates is not set by the opposing cost of higher fidelity in replication and repair systems; instead the lower bound for low mutation rates is reached when the effect of drift overwhelms the effect of selection (CitationLynch 2010, Citation2011). This study suggests that analysis of selection patterns in genes for control of cell division and DNA repair in populations of A. gallica might be illuminating.
Of all the SNP sites, eight were in noncoding DNA and four in coding regions; this roughly corresponds to the percentage of coding DNA in the 86 mb assembly (ca. 25%). Of the four mutations in coding regions, all were nonsynonymous (). Although all four putative genes are of unknown function, all have counterparts in other basidiomycete fungi (). With the small number of recorded mutations, there is no reason at present to question the expectation that most mutation in A. gallica is selectively neutral. Additional individuals and more variability would be needed to address the possibility of variation in mutations rates in different genomic regions or types of sequences.
Our study demonstrates the principle that fungal individuals can provide the spatial context for examining the mutation dynamic during growth. With this proof-of-principle and more genome data, it should be possible to capture the spectrum of spontaneous mutation under natural conditions to an extent not possible previously.
Acknowledgments
This work was supported by a Discovery Grant from the Natural Sciences and Engineering Research Council of Canada. We thank Richard P. Korf for permission to collect A. gallica on Exe Island, Cindy Short for technical assistance and Uschi Kohn-Anderson for field assistance.
Literature cited
- DrakeJW. 1991. A constant rate of spontaneous mutation in DNA-based microbes. Proc Natl Acad Sci USA 88:7160–7164, doi:10.1073/pnas.88.16.7160
- DrakeJWCharlesworthBCharlesworthDCrowJF. 1998. Rates of spontaneous mutation. Genetics 148:1667–1686.
- HodnettBAndersonJB. 2000. Genomic stability of two individuals of Armillaria gallica. Mycologia 92:894–899, doi:10.2307/3761585
- JuddSRPetesTD. 1988. Physical lengths of meiotic and mitotic gene conversion tracts in Saccharomyces cerevisiae. Genetics 118:401–410.
- LanfearRHoSYWDaviesTJMolesATAarssenLSwensonNGWarmanLZanneAEAllenAP. 2013. Taller plants have lower rates of molecular evolution. Nat Comm 4:1879, doi:10.1038/ncomms2836
- LynchM. 2010. Evolution of the mutation rate. Trends Genet 26:345–352, doi:10.1016/j.tig.2010.05.003
- LynchM. 2011. The lower bound to the evolution of mutation rates. Genome Biol Evol 3:1107–1118, doi:10.1093/gbe/evr066
- LynchMSungWMorrisKCoffeyNLandryCRDopmanEBDickinsonWJOkamotoKKulkarniSHartlDLet al. 2008. A genomewide view of the spectrum of spontaneous mutations in yeast. Proc Natl Acad USA 105:9272–9277, doi:10.1073/pnas.0803466105
- SavilleBJYoellHAndersonJB. 1996. Genetic exchange and recombination in populations of the root-infecting fungus Armillaria gallica. Mol Ecol 5:485–497, doi:10.1111/j.1365-294X.1996.tb00341.x
- ShawCGRothLF. 1976. Persistence and distribution of a clone of Armillaria mellea in a Ponderosa pine forest. Phytopathology 66:1210–1213, doi:10.1094/Phyto-66-1210
- SmithMLBruhnJNAndersonJB. 1992. The fungus Armillaria bulbosa is among the largest and oldest living organism. Nature 356:428–431, doi:10.1038/356428a0