
Abstract
The potential of 3-D nondestructive imaging techniques such as micro-computed tomography (micro-CT) was evaluated to study morphological patterns of the potential medicinal fungus Hericium coralloides (Basidiomycota). Micro-CT results were correlated with histological information gained from scanning electron microscopy (SEM) and light microscopy (LM). It is demonstrated that the combination of these imaging methods results in a more distinct picture of the morphology of the edible and potentially medicinal Hericium coralloides basidiomata. In addition we have created 3-D reconstructions and visualizations based on micro-CT imagery from a randomly selected part of the upper region of a fresh H. coralloides basidioma: Analyses for the first time allowed an approximation of the evolutionary effectiveness of this bizarrely formed basidioma type in terms of the investment of tissue biomass and its reproductive output (production of basidiospores).
Introduction
Micro-computed tomography (micro-CT) is a nondestructive imaging technique that relies on the same physical and technical bases as computed tomography (CT), using the variability in the density and chemical composition of samples to form images (CitationHounsfield 1973). The sample is exposed to a polychromatic X-ray beam, which is differentially absorbed by the sample, producing a two-dimensional (2-D) projection. Consequently a volume dataset is reconstructed by a mathematical combination of several projections produced at many angles of the sample (CitationFeldkamp et al. 1984), representing the radiodensity of the entire sample. The resulting 3-D dataset can provide a structural map of the internal sample components. Micro-CT devices are essentially a miniaturized form of the volume- or cone-beam CT scanners and can be used for non-invasive 3-D investigations of intrinsic structures. Advantage in the use of micro-CT compared to clinical CT is a significantly higher spatial resolution with a significantly better visualization of anatomical structures (CitationEngelke et al. 1999, CitationCavanaugh et al. 2004, CitationKalender et al. 2009). The latest equipment measurements with a spatial resolution 10 μm–100 nm (CitationBrouwers et al. 2007, Citation2008) are possible (e.g. www.skyscan.be). Micro-CT is now regarded as an attractive and promising analytical tool to study the internal structure of samples from a variety of disciplines including biology (CitationStock et al. 2003, CitationBogart et al. 2010, CitationDinley et al. 2010, CitationSchulz-Mirbach et al. 2012, CitationFaulwetter et al. 2013, CitationSchulz-Mirbach et al. 2013), palaeontology (CitationSutton 2008), geology (CitationKetcham and Carlson 2001), thermochronology (CitationEvans et al. 2008), hydrology (CitationWildenschild et al. 2002), soil science (CitationElliot and Heck 2007a, Citationb; CitationJassogne et al. 2007; CitationTorrance et al. 2008) materials science (Wang 2007, CitationTondi et al. 2009) and medicine (CitationHanson and Bagi 2004, CitationJones et al. 2004, CitationCnudde et al. 2008, CitationMaret et al. 2011, CitationSchnabl et al. 2012). Therefore the usage of micro-CT for fungal research might provide a useful and novel extension to conventional ways. Classical tools for morphological and histomorphological evaluation of fungal specimens include fixation, embedding, cutting, mounting on slides, staining and examination, using different microscopic techniques such as optical microscopy, electron microscopy and fluorescence microscopy. These methods require substantial preparation and interpretation by experts. Micro-CT represents a complementary tool, enabling the investigation with or without sample processing before image acquisition (CitationSteppe et al. 2004). This imaging technique is a powerful tool with several advantages in structural characterization of biological systems: nearly no damaging of samples occurs and repeated scanning of the same sample is possible (CitationDutilleul et al. 2005). In addition imagery from micro-CT measurements also can be viewed and reviewed in 2-D or 3-D while objects of interest can be segmented from the images as digital surfaces or isosurfaces to analyze complex structures (CitationEvans et al. 2008).
The aim of this study is to investigate the architecture of Hericium coralloides (Scop.) Pers. fruiting bodies (basidiomata, “mushrooms”). Many fungi share common morphologic characteristics that are instrumental to the success of fungal growth, development, reproduction, spore dispersal and survival. To date a number of key issues of fungal development have been little or not addressed. The architecture of reproductive systems, for example, still requires more detailed examination. The genus Hericium Pers. taxonomically belongs to the phylum Basidiomycota (Basidiomycota, Agaricomycetes, Russulales, Hericiaceae). All members of this genus produce whitish basidiomata with icicle-like spines either formed on multiple branching or on a tough, unbranched cushion of basidioma tissue, growing mostly on dead or rotting wood (CitationKo et al. 2005, CitationBoddy et al. 2011, CitationDas et al. 2011, CitationPallua et al. 2012, CitationHallenberg et al. 2013). Hericium basidiomata (also mycelia) have long been used in traditional Chinese medicine (TCM) to treat diseases (CitationLu et al. 2002). Hericium erinaceus (Bull.) Pers., which is taxonomically closely related to H. coralloides, has attracted great attention due to its health benefits (CitationWang et al. 2004, CitationMori et al. 2009).
Notwithstanding, understanding the varied architectures of basidiomata, Understanding basidiomata architecture—a “complex, economically constructed systems of cooperating subsystems delicately adjusted to each other” (CitationMoore 1998)—as well as their evolutionary effectiveness in terms of investment of tissue biomass and spore production, still is a an important task in basic mycological research. Because the bizarrely formed basidiomata of H. coralloides can hardly be measured or modeled under conventional methods, we gained the primary data on its hymenophoral surface area (the area occupied by the spore-producing basidia) and hyphal texture in the sterile basidioma tissues through micro-CT.
Materials and Methods
Fungal material
Hericium coralloides basidiomata collected in a forest near Innsbruck were used. Voucher material is deposited in the Mycological Collection of the Herbarium of the University of Innsbruck (IB 20060500). One specimen from a fresh basidioma including different orders of side branches was fixed with 3% formaldehyde. After fixation the specimen was critical-point dried (see SEM preparation). The dried specimen was photographed for anatomical reevaluation and comparison to the CT imaging results.
Light microscopy (LM)
Light microscopy was carried out with a Leitz Diaplan with DIC-Nomarski equipment and an automatic photosystem (Leitz Vario-Orthomat 2). For the anatomical characterization of the fresh basidioma, samples were taken from different parts (from the outermost region of branches down to the stem) for squash mounts in water and 3% KOH or were stained with Congo red and cotton blue.
Tissue section preparation and data acquisition for scanning electron microscopy (SEM)
Specimens cut from different parts of the fresh basidioma were fixed with glutaraldehyde 2.5% in 0.1 M cacodylate buffer for 24 h (pH 7.4), then washed three times with 0.1 M cacodylate buffer for 15 min (pH 7.4) and incubated 1 h in 1% unbuffered aqueous osmium tetroxide. The specimens then were dehydrated in graded ethanol (70%, 80%, 90%, 95%, 100%; 10 min each), critical-point dried, attached to aluminium stubs, coated in an MED020 system (Bal-Tec AG, Liechtenstein) with gold-palladium to a nominal depth of 15 nm and viewed in a DSM982 Gemini field emission scanning electron microscope (Zeiss, Oberkochen, Germany) operating at 5 kV. Digital photos were taken at 1024 × 1024 resolution in TIF format. Processing of digital photos and measurements were performed with ImageJ software (http://rsbweb.nih.gov/ij/) and Fiji (http://fiji.sc/Fiji).
Micro-computed tomography (micro-CT)
Micro-CT was used to decipher the micro-anatomical structure of Hericium coralloides basidiomata. To analyze the fine structure, sample preparation and recording parameters were optimized. A representative sample of a fresh basidioma (319.77 mg FW, including different orders of branches named basal branch, side branches and end branches) was fixed with 3% formaldehyde and scanned. The same specimen was incubated 24 h in an iodine-based contrast medium (ULTRAVIST 370, Bayer, Germany) on a thermomixer comfort (Eppendorf) by 700 rpm at 42 C and after preparation scanned. After that the same specimen was critical-point dried (36.99 mg DW) and scanned again. Micro-CT experiments were performed with a SCANCO Viva40CT (Scanco Medical AG, Brüttisellen, Switzerland) with 10.5 μm isotropic voxel and with 45 kV, 177 μA tube current, 380-millisecond exposure time and 2000 projections. The image stacks were 2048 × 2048 × 579 voxels with 16-bit gray-value resolution.
Imaging data processing and analysis
For data processing and data analysis, the results were transferred to a high-performance 64-bit PC with 32-GB RAM featuring ImageJ (http://rsbweb.nih.gov/ij/), Fiji (http://fiji.sc/Fiji), ITK-SNAP 2.4 (www.itksnap.org CitationYushkevich et al. 2006) and Amira 5.3.3 (FEI Visualization Sciences Group, Mérignac Cedex, France). The software packages were used to perform the measurement routines (ImageJ, Fiji), segmentation (ITK-SNAP) and volume and surface-based visualization or combination of both (Amira).
Morphological analysis of trama hyphae
For analyses of hyphal morphology the simple neurite tracer plugin (http://homepages.inf.ed.ac.uk/s9808248/imagej/tracer/) and the image processing package Fiji (http://fiji.sc/) were used. This plugin is designed to allow easy semiautomatic tracing of neurons or other tube-like structures through 3-D image stacks. Its algorithm is based on Sholl analysis (CitationSholl 1953, CitationCaserta et al. 1995, CitationLongair et al. 2011). Individual lateral and longitudinal hyphae were traced, and 3-D reconstructions based on the acquired binary maps of the respective tree analyses were made. Sholl analysis was used for determination of arbour size and branching, executed within Fiji with optimized parameters such as linear method with a sphere separation of 2 μm, no normalization. For detailed information about Sholl analysis as well as its theory and current developments see CitationSholl (1953), CitationNeale et al. (1993), CitationRistanovic et al. (2006) and CitationMilosevic and Ristanovic (2007). For further statistics R (www.r-project.org) was used.
Surface area calculation
Surface area is defined as the basal area bearing the hymenial elements or the surface area provided by basidioma branches without considering basidioles, basidia and cystidia. Calculations were performed with Amira and ITK-SNAP. The necessary preprocessing steps included segmentation using the Magic Wand tool, following a connected component algorithm to ignore irrelevant structures such as small pieces caused by the inherent image noise. In a subsequent process the surface was extracted via a marching cube algorithm for surface area calculation.
Calculation of potential spore production
The palisade-like layer on the hymenophoral surface consisting of club-shaped basidioles and basidia displays a maximum packing density. For the calculation of the number of basidia on a given surface area, the average diameter (broadest diameter as seen in side view) of the basidioles (immature basidia) was taken (5.5 μm). The given surface area was divided by the circular area calculated from the average diameter of basidioles, taking into account that not more than 90% (the exact geometrical factor is 0.9069) can be occupied by circles of equal diameter. Because the basidioles are maturing to four-spored basidia, the number of basidioles was multiplied by four to estimate spore production (CitationPöder and Kirchmair 1995).
Results and Discussion
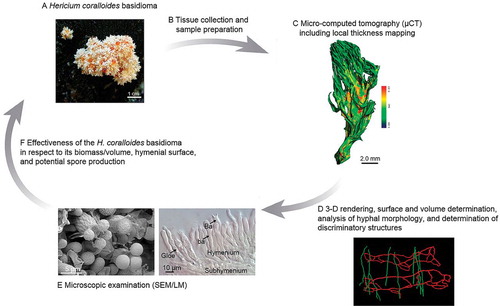
The focus of this study was the morphological and histo-anatomical investigation of the bizarrely formed Hericium coralloides basidiomata by micro-computed tomography (micro-CT) in combination with light microscopy (LM) and scanning electron microscopy (SEM). The integration of these imaging techniques represents a novel multimodality imaging platform, offering a powerful way to investigate histo-anatomical structures in detail. A schematic diagram of the work flow for forming the imaging platform is presented (). Our aim was to evaluate the effectiveness of the H. coralloides basidioma with respect to its biomass/volume, hymenophoral surface and potential spore production. Because basidiomata of this fungus can hardly be measured or modeled using conventional methods, we gained the primary data on its surface, volume and microstructure through micro-CT analyses. For the investigation of the H. coralloides basidioma by micro-CT, the optimization of measurement parameters and the analyses of the obtained data were necessary.
Fig. 1. Overview of the imaging platform for the characterization of H. coralloides basidiomata. A. Basidioma on rotten wood of Abies alba. B. Sample preparation. C. 3-D surface rendering including a color-coded local thickness mapping of the fruiting body based on segmented parts made from micro-CT imagery. D. Data processing. E. Light microscopy (DIC); hymenium in vertical section, and scanning electron microscopy (SEM) of the hymenial surface. F. Overlay of all datasets will allow an estimation of the potential spore production (effectiveness of the H. coralloides basidioma).
Macroscopic and microscopic features
For morphological and anatomical characterization of the fresh basidioma via LM and SEM, samples were taken from different parts of the entire basidioma (from the outermost region of branches down to the stem base). The macroscopic () and the microscopic architecture () of the basidioma is presented herein.
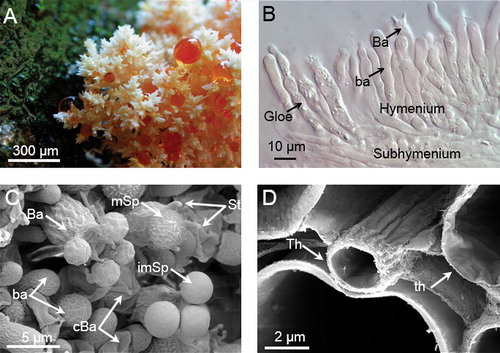
Fig. 2. Macroscopic and microscopic features of Hericium coralloides. A. Detail of the basidioma on rotten wood of Abies alba with orange guttation droplets. B. Micrograph (DIC) of the hymenial layer (Gloe: gloeocystidia; Ba: basidia; ba: basidioles, unstained). C. SEM micrograph of the developing hymenium (ba: basidioles = immature basidia, Ba: basidia – wrinkled surface of basidia is a preparation artefact, St: sterigmata on basidia, imSp: smooth, immature spores on sterigmata, mSp: mature spores with surface ornamentation, cBa: basidium collapsed after spore liberation). D. SEM micrograph of tissue elements below subhymenium in cross section: thin- (th) to thick-walled (Th) hyphae of varying diameter. Measurements of basidioles and basidia were used for calculations of spore production.
Hericium coralloides produces whitish basidiomata consisting of an irregular dichotomously branched framework, which ends in a mass of fragile icicle-like spines, growing on rotting wood ().
The arrangement of the hymenial layer is presented herein (). The surface (hymenophoral) area of the basidioma (from the basal branch to the fine tip ends) was covered by the hymenial layer (av. thickness about 50 μm) consisting of basidioles and basidia, intermixed with sterile cystidia. SEM images of the hymenium and the underlying monomitic tissue also are provided (). Most of the mature, spore-forming, slightly clavate basidia (= the meiosporangia) are surrounded by six basidioles (immature basidia) () and thus are almost regularly distributed in the hymenium. Such a pattern, which is not uncommon in Agaricomycetes, has been explained by evolutionary optimization processes leading to the most densely packed arrangement of basidioles, followed by a time-shifted maturation of them into basidia to also maximize spore production (CitationBuller 1909; CitationIngold 1946; CitationCorner 1947, Citation1948; Fischer and Money 1948; CitationBond 1952; CitationReijnders and Heim 1963; CitationPöder 1983, Citation1984, Citation1992; Moore 1994; CitationDonker et al. 1997), although distinct patterns of this differentiation have not yet been deciphered. The sterile, monomitic tissue (sterile hyphae of one type only, not intermixed with binding or skeletal hyphae) below the hymenial layer (subhymenium included) consists of thin- to thick-walled (0.05–0.2 μm) generative hyphae (2.5–5.5 μm diam) (n = 30) ().
Optimization of sample preparation for micro-computed tomography (micro-CT)
Optimization of sample preparation for micro-CT imaging experiments is an important step to get high quality results. Limiting factors for such results are the achievable spatial and contrast resolution, which depends on the hardware of the scanner (X-ray tube voltage capability, detector dynamic resolution) and the X-ray contrast of the specimen under investigation. For this purpose the selected fungal specimen was measured in three different sample preparation conditions (formalin, formalin with contrast agent, critical-point dried with contrast agent). Images of the sample in formalin did not contain sufficient information to be useful in tissue analysis in that only basic features of the fungal sample could be visualized. The hymenium and subhymenium, for example, could be identified but with extremely vague boundaries. The underlying monomitic tissue could not be identified with this form of preparation. Because several studies have demonstrated that iodine staining generates high resolution micro-CT images of soft tissue (CitationHanson and Bagi 2004, CitationJeffery et al. 2011, CitationAslanidi et al. 2013, CitationClark et al. 2013), the same sample was treated with an iodine-based contrast medium (ULTRAVIST 370, Bayer, Germany) to improve the contrast of the specimen; however, this caused over-contrasting. Subsequently the same specimen was critical-point dried after dehydration in graded ethanol to remove the excess of contrast agent. Comparison of images indicates that critical-point drying with contrast agent provided the best results for structural and histological characterization. As an example, an image of a multiplanary reconstruction based on the medial-longitudinal axis with the corresponding volume rendering is presented (). 3-D surface-rendered images () including local thickness analysis (CitationHildebrand and Rüegsegger 1997) () are illustrated (, which depicts the capability of micro-CT imaging to accurately reproduce the histo-morphology of the fungal material). Another image () displays the primary structure (basal branch, subsequent lateral branches and end branches) of the basidioma specimen; a more or less irregular dichotomously to verticillate branching of the basal branch can be observed. Also a broad lumen in the basal branch could be identified in this sample (). In CitationPallua et al. (2012) prominent luminal structures, especially within wider branches, were detected. Details of the trama tissue (see ) can be represented by this sample preparation.
Fig. 3. 3-D reconstructions and visualizations based on micro-CT imagery of a Hericium coralloides basidioma sample. A. Fixed and critical-point dried sample. Three histo-anatomical features can be recognized on the optical image (CitationPallua et al. 2014): basal branch (1), side branches (2), and end branch structures (3). B. 3-D surface rendered image of the micro-CT-dataset processed by a connected component algorithm to ignore irrelevant structures such as small pieces caused by the inherent image noise. C. 3-D surface rendered image of the spatial thickness distribution (0–357 μm).
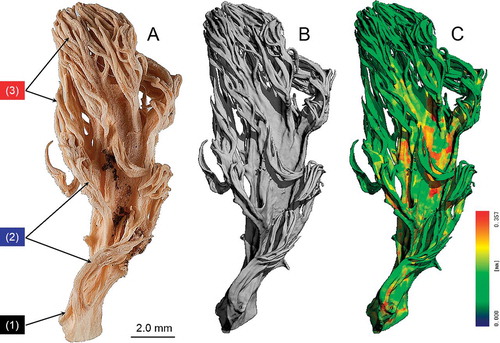
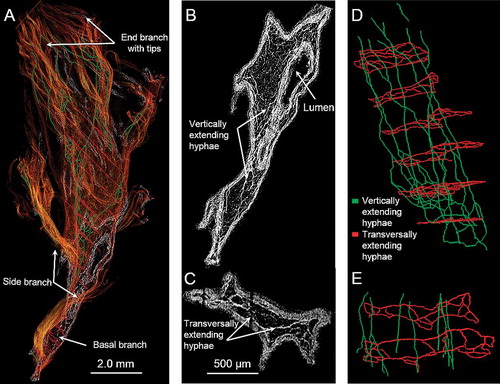
Fig. 4. Morphology of the trama tissue of basidioma branches. A. Medial-longitudinal plane with overlaid volume rendering and reconstructed vertically (green) and transversally extending hyphae (red). B. Medial-longitudinal plane in the basal region representing a lumen and vertically running hyphae. C. Transversal hyphae within the basal branch. D, E. 3-D reconstruction of vertical and transversal hyphae in the basal branch.
It could not be clarified why only certain hyphae were stained by the iodine-based contrast medium. One explanation for the retention of iodine in certain hyphae might be that the contrast agent becomes entrapped within the complex structure of polysaccharides (e.g. cell wall chitins and glucans), which also was suggested in CitationYu et al. (1996), CitationLecker et al. (1997) and CitationJeffery et al. (2011). The enhanced contrast on the micro-CT images therefore would correspond to a relative increase of X-ray absorption in these cells, due to the presence of iodine, suggesting that chemically different types of hyphae exist. This also was observed in CitationPallua et al. (2012). Therefore, micro-CT imaging seems to be well suited for the identification of fungal tissue structures, but it should be noted that an additional discrimination of histological structures, such as basidia, basidiospores, basidioles, gloeoplerous hyphae or cystidia and spores was not possible.
Results () illustrate the capability of micro-CT imaging to accurately reproduce 3-D morphology of fungal material. An image () represents a photograph of the fixed and critical-point dried H. coralloides sample, which afterward was measured by micro-CT. This photograph serves for comparison with the 3-D reconstructions based on the micro-CT imagery (). Three histo-anatomical features can be recognized: basal branch (1), side branches (2), and end branch structures (3). A 3-D surface-rendered reconstruction based on a micro-CT volume dataset () correlates well with the morphology of the specimen. A 3-D visualization (3-D surface rendering) of the local spatial thickness distribution is provided ().
Morphological analysis of trama hyphae
In mycology the texture type of hymenium-bearing structures (= hymenophores like e.g. gills, tubes and pores) is a taxonomically important character, which may reflect also phylogenetic relationships. (In our case, the entire basidioma serves as hymenophore.) Therefore for the first time we tried to reconstruct the texture type of basidioma branches (contrasted and critical-point dried) based on the micro-CT imaging data. The classical method for such an analysis is the light microscopic observation of hymenophore sections (e.g. vertical sections through gills or tubes). In this study we used the Sholl analysis, which is commonly used in neuroscience for dendritic arborization patterns. 3-D Sholl analysis was used exemplarily for the analysis of tree-like structures, such as hyphae and correlated visualization based on 3-D reconstructions of one single, vertically (along the length axis of branches) extending hypha and one single hypha in a transversal plane to elucidate the type of tramal texture. For a more accurate branching interval estimation, 3-D Sholl analysis was used, where longitudinal (n = 50) and lateral hyphae (n = 50) with their branches were reconstructed with the simple neurite tracer plugin and the image-processing package Fiji.
The results of the trama tissue analysis based on Sholl analysis (included in Fiji) is demonstrated (). As mentioned above, not all trama tissue hyphae were stained by the contrast medium, the results, however, revealed some new details about the hyphal arrangement within the basidioma tissue, which cannot be detected by LM and SEM: the design is strongly reminiscent of reinforced concrete constructions in modern structural and civil engineering. The entire sample (from the basal branch to the end branches/tips) was scanned. All analyses concerning the trama structure was performed in 3-D. To keep the visualization as clear as possible, well defined regions (every 50th image) of the transversal structures were selected (). Medial-longitudinal planes () were used for tracking vertically extending (along the length axis of divers branches) hyphae (green) and transverse planes () for transversal extending hyphae (red). A 3-D volume rendering () based on the micro-CT dataset overlaid with reconstructed vertically hyphae (green) and transversal hyphae (red). The hyphal arrangement within the tissue of the basal branch is demonstrated ().
Exemplary images of both a single, transversally extending hyphal system of strongly anastomosing hypha () and a single, vertically running hypha () are presented. Transverse planes () were used of transversal extending hyphae (red) and medial-longitudinal planes () for tracking vertically extending hyphae (green). Anastomosis is an important capability of hyphae, by which hyphal fusions between branches of the same or different hyphae are formed, allowing a more or less unrestricted protoplasmic flow between involved hyphal elements (cellular compartments). In addition the anastomosing transversal hyphal network may improve the stability of the tissue. The question whether the system () originally was formed by the proliferation of only a single hypha could not be determined.
Fig. 5. Exemplary images of both a single, net-like, transversally extending hyphal system formed by a strongly anastomosing hypha (hyphae) (A) and a single, vertically running hypha proliferating by branching (B).
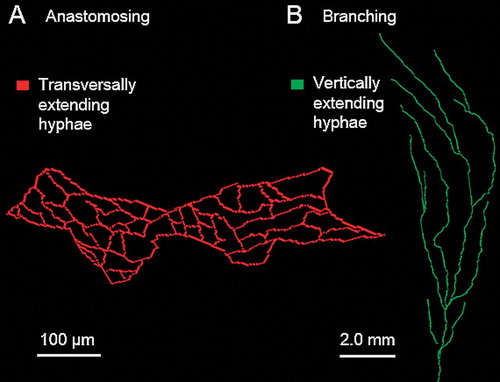
Vertically extending hyphae proliferate mostly by branching but rarely form true anastomoses. To confirm this observation, 3-D Sholl analyses were performed on 50 vertically running and 50 transversal hyphae, which were reconstructed with the simple neurite tracer. The spatial extent of branching was estimated by two parameters: (i) the total hyphal length including all hyphal branches and (ii) the branching frequency (Sholl analysis). The two parameters were significantly correlated: (a) longitudinal hyphae: P < 0.05, Spearman’s rank correlation coefficient, P value = 0.837, and (b) lateral hyphae: P < 0.05, Spearman’s rank correlation coefficient, P value = 0.895. Transversal hyphae formed 3.5 (SD ± 1.37) anastomoses per millimeter, vertical hyphae 1.39 (SD ± 0.32) branches per millimeter.
Surface area calculation
For reliable calculations of the specimen’s surface area (with Amira 5.3.3.), the micro-CT datasets of three different sample preparation conditions (formalin, formalin with contrast agent and critical-point dried with contrast agent) were used and results critically compared with each other: (i) the surface area of the sample fixed only in formalin could not be determined, (ii) fixation with formalin and iodine-based contrast medium allowed the surface calculation with a value of 787.62 mm2, whereas (iii) the total surface area of the contrasted and critical-point dried sample was calculated to be 626.56 mm2. Before surface calculation the objects were segmented via a gray value-based seeded region growing algorithm. The gray value thresholds were defined as “full width half maximum” (FWHM) measured between surrounding area and maximum intensity at the onset of the specimens’ surface. This procedure allows for a reproducible surface extraction from voxel datasets such as micro-CT. Because shrinkage phenomena due to critical-point drying are widely known (not quantified by us), the higher value (787.62 mm2; three measurements choosing individual FWHM regions were obtained by two observers with an inter-observer variability error of 9.54 mm2 and an intra-observer variability error of 6.89 mm2) was used for subsequent calculations.
Basidioma architecture evaluated by micro-CT Imaging and its evolutionary implications
The most important substructure of a basidioma is the so-called “hymenophore” that forms an increased surface area on which a large number of spore-producing basidia (= hymenial layer) can find its place. A well designed hymenophore plays a crucial role in reproduction and thus for the survival of the fungi. In addition, the final architecture of the different types of hymenophores (e.g. gills, tubes, spines) must warrant successful spore liberation (e.g. providing a minimum distance between gills), allowing discharge of basidiospores (CitationWebster et al. 1995), while the investment of material/energy of such surface-increasing structures should be kept relatively low. Studies have pointed out that development of hymenophoral surfaces of different complexity is determined by physical constraints and obeys geometrical laws (CitationIngold 1946; CitationDonker et al. 1997; CitationPöder 1983, Citation1984, Citation1992; CitationMoore 2003; CitationPöder et al. 2003). Features as well as models of hymenophoral surfaces of fungi and their effectiveness have already been studied exemplarily in basidiomata of Polyporales, Boletales and Agaricales (CitationIngold 1946; CitationCorner 1947; CitationReijnders and Heim 1963; CitationPöder 1983, Citation1992; CitationDonker et al. 1997; CitationMoore 2003; CitationPöder et al. 2003; CitationSteiner 2003; CitationFischer and Money 2010). Regarding the aforementioned issues, the main aim of this study was to evaluate the effectiveness of the H. coralloides basidioma with respect to its biomass/volume, hymenial surface and potential spore production. Because the bizarre basidioma of this fungus can hardly be measured or modeled with conventional methods, we gained the primary data on its surface through micro-CT imaging analyses. In this context it should be remembered that in coralloid fungi the entire basidioma with all its branches serves as hymenium-bearing surface, thus presenting the hymenophore.
For the conversion of volume to biomass (FW), we adopted a bulk density of 0.59 g/cm−3 (SD 0.0167; n = 283), which is a representative global value for the tissue/bulk density for a great taxonomic variety of basidiomata (CitationStögmann et al. 2013) with an average water content of 88.8% (SD 3.04; n = 190), updated 2013 by one of the authors (RP). The water content of the H. coralloides specimen was 88.43% (319.77 mg FW, 36.99 mg DW).
From the data of the micro-CT studies the total surface area of the H. coralloides basidioma was calculated and its potential basidiospore production estimated with microscopic data (LM, SEM; cf. ) on hymenial elements. These results and their significance in relation to the evolutionary effectiveness were compared with that of the King Bolete (Boletus edulis Bull.) from which experimental data is available (CitationPöder and Kirchmair 1995, CitationPöder et al. 2003, CitationSteiner 2003) as well as with theoretical data on the hymenophoral effectiveness of gilled mushrooms (Agaricales) (CitationPöder 1983). Based on the weight of the entire basidiomata (FW), the coralloid, extremely ramified, mature basidioma of H. coralloides produces almost as many basidiospores (minus 7.4%) per gram biomass as B. edulis (). If however, spore production is related only to the reproductive parts of the two mushrooms (the entire basidioma of H. coralloides but only the tubular hymenophore of B. edulis), H. coralloides produces 2.7× fewer spores, thus demonstrating that, in this respect, the tubular strategy is superior when seen from an evolutionary point of view (material/energy input and reproductive output). In CitationPallua et al. (2012) the estimated spore production of H. coralloides was lower by 40% due to the applied method (magnetic resonance tomography), which has a much lower resolution than micro-CT. Concerning the evolutionary effectiveness of different hymenophoral types, it also should be noted that based on empirical models the gill strategy of Agaricales (e.g. button mushroom, fly agaric) is more effective than the tubular one of Boletales (CitationPöder 1983) by about 30%. Furthermore, it may seem surprising that basidioma types as different as those of H. coralloides and B. edulis produce nearly the same quantity of spores (related to entire basidiomata), but this can be explained. The basidioles/basidia of B. edulis are on average twice as wide (10–15 μm) as those of H. coralloides (6–7 μm). Consequently four times as many basidia of the latter are packed on the same area, thus compensating the lower effectiveness of its basidioma/hymenophore type (CitationPöder 1984, CitationPöder and Kirchmair 1995).
Table I. Comparison of some key parameters of Hericium coralloides and Boletus edulis basidiomata related to their reproductive efficiency (values rounded)
Basidiomycetes form extremely different types of basidiomata (fruiting bodies) whose sole function is their reproduction by spores. Their evolutionary effectiveness may be estimated in terms of basidioma-type-specific biomass investment and spore production. Such estimation, however, is often challenging due to the different architectures of basidiomata. To characterize the bizarrely formed basidiomata of Hericium coralloides, we gained the primary data on its hymenophoral surface area (the area on which the spore-producing basidia are formed) and hyphal texture in the sterile basidioma tissues through micro-CT. Unstained hyphal portions within the basidioma tissue (below the hymenium and subhymenium) hindered measurement of the volume/mass of the sample, but these staining drawbacks were not noticeable at the surface layers. To overcome this problem, we adopted a reported bulk density of fungal tissue. The current study revealed several characteristics of the trama tissue not identified in previous anatomical reports. We discovered some new anatomical details about the basidioma tissue: Its design is strongly reminiscent of reinforced concrete constructions in modern structural and civil engineering; within basidioma branches transversally extending hyphae are strongly anastomosing, forming a net-like system through which vertically extending hyphae proliferate by branching. One of the main aims of this study was the evaluation of the effectiveness of the coralloid, extremely ramified H. coralloides basidioma in respect to its biomass, available hymenophoral surface and its potential spore production. Hericium coralloides produces almost as many basidiospores per gram biomass (FW) as Boletus edulis. But if spore production is related only to the spore-producing tissue (the entire basidioma of H. coralloides and the tubular hymenophore of B. edulis), H. coralloides produces 2.7× fewer spores than the bolete, whereas the latter in turn is surpassed by the gill strategy of Agaricales. Because of the high resolution of micro-CT, we also could improve a recent estimation of the available hymenophore surface area that was based on magnetic resonance tomography studies of a H. coralloides basidioma.
Acknowledgments
The authors thank Prof Michael Heβ from the Histology and Embryology section, Innsbruck Medical University and Christine Pallua for their aid in sample collection and preparation. We also gratefully acknowledge Clemens Unterwurzacher from the Department of Traumatology, Innsbruck Medical University, for taking basidioma photos. We also thank Dipl.-Ing. (FH) Gregor Mair M.Sc. from the Leopold-Franzens-University of Innsbruck, Austria, for his aid in data analyses.
Literature cited
- AslanidiOVNikolaidouTZhaoJSmaillBHGilbertSHHoldenAVLoweTWithersPJStephensonRSJarvisJCHancoxJCBoyettMRZhangH. 2013. Application of micro-computed tomography with iodine staining to cardiac imaging, segmentation and computational model development. IEEE Trans Med Imaging 32:8–17, doi:10.1109/TMI.2012.2209183
- BoddyLCrockattMEAinsworthAM. 2011. Ecology of Hericium cirrhatum, H. coralloides and H. erinaceus in the UK. Fungal Ecol 4:163–173, doi:10.1016/j.funeco.2010.10.001
- BogartSJSpiersGCholewaE. 2010. X-ray microCT imaging technique reveals corm microstructures of an arctic-boreal cotton-sedge, Eriophorum vaginatum. J Struct Biol 171:361–371, doi:10.1016/j.jsb.2010.06.009
- BondTET. 1952. A further note on size and form in agarics. Trans Br Mycol Soc 35:190–194, doi:10.1016/S0007-1536(52)80046-4
- BrouwersJELambersFMGasserJAvan RietbergenBHuiskesR. 2008. Bone degeneration and recovery after early and late bisphosphonate treatment of ovariectomized wistar rats assessed by in vivo micro-computed tomography. Calcif Tissue Int 82:202–211, doi:10.1007/s00223-007-9084-3
- BrouwersJEvan RietbergenBHuiskesR. 2007. No effects of in vivo micro-CT radiation on structural parameters and bone marrow cells in proximal tibia of wistar rats detected after eight weekly scans. J Orthop Res 25: 1325–1332, doi:10.1002/jor.20439
- BullerAHR. 1909. Research on fungi. Vol. I. London: Longmans, Green & Co. 287 p.
- CasertaFEldredWDFernandezEHausmanREStanfordLRBulderevSVSchwarzerSStanleyHE. 1995. Determination of fractal dimension of physiologically characterized neurons in two and three dimensions. J Neurosci Methods 56:133–144, doi:10.1016/0165-0270(94)00115-W
- CavanaughDJohnsonEPriceREKurieJTravisELCodyDD. 2004. In vivo respiratory-gated micro-CT imaging in small-animal oncology models. Mol Imaging 3:55–62, doi:10.1162/153535004773861723
- ClarkDPGhaghadaKModingEJKirschDGBadeaCT. 2013. In vivo characterization of tumor vasculature using iodine and gold nanoparticles and dual energy micro-CT. Phys Med Biol 58:1683–704, doi:10.1088/0031-9155/58/6/1683
- CnuddeVMasschaeleBde CockHEOlstadKVlaminckLVlassenbroeckJDierickMWitteYDVan HoorebekeLJacobsP. 2008. Virtual histology by means of high-resolution X-ray CT. J Microsc 232:476–85, doi:10.1111/j.1365-2818.2008.02142.x
- CornerEJH. 1947. Variation in the size and shape of spores, basidia and cystidia in Basidiomycetes. New Phytol 46: 195–228, doi:10.1111/j.1469-8137.1947.tb05079.x
- CornerEJH. 1948. Studies in the Basidium I. The ampoule effect, with a note on nomenclature. New Phytol 47:22–51, doi:10.1111/j.1469-8137.1948.tb05091.x
- DasKStalpersJEberhardtU. 2011. A new species of Hericium from Sikkim Himalaya (India). Cryptogam Mycol 32:285–293, doi:10.7872/crym.v32.iss3.2011.285
- DinleyJHawkinsLPatersonGBallADSinclairISinnett-JonesPLanhamS. 2010. Micro-computed X-ray tomography: a new nondestructive method of assessing sectional, fly-through and 3D imaging of a soft-bodied marine worm. J Microsc 238:123–133, doi:10.1111/j.1365-2818.2009.03335.x
- DonkerHCvan AsHSnijderHJEdzesHT. 1997. Quantitative 1H-NMR imaging of water in white button mushrooms (Agaricus bisporus). Magn Reson Imaging 15:113–121, doi:10.1016/S0730-725X(96)00328-1
- DutilleulPLontoc-RoyMPrasherSO. 2005. Branching out with a CT scanner. Trends Plant Sci 10:411–412, doi:10.1016/j.tplants.2005.06.004
- ElliotTRHeckRJ. 2007a. A comparison of 2D vs. 3D thresholding of X-ray CT imagery. Can J Soil Sci 87: 405–412, doi:10.4141/CJSS06017
- ElliotTRHeckRJ. 2007b. A comparison of optical and X-ray CT technique for void analysis in soil thin section. Geoderma 141:60–70, doi:10.1016/j.geoderma.2007.05.001
- EngelkeKKarolczakMLutzASeibertUSchallerSKalenderW. 1999. Micro-CT. Technology and application for assessing bone structure. Radiologe 39:203–212, doi:10.1007/s001170050497
- EvansNJMcInnesBISquelchAPAustinPJMcDonaldBJWuQ. 2008. Application of X-ray micro-computed tomography in (U–Th)/He thermochronology. Chem Geol 257:101–113, doi:10.1016/j.chemgeo.2008.08.021
- FaulwetterSVasileiadouAKouratorasMThanosDArvanitidisC. 2013. Micro-computed tomography: introducing new dimensions to taxonomy. Zookeys 263:1–45, doi:10.3897/zookeys.263.4261
- FeldkampLDavisLKressJ. 1984. Practical cone-beam algorithm. JOSA A 1:612–619, doi:10.1364/JOSAA.1.000612
- FischerMWFMoneyNP. 2010. Why mushrooms form gills: efficiency of the lamellate morphology. Fungal Biol 114:57–63, doi:10.1016/j.mycres.2009.10.006
- HallenbergNNilssonRHRobledoG. 2013. Species complexes in Hericium (Russulales, Agaricomycota) and a new species—Hericium rajchenbergii—from southern South America. Mycol Prog 12:413–420, doi:10.1007/s11557-012-0848-4
- HansonNABagiCM. 2004. Alternative approach to assessment of bone quality using micro-computed tomography. Bone 35:326–333, doi:10.1016/j.bone.2004.02.019
- HildebrandTRüegseggerP. 1997. A new method for the model-independent assessment of thickness in three-dimensional images. J Microsc 185:67–75, doi:10.1046/j.1365-2818.1997.1340694.x
- HounsfieldGN. 1973. Computerized transverse axial scanning (tomography) 1. Description of system. Br J Radiol 46:1016–22, doi:10.1259/0007-1285-46-552-1016
- IngoldCT. 1946. Size and form in agarics. Trans Br Mycol Soc 29:108–113, doi:10.1016/S0007-1536(46)80034-2
- JassogneLMcNeillAChittleboroughD. 2007. 3D-visualization and analysis of macro-and meso-porosity of the upper horizons of a sodic, texture-contrast soil. Eur J Soil Sci 58:589–598, doi:10.1111/j.1365-2389.2006.00849.x
- JefferyNSStephensonRSGallagherJAJarvisJCCoxPG. 2011. Micro-computed tomography with iodine staining resolves the arrangement of muscle fibers. J Biomech 44: 189–192, doi:10.1016/j.jbiomech.2010.08.027
- JonesACMilthorpeBAverdunkHLimayeASendenTJSakellariouASheppardAPSokRMKnackstedtMABrandwoodAet al. 2004. Analysis of 3-D bone ingrowth into polymer scaffolds via micro-computed tomography imaging. Biomaterials 25:4947–4954, doi:10.1016/j.biomaterials.2004.01.047
- KalenderWADeakPKellermeierMvan StratenMVollmarSV. 2009. Application- and patient size-dependent optimization of X-ray spectra for CT. Med Phys 36:993–1007, doi:10.1118/1.3075901
- KetchamRACarlsonWD. 2001. Acquisition, optimization and interpretation of X-ray-computed tomographic imagery: applications to the geosciences. Comput Geosci 27:381–400, doi:10.1016/S0098-3004(00)00116-3
- KoHGParkHGParkSHChoiCWKimSHParkWM. 2005. Comparative study of mycelial growth and basidiomata formation in seven different species of the edible mushroom genus Hericium. Bioresour Technol 96:1439–44, doi:10.1016/j.biortech.2004.12.009
- LeckerDNKumariSKhanA. 1997. Iodine binding capacity and iodine binding energy of glycogen. J Polymer Sci Part A: polymer chem 35:1409–1412, doi:10.1002/(SICI)1099-0518(199706)35:8,1409::AID-POLA9.3.0.CO;2-U
- LongairMHBakerDAArmstrongJD. 2011. Simple neurite tracer: open source software for reconstruction, visualization and analysis of neuronal processes. Bioinformatics 27:2453–2454, doi:10.1093/bioinformatics/btr390
- LuLLiJCangY. 2002. PCR-based sensitive detection of medicinal fungi Hericium species from ribosomal internal transcribed spacer (ITS) sequences. Biol Pharm Bull 25:975–980, doi:10.1248/bpb.25.975
- MaretDPetersOADedouitFTelmonNSixouM. 2011.Cone-beam computed tomography: a useful tool for dental age estimation? Med Hypotheses 76:700–702, doi:10.1016/j.mehy.2011.01.039
- MilosevicNTRistanovicD. 2007. The Sholl analysis of neuronal cell images: semi-log or log-log method? J Theor Biol 245:130–140, doi:10.1016/j.jtbi.2006.09.022
- MooreD. 1995. Tissue Formation. In: GowNRGaddG, eds. The growing fungus. Springer Netherlands. p 423–465.
- MooreD. 1998. Fungal morphogenesis. New York: Cambridge Univ. Press. 469 p.
- MoriKInatomiSOuchiKAzumiYTuchidaT. 2009. Improving effects of the mushroom Yamabushitake (Hericium erinaceus) on mild cognitive impairment: a double-blind placebo-controlled clinical trial. Phytother Res 23:367–372, doi:10.1002/ptr.2634
- NealeEABowersLMSmithTGJr 1993. Early dendrite development in spinal cord cell cultures: a quantitative study. J Neurosci Res 34:54–66, doi:10.1002/jnr.490340107
- PalluaJDRecheisWPöderRPfallerKPezzeiCHahnHHuck-PezzeiVBittnerLKSchaeferGSteinerEAndreGHutwimmerSFelberSPalluaAKPalluaAFBonnGKHuckCW. 2012. Morphological and tissue characterization of the medicinal fungus Hericium coralloides by a structural and molecular imaging platform. Analyst 137:1584–1595, doi:10.1039/c1an15615b
- PalluaJDUnterbergerSHMetzlerGPfallerKPalluaAKLacknerRPalluaAFRecheisWPöderR. 2014. Application of 3-D surface reconstruction by mid- and near-infrared microscopic imaging for anatomical studies on Hericium coralloides basidiomata. Analytical Methods 6:1149–1157, doi:10.1039/c3ay42082e
- PöderR. 1983. Über Optimierungsstrategien des Basidio-mycetenhymenophors: Morphologischphylogenetische Aspekete. Sydowia Ann Mycologici Ser II 36:240–251.
- PöderR. 1984. Basidium: spore correlations in selected genera of Tricholomataceae. Form – function – phylogenetic aspects. In: BorghiE, ed. La famiglia delle Tricholomataceae. Atti Convegno Int 1984. La colornese s.n.c. Parma, Italy: Colorno. p 161–174.
- PöderR. 1992. Phylogenetical aspects of gill development and proportions in basidiocarps. Mycol. Helvet 5:39–46.
- PöderRKirchmairM. 1995. Gills and pores: the impact of geometrical constraints on form, size and number of basidia. Doc Micol 25:337–348.
- PöderRSteinerEKirchmairM. 2003. On the development of Boletus edulis basidiomata: a reconstruction. XIV Congr Eur Mycol, Katsiveli (Yalta), Crimea, Ukraine. p 84–85. (Abstract)
- ReijndersAFM. 1963. Les problèmes du développement des carpophores des Agaricales et de quelques groupes voisins. Den Haag, the Netherlands: Junk. 412 p.
- RistanovicDMilosevicNTStulicV. 2006. Application of modified Sholl analysis to neuronal dendritic arborization of the cat spinal cord. J Neurosci Methods 158: 212–218, doi:10.1016/j.jneumeth.2006.05.030
- SchnablJGlueckertRFeuchtnerGRecheisWPotrusilTKuhnVWolf-MageleARiechelmannHSprinzlGM. 2012. Sheep as a large animal model for middle and inner ear implantable hearing devices: a feasibility study in cadavers. Otol Neurotol 33:481–489, doi:10.1097/MAO.0b013e318248ee3a
- Schulz-MirbachTHessMMetscherBDLadichF. 2013. A unique swim bladder-inner ear connection in a teleost fish revealed by a combined high-resolution micro-tomographic and three-dimensional histological study. BMC Biol 11:75, doi:10.1186/1741-7007-11-75
- Schulz-MirbachTMetscherBLadichF. 2012. Relationship between swim bladder morphology and hearing abilities: a case study on Asian and African cichlids. PLoS One 7: e42292, doi:10.1371/journal.pone.0042292
- ShollDA. 1953. Dendritic organization in the neurons of the visual and motor cortices of the cat. J Anat 87:387–406.
- SteinerE. 2003. Rekonstruktion der Fruchtkörperentwick-lung von Boletus edulis Bull.: Fr. (diploma thesis). Innsbruck, Austria: Leopold-Franzens-Univ. Press. 113 p.
- SteppeKCnuddeVGirardCLemeurRCnuddeJPJacobsP. 2004. Use of X-ray computed microtomography for non-invasive determination of wood anatomical characteristics. J Struct Biol 148:11–21, doi:10.1016/j.jsb.2004.05.001
- StockSRNagarajaSBarssJDahlTVeisA. 2003. X-ray microCT study of pyramids of the sea urchin Lytechinus variegatus. J Struct Biol 141:9–21, doi:10.1016/S1047-8477(02)00554-3
- StögmannBMarthAPernfuβBPöderR. 2013. The architecture of Norway spruce ectomycorrhizae: three-dimensional models of cortical cells, fungal biomass and interface for potential nutrient exchange. Mycorrhiza 23:431–445, doi:10.1007/s00572-013-0485-z
- SuttonMD. 2008. Tomographic techniques for the study of exceptionally preserved fossils. Proc Biol Sci 275:1587–1593, doi:10.1098/rspb.2008.0263
- TondiGBlacherSLéonardAPizziAFierroVLebanJCelzardA. 2009. X-ray microtomography studies of tannin-derived organic and carbon foams. Microsc Microanal 15:384, doi:10.1017/S1431927609990444
- TorranceJElliotTMartinRHeckR. 2008. X-ray-computed tomography of frozen soil. Cold Reg Sci Technol 53:75–82, doi:10.1016/j.coldregions.2007.04.010
- WangY. 2013. Morphological characterization of wood-plastic composite (WPC) with advanced imaging tools: developing methodologies for reliable phase and internal damage characterization [doctoral dissertation]. Oregon State Univ. Press.
- WangZLuoDLiangZ. 2004. Structure of polysaccharides from the fruiting body of Hericium erinaceus Pers. Carbohydr Polymers 57:241–247, doi:10.1016/j.carbpol.2004.04.018
- WebsterJDaveyRASmirnoffNFrickeWHindePTomosDTurnerJCR. 1995. Mannitol and hexoses are components of Buller’s drop. Mycol Res 99:833–838, doi:10.1016/S0953-7562(09)80737-5
- WildenschildDVazCRiversMRikardDChristensenB. 2002. Using X-ray computed tomography in hydrology: systems, resolutions and limitations. J Hydrol 267:285–297, doi:10.1016/S0022-1694(02)00157-9
- YuXHoutmanCAtallaRH. 1996. The complex of amylose and iodine. Carbohydr Res 292:129–141, doi:10.1016/S0008-6215(96)91037-X
- YushkevichPAPivenJHazlettHCSmithRGHoSGeeJCGerigG. 2006. User-guided 3D active contour segmentation of anatomical structures: significantly improved efficiency and reliability. Neuroimage 31: 1116–1128, doi:10.1016/j.neuroimage.2006.01.015