Abstract
The current world trotter record is 68.0 s/km, close to the estimates of the record limit reported in literature: 68.2 s/km for males and 69.1 s/km for females in Swedish trotters. The estimated limit has been improved on and the record limit was, therefore, investigated in the Italian trotter using the same methodology applied to the Swedish trotter. The best racing times of 30,587 Italian trotters (3–5 years old) recorded between January 1st 1992 and October 31st 2009 have been log transformed to check for trends and asymptotic limit. A positive trend was detected and limits of 61.8 s/km and 62.8 s/km have been estimated for males and females, respectively. The Generalized Extreme Value theory, applied to the 3-year old winners of the Italian Trot Derby, estimates a limit of 64.7 s/km. These results indicate that the limit for racing speed is still far from actual values.
Introduction
The breeding evaluation of trotters can be based on three different measures of performance: earnings, rank traits, and time traits. Genetic correlations between these measures are favorable and racing time, a measure of the ability to trot fast, seems to be more suited for selection because of its higher heritability (CitationThiruvenkadan et al., 2009). Speed is the result of a complex interaction of anatomical, physiological and environmental factors, such as body size, limb morphology, level of training, the distance over which the speed is measured or the ground conditions. In thoroughbred racing, analysis of historical stakes revealed that the genetic plateau for speed has already been reached (CitationGaffney and Cunningham, 1988). For the Swedish trotter, it has been estimated that the genetic plateau will be reached around the middle of this century, with a record of 68.2 s/km (CitationÁrnason, 2001), but this limit seems to be very close to the present racing times. In fact, the current world record for harness racing is 68.0 s/km recorded for Enough Talk in 2008 (http://www.harnesslink.com).
The aim of this study was to verify whether the tendency to reach a genetic plateau is also present in Italian trotters. In order to get comparable results, the same methodology used in the analysis of the Swedish trotter population was applied (CitationÁrnason, 2001). Also, the maximum speed registered in the 83 editions of the Italian Trot Derby was analyzed according to the Generalized Extreme Value (GEV) theory in order to compare these speeds with the distribution limit.
Materials and methods
The dataset used for the analysis of racing speed in the Italian trotter population ranged from January 1st 1992 to 31st October 2009. There were 2,526,126 results available on 161,363 horses, recorded from 253,052 races in 30,438 competition days from all 27 Italian racetracks. Data were filtered according to the same criteria applied to Swedish trotters so that 36,185 Italian trotters born in the period 1989–2004 who completed a minimum of five races between three and five years of age with a valid record were chosen. In addition, a value of 2 s/km was added to auto-start (e.g. flying start) records in order to neutralize the difference with volt-start records and to get estimates comparable to those in the literature (CitationÁrnason, 2001). The records included 13,967 (38.6%) from entire male horses, 5,598 (15.5%) from geldings and 16,620 (45.9%) from mares. However, the distribution of geldings in the records was very hyperkurtotic in comparison to entire males, so that only 30,587 records from males and females were analyzed. All data were processed using the R software (CitationR Development Core Team, 2007).
Distribution of the average racing time records was found to be asymmetric within the population. Previous studies showed that scaled log transformation of racing time resulted in a closer fit to the normal distribution compared with the untransformed records (CitationÁrnason et al., 1982). Therefore, to improve the approximation to the normal distribution, the Italian trotters racing time records were logarithmically transformed as
where ki is the best average racing time (s/km) of the ith horse and x is an arbitrary value, empirically searched for in the range between 50 s/km and 70 s/km, so that the transformation would provide the best approximation to the normal distribution. Goodness of fit was assessed separately for each sex using the values of the skewness and kurtosis coefficients. The distribution of transformed records was compared, separately for each sex, with the univariate normal distribution using the Kolmogorov-Smirnov statistical method carried out with the boot-strap method. Since ki can be expressed as eyi + x, the parameter ki becomes the asymptotic limit for best racing time.
In order to determine the time trend of average, minimum and maximum values for the best racing time in both sexes, the following function was fitted:
where x is the asymptotic limit as defined above, p is a positive constant and t is an arbitrary time unit. The optimal values of p and t (expressed as the distance of the birth year from an arbitrary value z) were empirically chosen by minimizing the prediction error for p values in the range 0.001÷0.040 and t values in the range 1800÷1900.
The trotter Derby is the most important traditional stake in Italy and the best 3-year old trotters qualify for the race each year. In order to check if the genetic plateau for speed has already been reached, a dataset was prepared which included winners’ time and type of start recorded in all 83 editions of the Derby. This dataset was analyzed according to a Generalized Extreme Value distribution.
The statistics of extremes (CitationFisher and Tippett, 1928; CitationGumbel, 1958; CitationJenkinson, 1959; CitationSmith, 1986; CitationGaines and Denny, 1993; CitationColes, 2001; CitationBeirlant et al., 2005) asserts that the distribution of extreme values should asymptotically conform to a Generalized Extreme Value (GEV) distribution:
where P(V) is the probability that an annual maximum speed chosen at random is ≤V. The shape of this cumulative probability curve is defined by three parameters: ξ, a shape parameter; µ, a location parameter that can take any value; and σ, a positive scale parameter.
If ξ is ≥ 0, the shape of the distribution of extreme values is such that there is no defined limit to the extremes that can potentially be reached. On the contrary, if ξ < 0, P=1 when
: therefore, in this case, the distribution of extreme values has a defined absolute maximal value. This ability to define and quantify absolute maxima makes the statistics of extremes a very promising approach for the study of maximum running speeds (CitationDenny, 2008; CitationEinmahl and Magnus, 2008; CitationEinmahl and Smeets Sander, 2011).
All extreme value analyses were carried out using extRemes software (E. Gilleland and R. W. Katz, NCAR Research Applications Laboratory, Boulder, CO, USA), an implementation in the R language of Coles’ ismev package. The confidence limits for ξ, µ and σ were determined using the profile likelihood method (CitationColes, 2001; CitationAlbin, 2004; CitationDe Haan and Ferreira, 2006).
Results and discussion
In the Swedish trotter dataset, only 8% of the best racing times were obtained from autostart races (CitationÁrnason, 2001). In contrast, in the Italian trotter dataset more than 99% of the best racing times were from this kind of start. This difference is not only due to the different traditions in Sweden and Italy, but also to the evolution of harness racing. In fact, it must be considered that currently there are very few exceptions to the start behind the wings of a car. The dataset, adjusted for the starting method, has been divided into two subsets relating to males and females. Descriptive statistics summarized within sex and birth-year are shown in . The distribution of the racing times presented values of the mean and standard deviation are, respectively, 79.46 s/km and 2.25 s/km, and the indices of skewness and kurtosis are 0.48 and 0.79, respectively. Logarithmic transformation is able to better normalize the distribution. In fact, values of skewness and kurtosis of the natural logarithm fall to 0.37 and 0.57. Also, the Kolmogorov-Smirnov test showed an improvement in the approximation to normal distribution after the logarithmic transformation. In fact, the D value falls from 0.039 to 0.033.
Table 1 Descriptive statistics of best racing time (s/km, adjusted for the starting method) for the Italian Standard bred trotters by sex and birth-year.
There is a significant annual improvement in performance in both sexes. With a linear regression, there is a slope of −0.168 s/km (R2= 0.988) for males and −0.148 s/km (R2=0.977) for females. These yearly improvements are comparable with those of the Swedish trotters (−0.157 s/km with R2=0.974 for males and −0.170 s/km with R2=0.961 for females), but it must be noted that in 1994, the last birth-year available in the Swedish trotters’ study, Italian trotters show slower racing times. However these improvements do not seem to be accompanied by a reduction in variability and this is in contrast to what has been observed in Swedish trotters (CitationÁrnason, 2001).
The trends of the empirical searches of the minimum values of skewness and kurtosis of (ki-x) are reported in for males and in for females. The plots of these values (data not shown) follow a regular shape. The asymmetry coefficient reaches its minimum, in module, for males when x equals 61.8 s/km with 0.00183 and for females when x equals 62.8 s/km with 0.00120. The coefficient of kurtosis is always positive, reaching a minimum of 0.08601 when x equals 61.3 s/km for males and of 0.28823 when x equals 62.9 s/km for females. Also the empirical search for minimum values of Kolmogorov-Smirnov D gives similar results. For males, minimum value was found at x=60.8 s/km (D=0.015), and for females at x=62.0 s/km (D=0.018). The shape of the plot of D values is less regular than for skewness and kurtosis. This was expected because of the greater power of the D statistic and also because of the bootstrap methodology.
Table 2 Results of the empirical search for scaling factors, x, which result in normal distribution of yi=ln(ki-x) according to skewness and kurtosis criteria in males.
Table 3 Results of the empirical search for scaling factors, x, which result in normal distribution of yi=ln(ki-x) according to skewness and kurtosis criteria in females.
The results of the empirical searches for the scaling factor with different normality indexes show that the range of the optimum x within each sex is about 1 s/km, depending on the preferred index. Also, the difference between males and females is about 1 s/km. These values agree well with Swedish trotter results, and the asymmetry index was chosen in order to get further comparable results. Therefore, the asymptotic limit of racing time was fixed to 61.8 s/km for males and to 62.8 s/km for females; that is considerably lower than the estimates for Swedish trotters (CitationÁrnason, 2001).
The search for optimal values of p and t to estimate the time trend of average, minimum and maximum values has provided the following equations:
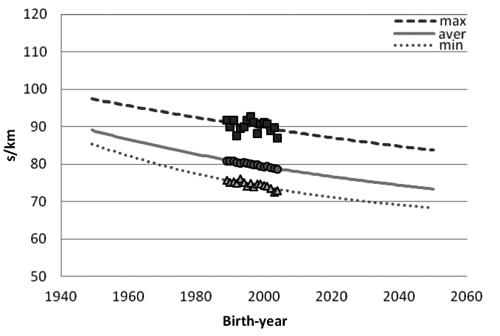
Trends for males are shown in and for females in . In both sexes, there was very good adaptation to the mean values and also but to a lesser extent to the minimum. The maximum values showed evident fluctuations. The asymptotic limit of the Swedish trotter has been estimated at 68.2 s/km. In an auto-start race, this record will be met in 2038 by Swedish trotter males and in 2037 by Italian trotter males, according to the trend equation of each breed. For the average, the same record should be reached in 2095 by Swedish trotter males, but already in 2069 by Italian trotter males. The asymptotic limit 61.8 s/km estimated for the Italian trotter will be reached in an auto-start race at the end of the following century (year 2194).
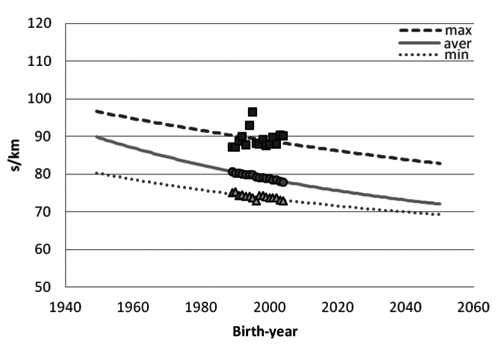
Despite the rapid progress of the Italian trotter, if the plateau is defined as the year when the minimum and the average best racing times for males will have a difference lower than the measured unit (which is 0.1 s/km), the plateau will be reached by the two trotter populations in a comparable time. In fact, the estimated years are 2272 for the Italian breed and 2285 for the Swedish breed. The current race records in Italy are still far from these estimated limits.
A completely different methodology, such as GEV, applied to a different dataset can support the previous findings. Therefore, using the theory of extreme values, we investigated from which distribution came the racing speeds of the winners of the 83 editions of the Italian Trotting Derby. For this dataset, the correction of the racing times was based on the difference between the average of the last five editions started with the volt-start (1949–1951) and the first 5 editions started with the autostart (1951–1956), so that for the races started with the volt-start method the racing times have been reduced by 4 s/km.
The times recorded by the winner, corrected for the starting method, constitute the set:
where V is the maximum value measured for each edition winner, expressed as speed (m/s).
The analysis provided the following estimates: for the parameters µ, 12.40896 m/s with a standard error of 0.06438 m/s; for σ, 0.48116 m/s with a standard error of 0.04948 m/s; for ξ, 0.15881 m/s with a standard error of 0.12823 m/s. Since the maximum likelihood method provides a confidence interval for the shape parameter ξ between −0.30428 and −0.01334, that is greater than −0.5, the maximum likelihood method can be considered appropriate and used to test the confidence intervals. In fact, when ξ>−0.5 the maximum likelihood estimators exist, they are regular and have their usual properties, while for 1<ξ<0.5 the estimators exist but are not regular and for ξ<−1 the estimators do not exist. (CitationSmith, 1986; CitationLindgren and Rootzen, 1987; CitationColes and Tawn, 1994; CitationColes, 2001).
Since it is assured that the maximum likelihood method can be used and that the distribution is upper limited, the upper point of the distribution is defined as:
The speed of 15.43874 m/s is equal to a racing time of 64.8 s/km. Although the horse performance in the Derby refers to both male and female animals who are still only three years old and have certainly not yet expressed their full potential, there is a difference of 8.2 s/km between this limit and the actual Derby record (73 s/km in 2005 and in 2006). This difference appears to be similar to the 9.4 s/km estimated in the other dataset between the best actual record (72.4 s/km for a female in 2003) and the asymptotic limit for the same sex (62.8 s/km).
Conclusions
Logarithmic transformation is appropriate to normalize the distribution of best racing times of the Italian trotters. The observed trend shows a good improvement in this trait. The calculation of its asymptotic limit, the prevision of its trend and also the application of the extreme value analysis to the Italian Trotting Derby winner’s speed suggest that Italian trotters are still quite far from reaching their limits and that more than a century will pass before the performance of the horses reaches its plateau.
Acknowledgments:
the authors wish to thank the National Association for Horse Breeds Enhancement (UNIRE), for providing the official results of trotter races in Italy.
References
- AlbinJ.M.P. 2004 Extremes value theory Encyclopedia of Actuarial Science John Wiley & Sons New York, NY, USA
- ÁrnasonTh. 2001 Trends and asymptotic limits for racing speed in standardbred trotters Livest. Prod. Sci 72 135 145
- ÁrnasonTh. DareniusA. PhilipssonJ. 1982 Genetic selection indices for Swedish trotter broodmares Livest. Prod. Sci 8 557 565
- BeirlantJ. DierckxG. GuillouA. 2005 Estimation of the extreme-value index and regression on generalized quantile plots Bernoulli 11 949 970
- ColesS.G. 2001 An introduction to Statistical Modelling of extreme Values Springer New York, NY, USA
- ColesS.G. TawnJ.A. 1994 Statistical methods for multivariate extreme: an application to structural design (with discussion) Appl. Stat 43 1 48
- De HaanL. FerreiraA. 2006 Extreme Value Theory: an Introduction Springer New York, NY, USA
- DennyM.W. 2008 Limits to running speed in dogs, horses and humans J. Exp. Biol 211 3836 3849
- EinmahlJ.H.J. MagnusJ. 2008 Records in athletics through extreme-value theory J. Am. Stat. Assoc 103 1382 1391
- EinmahlJ.H.J. Smeets SanderG.W.R. 2011 Ultimate 100m world records trough extreme value theory Stat. Neerl 65 32 42
- FisherR.A. TippettL. H. C. 1928 Limiting forms of the frequency distribution of the largest or smallest member of a sample PCPS-P. Camb. Philol. S 24 80 190
- GaffneyB. CunninghamE.P. 1988 Estimation of genetic trend in racing performance of thoroughbred horses Nature 332 722 724
- GainesS. DennyM.W. 1993 The largest, smallest, highest, lowest, longest and shortest: extremes in ecology Ecology 74 1677 1692
- GumbelE.J. 1958 Statistics of Extremes Columbia University Press New York, NY, USA
- JenkinsonA.F. 1959 The frequency distribution of the annual maximum (or minimum) values of meteorological elements Q. J. Roy. Meteor. Soc 81 158 171
- LindgrenG. RootzenH. 1987 Extreme values: Theory and technical applications Scandinavian Journal of Statistics, Theory and Applications 14 241 279
- R Development Core Team 2007 R: A language and environment for statistical computing R Foundation for Statistical Computing, Wien, Austria Available from: http://www.R-project.org
- SmithR.L. 1986 Extreme value theory based on the r largest annual events J. Hydrology 86 27 43
- ThiruvenkadanA.K. KandasamyaN. PanneerselvamaS. 2009 Inheritance of racing performance of trotter horses: An overview Livest. Prod. Sci 124 163 181