Abstract
Beef producers prefer to feed concentrates on an ad libitum basis to increase the flexibility of their work. Including salt, which is a self-limiting supplement, could control or reduce concentrate intake without increasing the workforce. The aim of the study was to evaluate the effect of including 10%NaCl in the concentrate on intake, growth, blood ions (sodium, potassium and chlorine), renal function (through creatinine and urea concentrations in blood), and daytime behaviour of bulls over 6 weeks. Bulls consuming the control concentrate (Control bulls) had greater weight gain (P<0.05) and concentrate intake (P<0.001) than those consuming the concentrate with 10%NaCl (10%NaCl bulls). Lower plasma sodium concentration was found in Control bulls after 6 weeks (P<0.05), while potassium concentration was lower after 4 (P<0.05) and 6 weeks (P<0.01). Blood urea did not differ between the groups, and creatinine only differed at week 4 (P<0.01). Control bulls spent less time eating hay (P<0.001) and more time idling (P<0.01) during daylight hours. In conclusion, the inclusion of 10%NaCl in the concentrate for short periods could be used to reduce concentrate intake without major effects on renal function; however, a concomitant decrease in weight gain should be expected.
Introduction
In Mediterranean countries, young bulls are fed concentrates and cereal straw on an ad libitum basis, which results in a concentrate-to-forage ratio of approximately 90:10. The high concentrate prices of the recent years compromise the viability of feedlot producers. Concentrates could be delivered daily to control concentrate intake. But this practise may increase labour requirements, which can conflict with demands for greater work productivity and the flexibility to take holidays or time off to spend on private activities (Hostiou and Dedieu, Citation2012). Therefore, management procedures that reduce labour requirements are important.
The use of salts to regulate concentrate intake in grazing ruminants was a common practice in the USA (Meyer et al., Citation1955; Morris and Wilton, Citation1976). Common salt is a potential dietary supplement to reduce concentrate intake. Salt is the cheapest, most palatable and readily available of all mineral supplements (Underwood and Suttle, Citation1999). The amount of salt that stimulates or restricts feed intake may vary, depending on feeding conditions and the amount of environmental stress to which cattle are exposed. Growing cattle that received concentrates [net energy available for growth: 6.0 MJ/kg dry matter (DM)] and were exposed to hot conditions had a lower DM intake when 1% salt was included in the diet, while intake was not affected under thermo-neutral conditions in one experiment (Gaughan and Mader, Citation2009). Sodium has been included in low quantities as sodium chloride (NaCl; below 3%), especially in highly concentrate diets, because it increased intake and rate of gain (Kellaway et al., Citation1977; Kilmer et al., Citation1980) or as sodium bicarbonate to buffer ruminal pH (Hart and Polan, Citation1984). However, at higher doses, sodium salts depressed DM intake in lactating cows (525 g sodium bicarbonate/d; Roche et al., Citation2003) and growing cattle (3.3% sodium bicarbonate; Jackson et al., Citation1992).
Blood acid-base status should be checked when salts are provided at high levels because dietary excesses of sodium and chlorine can disturb body functions (Underwood and Suttle, Citation1999). Sodium, chlorine and potassium all function in the maintenance of the osmotic pressure and regulate the acid-base equilibrium (McDowell, Citation2003). The regulation of sodium status when there are fluctuations in sodium intake is achieved mainly by controlling reabsorption in the kidney, whereas chlorine is also passively reabsorbed in the kidney (Underwood and Suttle, Citation1999). To evaluate renal function, serum concentrations of creatinine and urea, which are crude estimates of the glomerular filtration rate and progressive deterioration of renal function, were measured (Finco, Citation1997).
The aim of this study was to evaluate the effect of adding 10%NaCl to the concentrate on the animals’ intake, growth, blood electrolytes, renal function and behaviour in Parda de Montaña young bulls fed concentrates and lucerne hay on an ad libitum basis.
Materials and methods
Animals and management
Twenty-two Parda de Montaña bulls [290±20.2 kg live weight (LW); 204±11.7 days old] were received in the feedlot facility of the Agrifood Research and Technology Centre of Aragon (CITA) Station (41°43’N, 0°48’W; 225 m asl), which is located in the Ebro Valley (Spain), an area with a continental Mediterranean climate. Parda de Montaña is a local cattle breed widely spread throughout northern Spain with a population of 25,000 to 30,000 animals. This breed derives from the ancient Brown Swiss and has been selected for beef production.
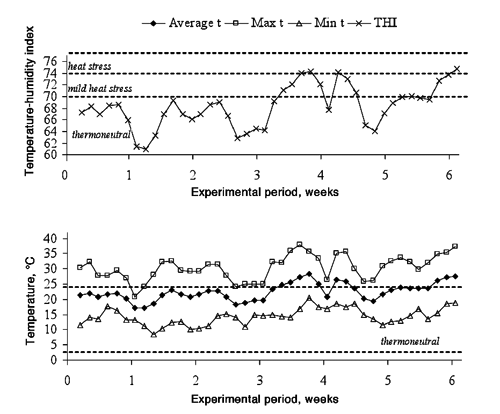
Upon arrival, the bulls were vaccinated against Clostridium sp. (Miloxan; Merial, Duluth, Georgia, USA) and bluetongue virus serotypes (Zulvac 1+8 Bovis; Fort Dodge, Overland Park, KS, USA). The adaptation period lasted 15 days, and the experimental period 41 days (21 May to 1 July). The temperature outside the feedlot facility was measured in a meteorological station during the experimental period. The temperature and humidity were recorded every 5 min. Temperature-humidity index (THI) was calculated from average temperature and humidity as:
THI=0.8×Tm–(RH)×(Tm-14.4)+46.4
where Tm is daily mean temperature and RH is relative humidity (percentage).
The bulls were blocked by weight and randomly assigned to two feeding treatments. One group (Control) received a control concentrate, and the second group (10%NaCl) received a concentrate with 10% sodium chloride (). Both groups received lucerne hay and water on an ad libitum basis. Each group was placed in a 6x13 m2 pen with a concrete floor, and straw was used as bedding material. Each pen had a trough and an automatic feeder station (ALPRO®; Alfa Laval Agri, Lund, Sweden), where hay and concentrates, respectively, were delivered. The automatic feeder station delivered a fixed amount of concentrate each visit (250 g/visit). Each pen was also equipped with three water drinking bowls with a nose paddle. The bulls had free access to tap water (pH=7.45, electric conductivity=2030 S/cm, sodium concentration=6 mmol/L; chlorine concentration=9.3 mmol/L).
During the first week of the adaptation period, the bulls received hay in the troughs on an ad libitum basis and concentrates in gradually increasing amounts to become adapted to the feed. The following week, the young bulls were trained to use the automatic feeding stations. Bulls had ad libitum access to concentrates in the feeding stations
Measurements and analyses
The bulls were weighed every 7 days at 9.00 h. Individual LWs were used to calculate the average daily gain (ADG) by regression of weight on date. Concentrate intake was recorded individually on a daily basis by the automatic feeder station. The offer and refusal of lucerne hay was registered daily on a group basis to estimate the lucerne hay intake. The hay and concentrate intake were used to calculate the forage-to-concentrate ratio. Water intake was measured daily on a group basis with a water flow meter installed at the entrance of the water pipe of each pen. The daily concentrate intake was used to calculate the intake throughout the experimental period and the intake at weekly intervals.
Weekly samples of feedstuffs were collected and pooled at fortnight intervals to determine their chemical composition. Samples were dried at 60°C until constant weight and millground (1 mm screen). Dry matter, ash, ether extract and crude protein (CP) (Nx6.25) contents were determined according to AOAC methods (AOAC, Citation1999). Neutral (NDF) and acid detergent fibre (ADF) were analysed following the sequential procedure of Van Soest et al. (Citation1991) with the Ankom200/220 fibre analyser (Ankom, Macedon, NY, USA).
Neutral detergent fibre from the dry mixed ration and concentrates was assayed with a heat stable amylase (aNDF). Lignin was analysed on ADF residues by solubilisation of cellulose with sulphuric acid. The neutral and acid detergent insoluble proteins were determined by N analysis of NDF and ADF residues, respectively. All values were corrected for ash-free content (om). Nitrogen and protein (Nx6.25) content was determined following the Dumas Procedure (AOAC, Citation1999) using a nitrogen and protein analyser (Model NA 2100; Thermoquest CE Instruments, San Jose, CA, USA).
The humidity of the bedding material was evaluated to estimate indirectly urine excretion. At 8.00 h of the first day of week 2 the bedding material was replaced. Afterwards, daily samples of the bedding material (around 1 kg fresh matter) were taken at 12 h from different places in both pens. The samples were dried for 5 days at 65°C. Humidity was calculated as the weight difference before and after drying.
Blood samples were collected by tail vessel puncture into 10 mL lithium-heparinised tubes at 9.00 h every 14 days. After collection, the blood samples were centrifuged at 2500xg for 15 min at 4°C, and the plasma was extracted and frozen in aliquots at -20°C for subsequent assay. Plasma sodium and potassium were evaluated using a flame photometer (ION–3 SP; RAL, Barcelona, Spain). Plasma chlorine (mercury thiocyanate method), urea (kinetic UV test) and creatinine concentrations (Jaffe and Enzymatic method) were determined using an automatic analyser (GernonStar; RAL). Blood urea to creatinine ratio was calculated. Reagents and reference serum samples were provided by the analyser manufacturer (RAL). The mean intra- and inter-assay coefficients of variation were <3.2 and <2.2%, respectively. Behaviour recordings were performed on 12 bulls, 6 per treatment, the 18th and 21st day of the experimental period. The animals were individually observed through scan sampling (Lehner, Citation1996) by a single technician at 10-min intervals between dawn and dusk (06.30 to 21.30 h). According to protocol, the animal position (standing/lying) and the following activities were recorded: i) feeding concentrate, ii) feeding hay, iii) ruminating, iv) idling and v) other activities, including less frequent behaviours such as drinking water, licking own body, licking other bulls or licking fences, fighting and mounting among individuals.
Statistical analyses
Statistical analyses were performed using SAS v. 9.1. (SAS, Citation2004). Before further analyses, the normality of the residues of all the variables was tested using the Shapiro-Wilk test. Live weight, daily concentrate intake, plasma urea, creatinine, urea to creatinine ratio, sodium, potassium and chlorine concentrations, and all the behaviour variables except the other activities were analysed using mixed models based on Kenward-Roger’s adjusted degrees of freedom solution for repeated measures, including the feeding treatment, week/day and their interaction as fixed effects, and the animal as the random effect. A firstorder autoregressive structure with heterogeneous variances for each date was used to model heterogeneous residual error. In the case of the behaviour other activities, the normal distribution of the residues could not be verified, and the means were compared using the Kruskal-Wallis nonparametric test of the NPAR1WAY procedure of SAS. The differences in weight gains were analysed by ANOVA using the GLM procedure with feeding strategy as the fixed effect. The humidity of the bedding was analysed using the GLM procedure with feeding treatment, day from bedding change and their interaction as fixed effects. The number of times the bulls drank was analysed using the GLM procedure with feeding treatment, day and their interaction as fixed effects because it is considered as an event. Least square (LS) means were estimated, and the differences between LS Means were tested using a t-test. Pearson’s correlation coefficients between variables were calculated. The diurnal pattern of concentrate, hay and water intake was analysed using the Proc Freq of SAS. For all tests, the level of significance was set at P<0.05. Trends were discussed when P<0.10. Forage intake, total DM intake and water intake could not be statistically tested because they were registered on a pen basis.
Results and discussion
Intake and performance
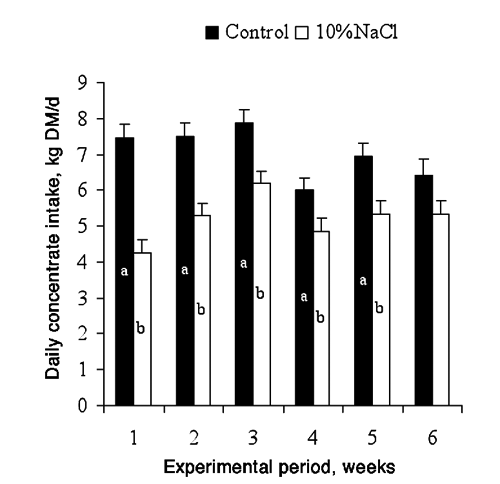
The addition of 10%NaCl in the concentrate reduced concentrate intake by 26% (P<0.001; ) while increasing hay intake by 143% (3.4±0.11 and 1.4±0.06 kg DM/d for 10%NaCl and Control bulls, respectively; ). Consequently, the forage contribution to the diet increased from 17 to 40%. The total DM intake was similar in both feeding strategies (8.6±0.15 and 8.4±0.19 kg DM/d for 10%NaCl and Control bulls, respectively), as Meyer et al. (Citation1955) reported. However, the diet in the abovementioned, composed mainly of lucerne hay (35%) and barley (35%), was offered in pellets, and the steers were not able to modify their feeding behaviour decreasing concentrate intake and increasing forage intake, as in the current experiment.
Assuming that cattle may eat up to 0.8 kg of NaCl (10.7% of NaCl in the diet, 1.8 g DM/kg LW) without suppressing the digestibility of cellulose or gross energy (Cardon, Citation1953), the 10%NaCl concentrate diet did not limit the digestive efficiency of the bulls (average NaCl intake: 1.5 g/kg LW).
Concentrate intake evolved differently in Control and 10%NaCl bulls (P<0.001). The concentrate intake of the Control bulls remained constant and greater than the 10%NaCl bulls, which although lower than Controls increased during the first three weeks (). The 4th week, the concentrate intake decreased in both groups. The decrease in the concentrate intake during the 4th week is possibly related to heat stress because the average ambient temperature was higher than 25°C and the maximum temperature higher than 30°C or THI higher than 70 (Davis et al., Citation2003) (). Dry matter intake declines in response to elevated temperatures (National Research Council, Citation1996). Gaughan and Mader (Citation2009) suggested that the reduction in intake with heat stress may be an attempt by the animals to regulate body temperature by reducing metabolic heat load. The fifth and sixth weeks, the concentrate intake returned to the values recorded during the first weeks for both groups. The Control bulls had a greater concentrate intake than the 10%NaCl bulls throughout the experiment (P<0.001), but the differences in concentrate intake between both groups decreased over time such that at the beginning of the experiment the Control bulls were eating 43% more concentrate than the 10%NaCl bulls however by the 6th week the difference in intake between the two groups had decreased such that the Control bulls were only consuming 17% more concentrate than the 10%NaCl bulls. The increase in concentrate intake of 10%NaCl bulls can be explained because sodium appetite can be easily affected by experience (Underwood and Suttle, Citation1999), and finishing cattle may adapt to high dietary NaCl concentrations (Schauer et al., Citation2004).
The Control and 10%NaCl bulls had similar initial (P=0.24) and final weights (P=0.14; ). However, the addition of 10%NaCl decreased weight gains by 10%. Including NaCl in greater proportions (0.5 vs 6.5%) in the diet of 5- to 11-week-old calves resulted in reduced weight gains (Leibholz et al., Citation1980). Conversely, including 10%NaCl in the diet had no effect on weight gains in heavier steers (370 kg LW) (Meyer et al., Citation1955). In the current study, the differences in growth could also be triggered by the different energy and protein content between the concentrates. The inclusion of 10%NaCl in the concentrate reduced the energy, CP and fibre content in the experimental concentrate because salt was included in the concentrate at the expense of feedstuffs such as corn gluten feed.
The addition of 10%NaCl in the concentrate increased water intake by 46% (73 vs 50 L/d for 10%NaCl and Control bulls, respectively; ) as in growing steers with an inclusion of 10%NaCl in the diet (Meyer et al., Citation1955). Water intake is related to the average and maximum ambient temperature, DM intake, roughage proportion in the diet, DM content of the roughage, live weight and sodium intake (Meyer et al., Citation2006; Gaughan and Mader, Citation2009). Including 5% NaCl in a high concentrate diet increased water intake by 55%, whereas including the same percentage in a high roughage diet increased water intake by only 10% (Zorrilla-Rios et al., Citation1990).
The humidity of the bedding material increased sharply just after 1 day from the bedding change (). Control bulls had lower bedding humidity than 10%NaCl bulls throughout the control period probably mostly related to a lower urine excretion. The amount of urine produced daily varies with the activity of the animal, air temperature, and water consumption as well as certain other factors (National Research Council, Citation1996). In fact, during the week of this measurement, Control bulls had a water intake of 48 L/d while 10%NaCl bulls 67 L/d. In the same sense, water in faeces also has a contribution, which is greater in diets with high mineral content (National Research Council, Citation1996). A humidity of 75% was proposed as a maximum threshold by Ward et al. (Citation2002) because several bacteria can survive and multiply. In the current experiment, the bedding of Control bulls did not reach that value but that of 10%NaCl bulls surpassed that value after 2 days. Thus, in 10%NaCl bulls the quantity of bedding straw should have been higher or changed more frequently, or stocking rate should have been reduced.
Plasma mineral concentrations
The inclusion of 10%NaCl in the concentrate increased plasma sodium concentration at the 6th week (143 vs 167 mmol/L, for Control and 10%NaCl bulls respectively; P<0.05), the potassium concentration at the 4th (6.6 vs 7.6 mmol/L, respectively; P<0.05) and 6th weeks (4.7 vs 6.4 mmol/L, respectively; P<0.01) and the chlorine concentration at the beginning (92 vs 96 mmol/L, respectively; P<0.001) of the experiment and at the 2nd (93 vs 98 mmol/L, respectively; P<0.05) and 4th (93 vs 99 mmol/L, respectively; P<0.001) weeks (). Overall, the maximum plasma concentration of the three ions was reached after 4 weeks on the experimental diet, when the bulls could have been suffering from heat stress, and decreased afterwards.
Similar sodium, potassium and chlorine concentrations have been reported in 5- to 7- month-old bulls fed different diets of forage and concentrates (Álvarez-Rodríguez et al., Citation2011). The results in plasma ion concentrations are in agreement with Apper-Bossard et al. (Citation2009), who reported that sodium and potassium concentrations in the blood were not affected by increases of these ions in the diet, while chlorine concentration is indeed affected. In sheep, plasma concentrations of potassium and chloride increased in response to NaCl intake (Digby et al., Citation2011). Sodium and chlorine are rapidly absorbed from the intestinal tract into the bloodstream. The elements are then secreted by the kidneys through the urine. However, animals are able to eliminate excess NaCl when adequate clean water is available by increasing the NaCl-excreting capacity of the kidneys (Underwood and Suttle, Citation1999). The body’s sodium balance is closely related to the water balance (Finco, Citation1997).
Blood sodium and potassium are exchanged with protons, and chlorine with bicarbonates in several metabolic processes to ensure tissue electroneutrality (Constable, Citation1999). The sodium content in the extracellular fluid compartment is maintained by the reciprocal interaction of aldosterone and antidiuretic hormone (Morris, Citation1980). Moreover, aldosterone increases sodium renal reabsorption at the expense of an increase in potassium elimination (Finco, Citation1997; Verlander, Citation2003). When excess NaCl is consumed, plasma osmolality is increased, which produces a negative feedback on aldosterone, decreasing its concentrations to promote sodium excretion and increase water intake (Digby et al., Citation2011). When potassium is rapidly lost as a result of increased urinary output, blood sodium is increased, which is transferred from intracellular to extracellular fluids to maintain the proper cellular osmotic pressure (Verlander, Citation2003). However, the strong homeostatic control mechanisms for electrolytes operating through the respiratory and renal systems respond rapidly to counteract changes in the acid-base balance created by increased dietary sodium and chlorine (Verlander, Citation2003).
Salt intoxication is generally associated with increases in the plasma sodium concentration and elevation of the blood osmolality. However, salt poisoning does not occur as long as water is available (Morris, Citation1980; Carlson, Citation1997). Chlorine and potassium concentrations found in the 10%NaCl animals were below the levels of toxicity (Underwood and Suttle, Citation1999) and some of the concentrations of sodium, potassium and chlorine obtained in the last week (when the differences were observed) were even lower than those obtained in the Control animals in week 2 and 4.
Renal function
The plasma concentrations of urea and creatinine were similar in both groups (). The Control bulls had a greater plasma creatinine concentration than the 10%NaCl bulls only in the 4th week (0.13 vs 0.10 mmol/L for Control and 10%NaCl bulls, respectively; P<0.01) of the experimental period. The amount of creatinine formed each day depends on the total content of creatine, which in turn depends on the dietary intake, the rate of synthesis of creatine and the muscle mass (Finco, Citation1997). Thus, the differences between the groups in plasma creatinine concentration at the 4th week may not suggest renal failure because all the concentrations are within the reference values for cattle (Kaneko et al., Citation1997; Agenäs et al., Citation2006). These differences may reflect greater muscle mass growth in the Control bulls compared to the 10%NaCl bulls, which is in line with the ADG differences observed between the 2 groups. Urea to creatinine ratio also differed only on the 4th week, being greater for 10%NaCl than for Control bulls (data not shown). The urea concentration increased from the 2nd to the 6th week in both groups of bulls, whereas creatinine decreased from the beginning to the 2nd week but returned to initial values afterwards ().
Behaviour
The Control bulls spent less time each day eating hay (P<0.001) but similar time eating concentrate compared to the 10%NaCl bulls (). Consequently, the Control bulls spent less total time eating than the 10%NaCl bulls (15.7 vs 28.2%, respectively; standard error=1.67, P<0.001). This difference could most likely be related to the lower fibre content of their diet (Thorp et al., Citation1999). Similarly, bulls eating a concentrate-based ration (for- age-to-concentrate ratio of 8:92) spent less time eating than bulls eating a hay-concentrate diet (forage-to-concentrate ratio of 44:56) (Mialon et al., Citation2008). However, the time devoted to eating in the current experiment is greater than the time reported by the above-mentioned study. Moreover, the absence of differences in the time devoted to eating concentrate in the current experiment contradicts the difference in concentrate intake between the two groups of bulls. This discrepancy suggests that the Control bulls spent more time consuming concentrate during the nocturnal period than the 10%NaCl bulls because the intake rate was limited because the feeding station delivered a fixed amount of concentrate per visit. According to Mialon et al. (Citation2008), bulls fed a hay-concentrate (44:55) diet displayed three peaks of eating activity, the main one following feed delivery in the morning, one at the middle of the day and a smaller one at the end of the diurnal period, whereas concentrate-fed bulls spread the meals more evenly over the diurnal part of the day. Similar diurnal patterns have been found in the current experiment ().
The proportion of time devoted to other activities did not differ between feeding treatments (P=0.64; ). In fact, the number of times that bulls drank throughout the daylight hours did not differ between treatments (5.3 and 5.1 for Control and 10%NaCl bulls, respectively; P>0.05), which contradicts the recorded water intake. According to Gonzalez et al. (Citation2008), the water intake during the night (20.30 to 8.30 h) ranges between 25 and 34% of the daily water intake and tends to increase with the sodium bicarbonate concentration in the concentrate. Another possible explanation for the absence of differences could be that 10%NaCl bulls drank more water than their counterparts per visit as measured by scan sampling. The 10-min scan sampling is an accurate method to sample maintenance behaviours and approximates continuous sampling in feedlot cattle (Mitlohner et al., Citation2001). However, according to these authors, 10-min scan sampling used to measure short-duration activities such as drinking had a lower correlation with continuous sampling (r=0.67) than long-term activities such as feeding, standing and lying (r>0.82). Thus, it would be more appropriate to register water intake every 5 min. There was an increase in the time engaged in other activities at day 18 compared to day 21 of the experimental period (6.1 vs 9.6%, respectively; P=0.03). This difference could be related to the ambient temperature, which was above the thermo-neutral range throughout the 3rd week (), and this heat load might have caused the increase in drinking events and social interactions.
Due to the differences in eating and drinking behaviour, the Control bulls devoted more time to resting than the 10%NaCl bulls (P<0.01). Therefore, the Control bulls spent more time lying down (P<0.05). These lying values are lower than those reported by Mialon et al. (Citation2008) in straw-concentrate- and hay-concentrate-fed bulls, most likely because the above mentioned study included the night period, when 80 to 90% of cattle lie down (Ray and Roubicek, Citation1971), but the night time was not studied in the current experiment.
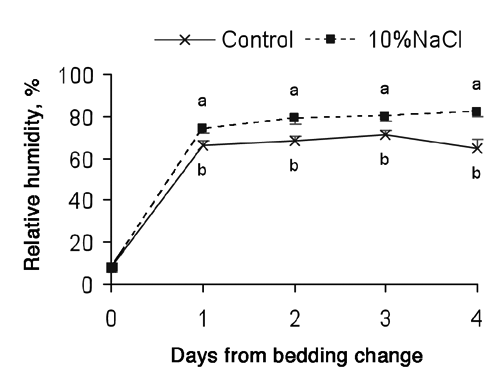
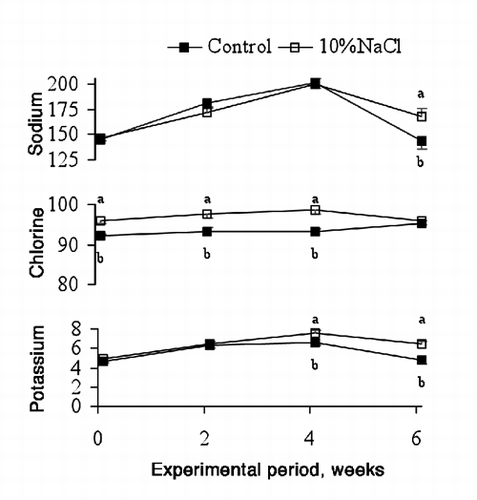
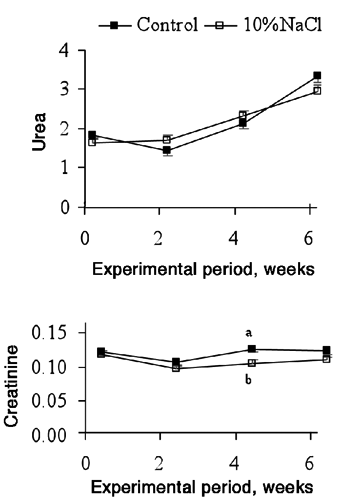

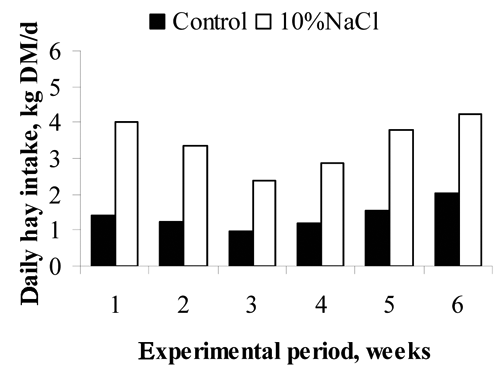
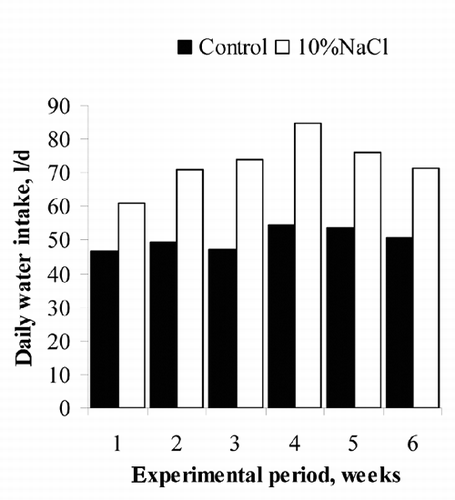
Table 1. Composition of feedstuffs utilised in the experiment (as fed basis) and their chemical composition.
Table 2. Performance of Control and 10%NaCl bulls.
Table 3. Proportion of time devoted to each activity between dawn and dusk (06.30 to 21.30 h).
Conclusions
The inclusion of a 10%NaCl in the concentrate over 6 weeks reduced concentrate intake with a concomitant decrease in weight gain, most likely due to a reduction in energy intake. This inclusion, however, had a limited effect on blood ions and renal function indicators. Consequently, high NaCl inclusion in the concentrate could be used to reduce concentrate intake during short periods of time when water supply is guaranteed. This strategy cannot be recommended for longer periods of time as the effects of a longer exposition should be evaluated.
Acknowledgements
The authors wish to thank the staff of the Agrifood Research and Technology Centre of Aragon (CITA) for technical support. Research was funded by projects INIA RZP2012-00002, INIA RZP2009-00005, INIA PET2007-05- C03 and UDL P09014.
References
- AgenasS. HeathM.F. NixonR.M. WilkinsonJ.M. PhillipsC.J.C., 2006. Indicators of undernutrition in cattle. Anim. Welfare 15:149-160.
- Álvarez-RodríguezJ. VillalbaD. CubilóD. MolinaE., 2011. Concentración sérica de macrominerales de terneros en producción ecológica. Available from: www.aida-itea.org/aida-itea/files/itea/revis-tas/2011/107-2/94-101_ITEA_107-2.pdf
- AOAC, 1999. Official methods of analysis. 16th ed., Association of Official Analytical Chemists, Washington, DC, USA.
- Apper-BossardE. PeyraudJ.L. DourmadJ.Y., 2009. Effects of dietary cation-anion difference on performance and acid-base status: a review. Prod. Anim. 22:117-130.
- CardonB.P., 1953. Influence of a high salt intake on cellulose digestion. J. Anim. Sci. 12:536-540.
- CarlsonG.P., 1997. Fluid, electrolyte and acid-base balance. In: KanekoJ. HarveyJ.W. BrussM.L. (eds.) Clinical biochemistry of domestic animals. Academic Press, San Diego, CA, USA, pp 485-516.
- ConstableP.D., 1999. Hypertonic saline. Vet. Clin. N. Am.-Food A. 15:559-585.
- DavisM.S. MaderT.L. HoltS.M. ParkhurstA.M., 2003. Strategies to reduce feedlot cattle heat stress: effects on tympanic temperature. J. Anim. Sci. 81:649-661.
- DigbyS.N. ChadwickM.A. BlacheD., 2011. Salt intake and reproductive function in sheep. Animal 5:1207-1216.
- FincoD.R., 1997. Kidney function. In: KanekoJ. HarveyJ.W. BrussM.L. (eds.) Clinical biochemistry of domestic animals. Academic Press, San Diego, CA, USA, pp 441-484.
- GaughanJ.B. MaderT.L., 2009. Effects of sodium chloride and fat supplementation on finishing steers exposed to hot and cold conditions. J. Anim. Sci. 87:612-621.
- GonzalezL.A. FerretA. MantecaX. CalsamigliaS., 2008. Increasing sodium bicarbonate level in high-concentrate diets for heifers. 1. Effects on intake, water consumption and ruminal fermentation. Animal 2:705-712.
- HartS.P. PolanC.E., 1984. Effect of sodium bicarbonate and disodium phosphate on animal performance, ruminal metabolism, digestion, and rate of passage in ruminating calves. J. Dairy Sci. 67:2356-2368.
- HostiouN. DedieuB., 2012. A method for assessing work productivity and flexibility in livestock farms. Animal 6:852-862.
- JacksonJ.A. HopkinsD.M. XinZ. HemkenR.W., 1992. Influence of cation-anion balance on feed intake, body weight gain, and humoral response of dairy calves. J. Dairy Sci. 75:1281-1286.
- KanekoJ. HarveyJ.W. BrussM.L., 1997. Blood analyte reference values in large animals. In: KanekoJ. HarveyJ.W. BrussM.L. (eds.) Clinical biochemistry of domestic animals. Academic Press, San Diego, CA, USA, pp 441-484.
- KellawayR.C. ThomsonD.J. BeeverD.E. OsbournD.F., 1977. Effects of NaCl and NaHCO3 on food-intake, growth-rate and acid-base-balance in calves. J. Agr. Sci. 88:1-9.
- KilmerL.H. MullerL.D. WangsnessP.J., 1980. Addition of sodium bicarbonate to rations of pre- and postpartum dairy cows. J. Dairy Sci. 63:2026-2036.
- LehnerP.N., 1996. Handbook of ethological methods. Cambridge University Press, Cambridge, UK.
- LeibholzJ. KellawayR.C. HargreaveG.T., 1980. Effects of sodium-chloride and sodium-bicarbonate in the diet on the performance of calves. Anim. Feed Sci. Tech. 5:309-314.
- McDowellL.R., 2003. Minerals in animal and human nutrition. Elsevier, Amsterdam, The Netherlands.
- MeyerJ.H. WeirW.C. IttnerN.R. SmithJ.D., 1955. The influence of high sodium chloride intakes by fattening sheep and cattle. J. Anim. Sci. 14:412-418.
- MeyerU. StahlW. FlachowskyG., 2006. Investigations on the water intake of growing bulls. Livest. Sci. 103:186-191.
- MialonM.M. MartinC. GarciaF. MenassolJ.B. DubroeucqH. VeissierI. MicolD., 2008. Effects of the forage-to-concentrate ratio of the diet on feeding behaviour in young Blond d’Aquitaine bulls. Animal 2:1682-1691.
- MitlohnerF.M. Morrow-TeschJ.L. WilsonS.C. DaileyJ.W. McGloneJ.J., 2001. Behavioral sampling techniques for feedlot cattle. J. Anim. Sci. 79:1189-1193.
- MorrisC.A. WiltonJ.W., 1976. Influence of body size on the biological efficiency of cows: a review. Can. J. Anim. Sci. 56:613-647.
- MorrisJ.G., 1980. Assessment of sodium requirements of grazing beef-cattle: review. J. Anim. Sci. 50:145-152.
- National Research Council, 1996. Nutrient requirements of beef cattle. 7th rev. ed. National Academy Press, Washington, DC, USA.
- RayD.E. RoubicekC.B., 1971. Behavior of feedlot cattle during two seasons. J. Anim. Sci. 33:72-76.
- RocheJ.R. DalleyD. MoateP. GraingerC. RathM. O’MaraF., 2003. Dietary cationanion difference and the health and production of pasture-fed dairy cows. 1. Dairy cows in early lactation. J. Dairy Sci. 86:970-978.
- SAS, 2004. Base SAS 9.1 procedure guide, version 9.1. SAS Inst. Inc., Cary, NC, USA.
- SchauerC.S. LardyG.P. SlangerW.D. BauerM.L. SedivecK.K., 2004. Self-limiting supplements fed to cattle grazing native mixed-grass prairie in the northern Great Plains. J. Anim. Sci. 82:298-306.
- ThorpC.L. WylieA.R.G. SteenR.W.J. ShawC. McEvoyJ.D., 1999. Effect of dietary forage: concentrate ratio on the behaviour, rumen fermentation and circulating concentrations of IGF-1, insulin, glucagon and metabolites of beef steers and their potential effects on carcass composition. Anim. Sci. 68:533-546.
- UnderwoodE.J. SuttleN.F., 1999. The mineral nutrition of livestock. CABI Publishing, Wallingford, UK.
- Van SoestP.J. RobertsonJ.B. LewisB.A., 1991. Methods for dietary fiber, neutral detergent fiber, and nonstarch polysaccharides in relation to animal nutrition. J. Dairy Sci. 74:3583-3597.
- VerlanderJ.W., 2003. Renal physiology. In: CunninghamJ.G. (ed.) Textbook of veterinary physiology. Saunders Elsevier, Amsterdam, The Netherlands, pp 430-467.
- WardW.R. HughesJ.W. FaullW.B. CrippsP.J. SutherlandJ.P. SutherstJ.E., 2002. Observational study of temperature, moisture, pH and bacteria in straw bedding, and faecal consistency, cleanliness and mastitis in cows in four dairy herds. Vet. Rec. 151:199-206.
- Zorrilla-RiosJ. GarzaJ.D. OwensF.N., 1990. Impact of osmotically active compounds on rumen digesta kinetics. Anim. Sci. Res. Rep. 129:170-173.
APPENDIX