
Abstract
Prediction of the expected milk yield is important for the management of the primiparous cows (PPC) with a few or no data on their own milk productivity. We developed a system of regression equations for predicting milk yields in standard lactation. The models include the systematic effects of the calving season, the five-year rolling herd average of milk yield of PPC, the breeding values of the parents for milk production, and daily milk recordings. A total of 21,901 lactations of Holstein PPC were collected during the regular monthly milk recordings of cows in the Republic of Slovenia. By including daily milk recordings in the model, the coefficients of determination of regression models for the prediction of milk yield increase: without known recordings (M0) R2=0.80; with one recording (M1) R2=0.82; with two first consecutive recordings (M2) R2=0.86; and with three recordings (M3) R2=0.89. Deviations of milk yield up to 500 kg in a standard lactation (<1.6 kg/day) were as follows: with the model M0, they occurred in 53.4% of PPC; with M1, they occurred in 56.3% of PPC; with M2, they occurred in 64.5% of PPC; and with M3, they occurred in 70.9% of PPC. We concluded that the developed system of regression models is an appropriate method for milk yield prediction of PPC.
Introduction
To achieve good economic efficiency of breeding, as well as to ensure good health and well being of dairy cows at the farm setting real milk production targets in accordance with the genetic potential of the herd and the level of its management is undoubtedly essential.
Within the management framework, nutrition of dairy cows is a key factor that directly influences milk production, health status, fertility, and quality of milk of dairy cows (Friggens et al., Citation2007, Sova et al., Citation2013). Without the expected milk yield predictions it is difficult to plan a rationale and physiologically balanced ration in accordance with the needs of the animals.
Primiparous cows (PPC) in the initial stage of lactation present a special challenge, because breeders have very limited data on their milk productivity, which makes such milk yield predictions rather unreliable. To classify PPC into milk production groups based on their predicted milk yield, we need not only data on their current milk production, but also data on the expected milk yield in a standard lactation and data on the lactation curve trajectory in all stages of lactation.
Various methods have been proposed for predicting milk yield in lactation with a limited number of milk recordings (Macciotta et al., Citation2002). Jones (Citation1997) suggested the Empirical Bayes prediction method, which weights the test-day milk production from the lactation in progress with lactation curves from a historical database of completed lactations of cows with the same characteristics. An Autoregressive Integrated Moving Average (ARMA) model was determined by Macciotta et al. (Citation2002), and it requires many repetitions of adjustments by time series for the estimation of parameters. The test-day model (TDM) that is generally used for estimating breeding values is another method (Mayeres et al., Citation2004). The model includes a fixed herd-year-season (HYS) influence, which cannot be used directly in the algorithms for predicting milk yields, as it does not predict trends of shifting milk yields. Mayeres et al. (Citation2004) addressed this by decomposing the HYS influence into three effects related to the herd, which determine the trend of shifting milk yields according to month, year, and a random herd effect on a test-day.
When estimating daily milk yield on the basis of the expected standard lactation curve (SLC) trajectory, the random effect of daily milk fluctuations due to management errors and animal health problems will be lower than when estimating milk yield with the TDM model (Nordlund, Citation2006). This is important for managing nutrition of a dairy herd, since that allows us to monitor the planned lactation curve trajectory, which reflects the phenotypic milk producing ability of an animal.
In addition to the above-mentioned methods for estimating the lactation curve trajectory and the expected milk yield, several other models exist (Grzesiak et al., Citation2003), which are based on a minimum number of milk recordings. When using the SLC, we encountered the issue of unreliability of milk yield predictions based on first milk recordings (Jeretina et al., Citation2013). When there is insufficient milk production data available, milk yield predictions for PPC can be doubtful (Macciotta et al., Citation2005; Silvestre et al., Citation2006). Consequently, it is reasonable to use breeding value data of the parents and the average milk yield of the herd, as well as the first milk recordings, which are collected during regular milk recordings (Mayeres et al., Citation2004). We hypothesized that the milk yield of PPC in the herd depends on the level of herd management, while the breeding value of the parents reflects their genetic potential transferred to the PPC. Moreover, the first daily milk recordings provide additional information, which can be used to improve the reliability of our predictions.
The aim of the present study was to develop regression equations for predicting milk yield in a standard lactation of PPC, which can be used together with the SLC to estimate the standard lactation curve trajectory on a daily level. The method is simple and allows realtime corrections to the herd management.
Materials and methods
Data
The survey was limited to the data of primiparous Holstein dairy cows, which calved between 1 January 2008 and 31 December 2012. The data were collected during the regular monthly milk recordings, which are performed by the Slovenian Agency for the Control of Milk Production of Cows. The calculation of lactations was carried out using the test interval method (ICAR, Citation2012), based on which breeding values for milk production are calculated (Potočnik et al., Citation2001).
We processed data on lactations longer than 304 days with a normal shape of the lactation curve, as determined by the parameters of the model for estimating a standard lactation curve trajectory (Wood, Citation1967). The interval between the calving and the first milk recording usually had to be between 5 and 37 days; in exceptional cases (sickness, injury, animal under treatment, disaster-the reason must be reported) it could be up to 80 days. All the consecutive milk recordings were performed between day 22 and day 37; in exceptional cases (because of holidays or veterinary limitations), they could be performed up to day 75.
In addition, the PPC had to have both parents known (i.e., with available breeding value data for milk production over 305 days), as well as more than nine herd mates with completed standard lactations in the 5 years before the calving of the primiparous cow.
On the basis of these conditions, we processed data of 21,901 PPC, for which 271,988 milk recordings were performed (Table 1).
Table 1. Descriptive statistics of primiparous cows.
Regression models
Based on the data of standard lactations (MY305), we analysed four regression models. All of them included the influence of the season (S) and the age at first calving (FCA, categorized in eight classes: <23 months, 24, 25, >30 months), as well as the rolling herd average of PPC in a standard lactation (RPHA), breeding value of the father (BVF), and breeding value of the mother (BVM). We presupposed that the residuals were normally distributed. Model M0 did not include data on the milk yield of the PPC. The other models used milk yields from the first milk recording (M1), the first and the second milk recordings (M2), and the first three consecutive milk recordings in the initial stage of lactation (M3). The model equations can be written in scalar form as:
where: yijk, dependent variable (kg of milk in standard lactation); m, mean value of the model; Si, season of calving [i=1, spring (Mar, Apr, May); 2, summer (Jun, Jul, Aug); 3, autumn (Sep, Oct, Nov); 4, winter (Dec, Jan, Feb)]; FCAj, first calving age (j≤23 months, 24, 25…, ≥30 months); β0, β1, β2, β3, β4, β5, regression coefficients for RPHA, BVF, BVM, TD1 (test-day milk yield at first recording), TD2 (test-day milk yield at second recording), TD3 (test-day milk yield at third recording); eijk, temporary measurement error, N(0, σ2e).
The estimates of the fixed effects and the regression coefficients of the models allowed us to estimate milk yield in a standard lactation for an individual model (MY305M). Model specification and the choice of fixed effects in the model were based on checking their significance by using the lm function in R software (R Development Core Team, Citation2006), and the variables that were significant at P<0.001 were included in the model. Variance components were estimated separately for S, FCA, RPHA, BVF, BVM, and TD using the ANOVA function in R software. At the same time, we estimated total variance for comparisons of the models.
Checking the reliability of predictions of the models
We checked the reliability of the predictions of the models by calculating the correlations between MY305M and MY305, residual variance (RV), and percentage-squared bias (PSB) (Ali and Schaeffer, Citation1987), and by k -fold cross-validation (Hastie et al, Citation2002). In k -fold cross-validation, part of the available data is used to fit the model, and a different part to test it. Overall, typically 10-fold cross-validation is sufficient for testing the reliability of model predictions (Kohavi, Citation1995). The PPC were randomly classified into 10 subsets of approximately equal size. In 10 repetitions, the model parameters were estimated on a learning set of 9 subsets and the predictions were compared with the observed values in the remaining subset. For all the repetitions, the correlations between MY305M and MY305 were calculated. The average correlation coefficient across the 10 repetitions and the standard deviation of the correlation were determined. A total of 2491 animals were included in calibration set with exception of set ten, where 2486 animals were involved. All animals were classified in calibration sets randomly (using Oracle random function). In ten repetitions, the regression parameters were estimated for all four models on nine calibration sets and at the same time were estimated regression parameters on set 10. Regardless of whether they have been animals randomly split between calibration sets was herd distribution within calibration set randomly and balanced as well. Animals that were included in present study derive from 2009 farms.
All analyses were carried out in R software (R Development Core Team, Citation2006).
Additional correction of the models
Expected milk yields of PPC were estimated using models M0, M1, M2, and M3. Because of high milk yield variation of PPC within herds, we expected a biased prediction of milk yield. To improve the prediction of milk yields, we adjusted the predictions using the regression equation:
where: ΔMY305M, additional correction to MY305M; a, intercept of the regression model; β1, regression coefficient for milk yield in standard lactation predicted by the model (MY305M).
Results and discussion
The prediction of milk yield in a standard lactation is very unreliable in the initial stage of lactation because of very few daily milk recordings and their distribution. We approached the issue by using four regression models that include the average milk yield in a standard lactation of PPC in a herd, as well as breeding values of the fathers and the mothers for milk production in a standard lactation. In these models, the age of cows at their first calving, as well as milk yields upon the first, second, and third milk recording were included. For predictions of milk yield that take into consideration first milk recordings, the PPC that calve in autumn showed higher milk yields than PPC calving in the other seasons. For cows calving during the summer months, lower milk yields were mostly the result of heat stress, as confirmed by several authors (Jenko, Citation2012; Hammami et al., Citation2013; Smith et al., Citation2013). This can be alleviated by using suitable breeding technologies. Before setting up the models, we tested the influence of the number of days between calving and an individual milk recording. This influence was not significant and so was not included in the model. As the consequence of the highest unexplained percentage of residual value, the lowest coefficient of determination (R2) was estimated with model M0 (R2=0.45) (Table 2). The calculated correlation between MY305M from model M0 and MY305 was 0.66 (Table 2), which was greater than in a comparable study (Mayeres et al., Citation2004), where the value was r=0.575. Including the data of own production in the first, second and third milk recordings increased R2 even more (M1, R2=0.67; M2, R2=0.78; M3, R2=0.85) (Table 2). In these cases, we also obtained better correlations r=0.82, 0.89, and 0.92 (for models M1, M2, and M3, respectively) (Table 2) compared with Mayeres et al. (Citation2004). The influence of the calving season was statistically significant in all of the models (P<0.001) (Table 3). The largest percentage of phenotypic variance of the models can be explained by the influence of RPHA (35.4%) (Table 3).
Table 2. Coefficients of multiple regression models for the prediction of milk yield in standard lactation of Holstein-Friesian breed.
Table 3. Variance analyses of multiple regression models.
The average milk yield of PPC in a herd depends on the level of management, which comprises a variety of influences that cannot be broken down, but influence the milk yield in a standard lactation. Caccamo et al. (Citation2008) showed high variance between average herd milk yield curves around the peak, which indicates differences in management between herds. We assume that these influences include the nutrition of the animals, the size of the animals, individual or group approach to management, health and general well being of the animals, as well as breeding intensity of heifers.
Several authors have established that the age of cows at first calving influences milk yield in a standard lactation (Ettema and Santos, Citation2004; Mohd Nor et al., Citation2013), as well as the number of somatic cells in the initial stage of lactation (Archer et al., Citation2013). However, in our study, the influence of the somatic cells was not statistically significant and was therefore not included in further analyses.
Only a low percentage (0.4%) of the variability of the model was explained by the influence of FCA (Table 3). We included it as a fixed influence in the regression models and we came to similar conclusions as in previous studies (Nilforooshan and Edriss, Citation2004; Mohd Nor et al., Citation2013). In model M0, the milk yield of PPC that calved at age 23 months was 143 kg lower than that of cows that calved at age 24 months (Table 2). Cows that calved at age 25 months had milk yield 48 kg higher than for cows that calved at age 24 months (Table 2). We observed the same trend in the other models.
The increase in milk yield with higher calving age is related to the increase in frame size of PPC and the development of their mammary glands (Mohd Nor et al., Citation2013). Milk yield most significantly increased with PPC that calved between 23 and 25 months of age. With cows that calved at a later age, the increase in milk yield became less pronounced. In all the models, the influence of breeding values of the father and the mother accounted for 3.3% and 4.9% of the total variance, respectively (Table 3). This is due to low heritability of first test day records, which depicts the evolution of heritability of milk over days in milk (DIM), with an average of 0.197 (SE=0.015 to 0.022) (Bastin et al., Citation2011). Consequently, these two influences explain 8.2% of the total variance. The influence of breeding values of the father and the mother were most pronounced in model M0. However, after including the first milk recordings in the models, their influence became less pronounced. In model M0, the regression factor BVM was bigger than the regression factor BVF (β3=0.63 vs β2=0.54) (Table 2), but with additional recordings BVF weighted more than BVM (Table 3).
The milk yield upon first recording explained 21.4% of the total variance (Table 3). With each additional kilogram of milk upon first recording, we can expect an increase of milk yield in MY305M by 128.6 kg from the model using one known milk recording (Table 2). When cows have two known milk recordings, the expected milk yield increase is 65.8 kg per kilogram of the first milk recording and 119.7 kg per kilogram of the second milk recording (Table 2). Consequently, with two known milk recordings, we can explain 33.7% of the total variance (Table 3). With three known milk recordings, the expected milk yield in MY305M increases by 49.8 kg with each additional kilogram of milk upon first recording; by 68 kg with each additional kilogram of milk upon the second recording; and by 101.1 kg with each additional kilogram of milk upon the third recording (Table 2). As a result, the total percentage of explained variance is 39.6% (Table 3). The unexplained residual variance decreased with the increase of the number of independent variables in the models (M0=55.3%, M1=33.9%, M2=21.6%, and M3=14.6%) (Table 3).
After the analysis of variance between the models, we established that the mean values of the models showed statistically significant differences (P<0.001). The percentage of squared bias was reduced with the inclusion of milk recordings, which demonstrates that, by increasing the number of milk recordings, the model becomes more reliable.
Using multiple cross-validations in 10 repetitions of 2491 PPC on each subset except the last where it was 2486 PPC, the average correlations and their standard deviations were calculated. The values for individual models were as follows: M0, r=0.66, SD=0.010; M1, r=0.82, SD=0.008; M2, r=0.89, SD=0.004; and M3, r=0.92, SD=0.004 (Table 2). The high correlations and low standard deviations indicate that the models for predicting of milk yield in a standard lactation are relatively stable.
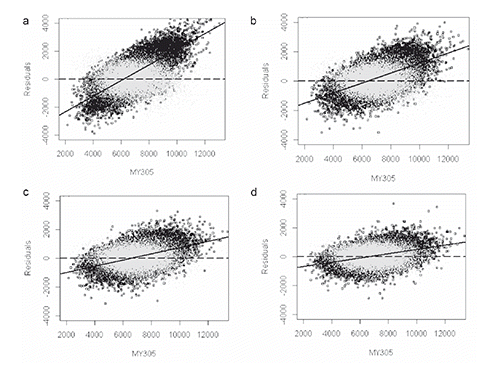
The distribution of differences between MY305 and MY305M calculated from each model were analysed and are presented in Table 4 and Figure 1.
Table 4. Regression coefficients for additional correction of models.
The prediction is biased because herd averages include PPC with low milk yield and PPC with high milk yield, which is confirmed by the high variability within the herd (coefficient of variation ranged from 5.5 to 29.2%). To improve the prediction of milk yields in a standard lactation, as well as to reduce the bias, the models were adjusted in several different ways. By re-parameterizing the models, the average herd milk yields of PPC were classified into classes. Milk yield in a standard lactation was expressed by the quotient between milk yield of a primiparous cow and average milk yield of PPC in the herd. Contrary to our expectations, the reliability of prediction of the models was reduced, as well as the percentage of the explained variance from the total variance.
Using additional regression analysis and correction of the already predicted milk yield significantly improved the prediction of milk yield in a standard lactation. Regressions for the residuals were estimated and the new corrected values in relation to the milk yield were calculated (Table 4).
The results from the additional analysis were compared with the results from the original four models, and an improvement in the reliability of the estimated standard lactation with models M0 and M1 was established. The effect of additional correction with models M2 and M3 was slightly smaller because of the smaller bias of the models. Nevertheless, it was sufficient to be considered. PSB was significantly reduced with models M0 and M1 (PSB from 2.57 to 0.96 at M0 and PSB from 1.39 to 0.87 at M1), but slightly less with models M2 and M3 (PSB from 0.85 to 0.65 at M2 and PSB from 0.57 to 0.48 at M3) (Table 4). Values of R2 for models M0, M1, M2, and M3 after the additional correction were 0.80, 0.82, 0.86, and 0.89 (Table 4).
The additional correction of the regression model was checked with 10-fold cross-validation (Table 4). The results showed sufficient accuracy of prediction, which confirms the suitability of the additional correction method. Figure 2 shows the percentages of PPC with deviations of milk yield up to 500 kg in a standard deviation.
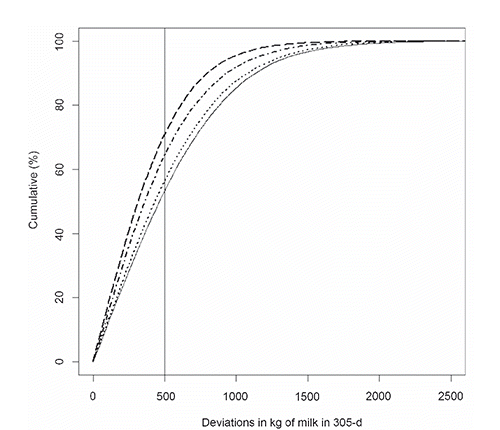
Model M0 without first milk recordings comprises only 53.4% of all PPC; model M1 with one milk recording comprises 56.3% of PPC; model M2 with two milk recordings comprises 64.5% of PPC, and model M3 with three milk recordings comprises almost 70.9% of PPC. A deviation of milk yield up to 500 kg in a standard lactation is equivalent to average 1.6 kg milk per day, which is acceptable variation for management. Because the milk yield prediction based on models that include the first milk recording is more reliable, it would be reasonable to include data on daily milk yields of PPC in the prediction as soon as possible. This is especially recommended for herds with daily milk recordings, e.g. with robotic milking or in milking parlours with automated milk yield recording.
Conclusions
Regression models can reliably and simply predict the expected milk yield of PPC using calculated breeding values of the parents, calving period, age at calving, and the five-year rolling average herd milk yield of PPC. The rolling herd average of standard lactation of PPC is the most important factor for predicting milk yield in standard lactation of cows without their own test day data. Adding the first and all the consecutive milk recordings in the model can further improve the prediction of milk yield and enable checking of herd management success in real time. In order to facilitate computations, it is reasonable to adopt an approach which applies breeding values of parents – whose data are pre-corrected for additive genetic and environmental effects – from population-wide breeding value estimation. However, owing to the great variability in milk yields of cows within a herd, the prediction of milk yield without an additional correction is biased.
References
- AliT.E. SchaefferL.R., 1987. Accounting for covariances among test day milk yields in dairy cows. Can. J. Anim. Sci. 67:637–644.
- ArcherS.C. McCoyF. WapenaarW. GreenM.J., 2013. Association between somatic cell count early in the first lactation and the lifetime milk yield of cows in Irish dairy herds. J. Dairy Sci. 96:2951–2959.
- BastinC. GenglerN. SoyeurtH., 2011. Phenotypic and genetic variability of production traits and milk fatty acid contents across days in milk for Walloon Holstein first-parity cows. J. Dairy Sci. 94:4152–4163.
- CaccamoM. VeerkampR.F. de JongG. PoolM.H. PetriglieriR. LicitraG., 2008. Variance components for test-day milk, fat, and protein yield, and somatic cell score for analyzing management information. J. Dairy Sci. 91:3268–3276.
- EttemaJ.F. SantosJ.E.P., 2004. Impact of age at calving on lactation, reproduction, health, and income in first-parity Holsteins on commercial farms. J. Dairy Sci. 87:2730–2742.
- FriggensN.C. RidderC. LøvendahlP., 2007. On the use of milk composition measures to predict the energy balance of dairy cows. J. Dairy Sci. 90:5453–5467.
- GrzesiakW. WojcikJ. BinerowskaB., 2003. Prediction of 305-day first lactation milk yield in cows with selected regression models. Arch. Tierzucht 46:215–226.
- HammamiH. BormannJ. M’hamdiN. MontaldoH.H. GenglerN., 2013. Evaluation of heat stress effects on production traits and somatic cell score of Holsteins in a temperate environment. J. Dairy Sci. 96:1844–1855.
- HastieT. TibshiraniR. FriedmanJ., 2002. Elements of statistical learning: data mining, inference, and prediction. 2nd ed. Springer, Amsterdam, The Netherlands.
- ICAR, 2012. International agreement of recording practices. International Committee for Animal Recording, Rome, Italy.
- JenkoJ., 2012. Heat stress risk, alert system for dairy cattle in Slovenia. Acta Agr. Slov. 3:291–294.
- JeretinaJ. BabnikD. ŠkorjancD., 2013. Modeling lactation curve standards for test-day milk yield in Holstein, Brown Swiss and Simmental cows. J. Anim. Plant Sci. 23:754–762.
- JonesT., 1997. Empirical Bayes prediction of 305-day milk production. J. Dairy Sci. 80:1060–1075.
- KohaviR., 1995. A study of cross-validation and bootstrap for accuracy estimation and model selection. In Proc. 14th Int. Joint Conf. Artificial Intelligence, San Francisco, CA, USA, 2:1137–1143.
- MacciottaN.P.P. VicarioD. Cappio-BorlinoA., 2005. Detection of different shapes of lactation curve for milk yield in dairy cattle by empirical mathematical models. J. Dairy Sci. 88:1178–1191.
- MacciottaN.P.P. VicarioD. PulinaG. Cappio-BorlinoA., 2002. Test day and lactation yield predictions in Italian Simmental cows by ARMA methods. J. Dairy Sci. 85:3107–3114.
- MayeresP. StollJ. BormannJ. ReentsR. GenglerN., 2004. Prediction of daily milk, fat, and protein production by a random regression test-day model. J. Dairy Sci. 87:1925–1933.
- Mohd NorN. SteeneveldW. van WervenT. MouritsM.C.M. HogeveenH., 2013. First-calving age and first-lactation milk production on Dutch dairy farms. J. Dairy Sci. 96:981–992.
- NilforooshanM.A. EdrissM.A., 2004. Effect of age at first calving on some productive and longevity traits in Iranian Holsteins of the Isfahan Province. J. Dairy Sci. 87:2130–2135.
- NordlundK., 2006. Transition cow index TM. pp 139–143 in Proc. 39th American Assoc. Bovine Practitioners, St. Paul, MN, USA.
- PotočnikK. KrsnikJ. ŠtepecM. DolinarA., 2001. Developments in prediction of breeding values in Slovenia. pp 107–111 in Proc. 2001 INTERBULL Meeting, Budapest, Hungary.
- R Development Core Team, 2006. R: a language and environment for statistical computing. R Foundation for Statistical Computing, Vienna, Austria.
- SilvestreA.M. Petim-BatistaF. ColacoJ., 2006. The accuracy of seven mathematical functions in modeling dairy cattle lactation curves based on test-day records from varying sample schemes. J. Dairy Sci. 89:1813–1821.
- SmithD.L. SmithT. RudeB.J. WardS.H., 2013. Short communication: comparison of the effects of heat stress on milk and component yields and somatic cell score in Holstein and Jersey cows. J. Dairy Sci. 96:3028–3033.
- SovaA.D. LeBlancS.J. McBrideB.W. De VriesT.J., 2013. Associations between herd-level feeding management practices, feed sorting, and milk production in free-stall dairy farms. J. Dairy Sci. 96:4759–4770.
- WoodP.D.P., 1967. Algebraic model of the lactation curve in cattle. Nature 216:164–165.