
Cytometry by time-of-flight
Cytometry by time-of-flight (CyTOF) or mass cytometry is a relatively new technology for real-time analysis of single cells using inductively coupled plasma time-of-flight MS (ICP-MS) [Citation1–8]. Analysis of multiplexed assays is highly important for clinical diagnostics and other bioanalytical applications [Citation9–14]. Barcode-based bioassays for mass cytometry are able to encode and decode for different samples within the same experiment, facilitating progress in producing straightforward and consistent results. Barcoding can streamline mass cytometry experimentation during clinical bioanalysis by reducing processing time throughout the workflow, and eliminating sample-to-sample variation introduced during individual sample staining. An integrated approach for automated sample preparation for barcoding in clinical research was described; this approach was used with mass cytometry instrumentation to characterize single cells in the clinical samples. There are some limitations that are preventing mass cytometry from reaching its full potential.
Palladium-based barcoding technique for CyTOF
Barcoding in cytometric analyses was first developed for fluorescence based flow cytometry [Citation15,Citation16]. Barcoding technique was extended to mass cytometry by several labs [Citation17–20]. A recent innovation by the Nolan lab involves a nonlanthanide metal isotope barcoding approach which significantly enhances sample throughput [Citation20]. The only currently available barcoding kit uses six different isotopes conjugated with palladium-based labeling (Pd102, Pd104, Pd105, Pd106, Pd108 and Pd110). Mass-tag cell barcoding (MCB) allows labeling of individual cell samples; using the above kit to analyze for each combination of three Pd-labeled isotopes for each barcoded sample yields 20 unique combinations. This allows for combination and subsequent staining and data acquisition as one multiplexed sample. Some advantages of this approach are:
MCB uses a single antibody cocktail to stain all samples simultaneously within a single sample, ensuring that all samples are exposed to the same antibody concentration at the same cell density and also improves processing time and sample conservation throughout the entire experimental workflow.
This uniform antibody exposure eliminates sample-to-sample variation introduced when samples are stained, washed and collected individually.
Previous MCB protocols used paraformaldehyde (PFA) for fixation and methanol for permeabilization before the antibody staining steps, which can adversely affect the quality of antibody staining for some epitopes.
Current MCB: Perform barcode staining before methanol permeabilization, allowing methanol-sensitive surface markers to be assessed in combination with MCB multiplexing.
Palladium-based barcode does not interfere with other lanthanide measurement channels so it does not reduce the number of antibody-based measurement parameters available when using the lanthanides. However, Pd110 does overlap with the Cd110, which are therefore not recommended for use in combination with the palladium-based MCB protocol.
Because palladium-based barcode masses are outside the range of the lanthanide antibodies’ measurement channels, no cross-talk will occur.
After performing sample preparation and analysis, debarcoding software facilitates individual sample analysis. In order to decode, one simply has to make sure that the top-3 palladium labels are significantly higher than those remaining and decode based on their presence. A key advantage of this debarcoding algorithm is that it does not resort to mixture models or other types of population distribution analysis and can be done on a cell-by-cell basis, which improves accuracy as well.
High-throughput & automated robotic platform
Automated sample preparation methods are valuable because they are performed consistently every time, reduce reagent use and improve standardization, accuracy and operational logistics for clinical sample preparation. Many phases of quantitative bioanalysis such as sample collection and sorting, sample preparation, sample analysis and data processing and reporting will benefit from improvements in throughput rates [Citation21–23]. The constant pressure to reduce development times for bioanalytical functions in clinical research is driving the need for improved process throughput in each of these individual phases, as well as the larger operations. Further, the ever-increasing number of biological samples requiring analysis, and the desire for better sensitivity coupled with minimization of errors, adds another layer of urgency. These demands make it vital for researchers to improve throughput for any aspect of bioanalytical research, as well as maximize the ability to produce information about multiple markers for any single run.
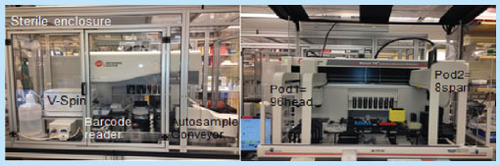
We implemented a robotic platform () that has allowed us to process batches of between 24 and 96 coded samples using automated methods that we have validated on the Biomek FXp [Citation24,Citation25]. We applied state of the art technology (custom Beckman-Coulter Biomek® robotic machine FXp) automation to minimize experimental variations. The Biomek® is a multiaxis liquid-handling instrument with an open architectural design and an extensible, flexible operating software that is in compliance with 21 CFR part 11 requirement for a closed system allowing to track back all the processes. The whole liquid handling operation is fully automated and operator hand-free. The left side of shows the Custom Biomek NXp under sterile enclosure for full automation procedures; the sample conveyor brings the tubes to the 8-span probes. The samples are aspirated from the tubes by the probes and distributed to barcoded 96 microtiter plates. The samples receive different treatments and are stained for markers, washed and transferred by a gripper to be centrifuged on the V-spin. This unit is used for cell preparation and culture. Right: The Biomek® FXp is a large unit with 26 positions for labware and devices, with two pods, an 8-span equipped with probes that accommodate disposable tips (either normal or liquid level sensing tips) and a gripper like the NXp. In addition it has also a second pod equipped with a 96 multichannel head that can operate on either 96- or 384-well plates. This Biomek® NXp also is customized by the addition of an orbital shaker to mix the reagents and with TEU devices designed specifically for antibody vials to help keep them in the dark at 4°C (or any required temperature between -15 and +100°C). This unit is used to prepare and aliquot the reagents and antibody into 96-well plates.
The combination of barcoding with high throughput has been shown to improve the standardization, accuracy, precision, flexibility and operational logistics for preparation of clinical samples. Several recent studies report use of barcodes for mass cytometry [Citation18–20,Citation26]. For CyTOF experiments, 20 samples were washed and counted using an automated counter (Guava). A total of 500,000 cells for each sample were incubated in a well of a 96-well microtiter plate with 50 μM of 195cisPt for 1 min to stain dead cells. After washing the cisPt the samples were fixed, washed and coded using the 20-plex barcoding kit (Fluidigm). The samples were washed three-times before pooling into one eppendorf tube. The 20 pooled samples were stained for surface markers, washed, permeabilized with saponin and stained for intracellular markers. After two more washes the pooled samples were incubated overnight with DNA intercalator 193 and 195Ir. The pooled samples were washed once with PBS, and once with water before injection into the CyTOF.
Considerations
Despite the fact that CyTOF is a promising and exciting approach for phenotypical and functional profiling of individual cells, and is capable of differentiating normal and diseased states, it still has several intrinsic limitations:
Recovery rates for most of the current protocols are limited to 50% of cells [Citation27]; much of this is due to the number of washing steps required. This issue is exacerbated when starting with cell quantities lower than 1 million [Citation27].
Matrix effects refers to the components of a sample other than the analyte of interest which may inhibit or suppress the formation of ions. In general, large concentrations of heavy elements will cause signal suppression through space charge effects. Matrix interferences can result in poor sensitivity and reproducibility for quantitative data. The most significant interference is the suppression ionization due to presence of readily ionized elements from the reagent and sample matrix.
There is a trade-off between resolution and sensitivity, lowering the resolution in order to increase the sensitivity can results false positives.
Space charge effects occur at the MS interface, producing ion suppression of the signal in high concentrations of a matrix element. With samples containing high levels of matrix elements, sensitivity is reduced by the presence of salts and oxides.
The matrix effects can be overcome by diluting the sample, using internal standard, optimizing the instrument or matrix separation. Since these components co-elute with the analyte of interest then data can become biased or have poor precision.
CyTOF has the ability to produce quantitation on multiple markers during a single run. However, each experimental system requires a good quality control sample to account for the system variations that can impact the outcome; the appropriate QC samples have not been established yet.
A large quantity of cells is required to achieve meaningful data; this can be a severe constraint when dealing with limited clinical samples. This may be due to the fact that CyTOF has a cell transmission rate of 30% when 0.5 million cells inject at 0.045 µl/min. This low recovery makes it a challenge to measure rare populations and may produce inaccurate quantitation results for those populations.
Flow cytometry can process about 80,000 events/s, while CyTOF can process about 1000 events/s. This results in drift of the signal intensity over time, which can increase bias when a large dataset is analyzed. Also, the latter can limit the throughput capacity of CyTOF.
The experiments carried out by CyTOF may be more costly than FACS methods but provide more complex and multidimensional datasets than are possible with FACS.
The current barcoding method necessitates cell fixation and permeabilization of the samples. However, a number of the surface markers (CCR6, CXCR3, CCR7, CD45RO, CD127, CD11b, CD56) do not perform well after barcoding. In our modified barcoding protocol, samples have to be stained for these fixation-sensitive markers prior to starting the barcoding procedure. Another solution, when possible, is to use antibodies that can recognize their epitopes after fixation.
There is a relative overlap between mass cytometry and flow cytometry but each has its own advantage. With FACS it is possible to measure, isolate and recover live cells, which is not possible using CyTOF.
Potential applications of barcoding in drug development
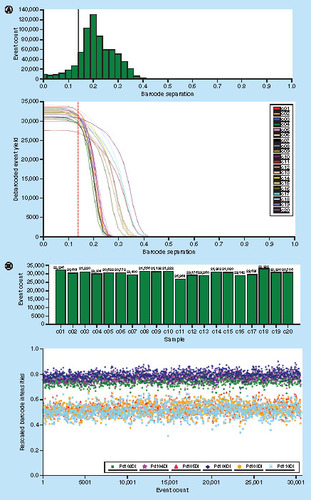
Barcoding has numerous potential applications in various stages of drug research such as drug screening, deep phenotyping, biomarker discovery and pharmacodynamic marker discovery. Use of automated debarcoding software allows faster and relatively unbiased deconvolution of the different barcoded samples. Barcoding samples and CyTOF are currently being used in longitudinal clinical investigations as is evidenced by a recent publication showing CyTOF analysis of circulating and tumor-infiltrating T cells from patients with glioblastoma treated with Nivolumab (PD-1-blocking antibodies). In this clinical study, 400 barcoded samples (in batches of 20 samples) were generated from circulating blood and tumor infiltrating lymphocytes of glioblastoma patients before and after Nivolumab treatment. The yield and separation of each barcoded sample was well defined and comparable among the 20 barcoded samples tested (A & B).
A shows the debarcoding and analysis of 20 samples. PBMC were collected from healthy volunteers. B shows the yield and separation of each of 20 barcoded samples after debarcoding. The ‘Event’ plot shows all cell events assigned to barcode. The upper panel represents the yield of each of the samples (as number of cells) after staining, washing, barcoding, debarcoding and eliminating of debris and doublets. The lower panel shows the barcode labels for all the individual cells in a sample and how well they are separated/clustered, for example: the combined red, blue, green was the barcode assigned to this sample; the other colors were assigned to other samples.
We have observed that debarcoding results improve with respect to both the yield and separation when the sample is cleaned (gating out debris and doublets according to DNA intercalator staining) before applying the debarcoding software. CyTOF analysis revealed that treatment shifts the profile of circulating regulatory T cells (Tregs) toward exhaustion of the phenotype reminiscent of that of tumor-infiltrating Tregs, further increasing inflammatory cytokine (IFN-γ) production.
Our MCB protocol
This protocol outlines the barcoding of 20 samples that has been adopted from prior work [Citation20] with some modifications. Each barcode sample consists of a unique combination of three palladuim isotopes. In this protocol, the 20 samples were transferred into two rows of 10 on a V bottom 96-well plate. The surface markers were incubated before barcoding for 30 min, fixed and permeabilized. Once each sample is barcoded with a unique combination of three palladuim isotopes, the different samples are mixed together and the analytes/targets of interest are stained for the intracellular markers. After the combined sample is acquired on the CyTOF, the individual samples are deconvoluted, or unmixed, during software analysis based on their barcoding signatures.
Discriminating and excluding dead cells decreases unspecific binding of antibodies to the cells and provides better data. Many viability dyes such as propidium iodide are currently used in flow cytometry. There was a lack of such products for CyTOF until 2 years ago when cisplatin (195Pt) was adopted to stain dead cells for CyTOF. However, some considerations should be taken while using cisplatin in the protocol; as using suboptimal concentrations introduces false live cells to the analysis. The best results are achieved in experimental conditions, when the cells are incubated for a very short time (1 min) with cisplatin at 50 μM which gives comparable results to viability measurements by flow cytometry after staining with propidium iodide. Cell degradation and/or death occur at higher concentrations or longer incubation times. Additionally, we have observed that incubation times between 12 and 24 h work well with iridium-intercalator, which is used as both a discriminator for debris and doublets in CyTOF.
Critical parameters
The order of steps of the protocol is important: some markers (e.g., CXCR3, CCR4, CXCR5, CCR6, CCR7, CD45RO, CD127) should be labeled before barcoding otherwise they may be damaged during the preparation.
Washing steps are important to minimize cross-talk between barcoding and to remove the potential interfering elements
Upon addition of barcoding, the samples must be thoroughly mixed; it is advised to pipette up and down several times to ensure complete sample mixing. Incomplete mixing is manifested by populations that have irregular shapes and broader distributions
The result of debarcoding is improved for both the yield and the separation when the sample is cleaned (gating out debris and doublets according to DNA intercalators staining) before applying the debarcoding software.
Conclusion
Manual sample preparation has shown to be inconsistent and time consuming, and as it is a critical step in the barcoding workflow, represented a major bottleneck. Automated sample preparation methods are very useful in that they are performed the same way every time, reduce reagent use, and improve the standardization, accuracy and operational logistics for preparation of clinical samples. Also, this review assessed the progress made so far in the fields of single cell barcoding. The development of barcoding technologies plays an important role in accelerating advances in diagnostics and treatment of a wide range of diseases. Barcode-based bioassays for CyTOF, with the ability to encode and decode, should facilitate progress toward this goal. Multiplexing samples improves data quality because the 20 samples are stained, processed and acquired as one sample, eliminating sample-specific staining and data collection variation. Another interesting aspect to CyTOF, is the combination of high throughput and barcoding in sample preparation.
Future perspective
Although mass cytometry has great potential, it also presents great challenges and limitations. Much of the current work is exploratory in nature. By the nature of the science, factors such as biological, instrument and sample preparation variations lead to inconsistency in multiplexed assays. Multiple factors, including sample preparation, instrument conditions or operation environment, contribute to the variability of mass cytometry data. These factors are important sources of error which can produce both false positives and false negatives in the data, as well as changes in intensity values and drift of m/z values. To evaluate the bioanalytical variability of mass cytometry, it is important that QC samples are repeatedly analyzed throughout the entire experiment. A major known issue in mass cytometry is that there are fluctuations in the detector response, usually seen as a decline over time.
We propose in the future to use specific cell lines such as Jurkat cells, Raji cells and U937 cells to standardize and quantitatively measure, respectively, CD4 T cells, B cells and monocytes. These cell lines are commercially available (ATCC) and easy to culture in order to produce billion cell banks. After obtaining a sufficient number of cells, we will label them for a single marker (i.e., CD3, CD4, CD19, CD14) tagged with one metal (i.e., Nd145) or with multiple tags on the same marker (Nd, Sm, Er, Gd, Yb). The tagged cell lines will be fixed, washed, counted and resuspended at 10 million/ml in PBS, 1% BSA and 10% DMSO, then frozen in a 100 μl/vial. These could be stored for 1 year at -80°C and reconstituted just before use in 1 ml of PBS. Before injecting, each sample will be mixed with 20 μl of the standard cell line (20,000 cells). After data collection and analysis we will be able to calculate exactly the number of cells that were injected using the coefficient of the standard cell line recovery. The same cell lines will allow results normalization for the different injections since they should have the same signal strength and same number.
Until now standardization beads have been used to normalize different injections of samples and to correct for the loss of signal strength. However, these polystyrene beads do not behave like cells and hence cannot allow an accurate normalization. They are not used at all for quantitative analysis of any particular cell type. By replacing such beads with actual cells, data accurately represent the true nature of the sample.
Acknowledgements
The authors would like to thank R Montgomery and S Kreshnaswamy for their valuable discussions.
Financial & competing interests disclosure
The authors have no relevant affiliations or financial involvement with any organization or entity with a financial interest in or financial conflict with the subject matter or materials discussed in the manuscript. This includes employment, consultancies, honoraria, stock ownership or options, expert testimony, grants or patents received or pending, or royalties.
No writing assistance was utilized in the production of this manuscript.
References
- Bendall SC , SimondsEF, QiuPet al. Single-cell mass cytometry of differential immune and drug responses across a human hematopoietic continuum. Science332 (6030), 687–696 (2011).
- Bandura DR , BaranovVI, OrnatskyOIet al. Mass cytometry: technique for real time single cell multitarget immunoassay based on inductively coupled plasma time-of-flight mass spectrometry. Anal. Chem. 81 (16), 6813–6822 (2009).
- Cheung RK , UtzPJ. Screening: CyTOF-the next generation of cell detection. Nat. Rev. Rheumatol. 7 (9), 502–503 (2011).
- Raj A , van den BogaardP, RifkinSAet al. Imaging individual mRNA molecules using multiple singly labeled probes. Nat. Methods5, 877–879 (2008).
- Cosma A , Le GrandR. Brief introduction to mass cytometry. Med. Sci. (Paris)27 (12), 1072–1074 (2011).
- Doerr A . A flow cytometry revolution. Nat. Methods8 (7), 531 (2011).
- Janes MR , RommelC. Next-generation flow cytometry. Nat. Biotechnol. 29 (7), 602–604 (2011).
- Giesen C , WangHA, SchapiroDet al. Highly multiplexed imaging of tumor tissues with subcellular resolution by mass cytometry. Nat. Methods4, 417–422 (2014).
- Saadatpour A , GuoG, OrkinSHet al. Characterizing heterogeneity in leukemic cells using single-cell gene expression analysis. Genome Biol. 15 (12), 525 (2014).
- Piccirillo S , ColmanS, PotterNEet al. Genetic and functional diversity of propagating cells in glioblastoma. Stem Cell Rep. 4 (1), 7–15 (2015).
- Fu J , StoneNR, LiuLet al. Direct reprogramming of human fibroblasts toward a cardiomyocyte-like state. Stem Cell Rep. 1 (3), 235–247 (2013).
- Krishnaswamy S , SpitzerMH, MingueneauMet al. System Biology. Conditional density-based analysis of T cell signaling in single-cell data. Science346 (6,213), 1250689 (2014).
- Victor M , RichnerM, HermanstyneTOet al. Generation of human striatal neurons by microRNA-dependent direct conversion of fibroblasts. Neuron84 (2), 311–323 (2014).
- Saliba AE , WestermannAJ, GorskiSAet al. Single-cell RNA-seq: advances and future challenges. Nucleic Acids Res. 42 (14), 8, 845–860 (2014).
- Krutzik PO , NolanGP. Fluorescent cell barcoding in flow cytometry allows high-throughput drug screening and signaling profiling. Nat. Methods3 (5), 361–368 (2006).
- Krutzik PO , ClutterMR, TrejoA, NolanGP. Fluorescent cell barcoding for multiplex flow cytometry. Curr. Protoc. Cytom. 6, Unit 6.31 (2011).
- Bodenmiller B , ZunderER, FinckRet al. Multiplexed mass cytometry profiling of cellular states perturbed by small-molecule regulators. Nat. Biotechnol. 30 (9), 858–867 (2012).
- Lai L , OngR, LiJ, AlbaniS. A CD45-based barcoding approach to multiplex mass-cytometry (CyTOF). Cytometry A87 (4), 369–374 (2015).
- Mei HE , LeipoldMD, SchulzAR. Barcoding of live human peripheral blood mononuclear cells for multiplexed mass cytometry. J. Immunol. 194 (4), 2022–2031 (2015).
- Zunder ER , FinckR, BehbehaniGKet al. Palladium-based mass tag cell barcoding with a doublet-filtering scheme and single-cell deconvolution algorithm. Nat. Protoc. 10 (2), 316–333 (2015).
- Nassar AF , OguraH, WisnewskiAV. Impact of recent innovations in the use of mass cytometry in support of drug development. Drug Discov. Today20 (10), 1169–1175 (2015).
- Jemal M . High-throughput quantitative bioanalysis by LC/MS/MS. Biomed. Chromatogr. 14 (6), 422–429 (2000).
- Nassar AE , TalaatRE, KamelAM. The impact of recent innovations in the use of liquid chromatography-mass spectrometry in support of drug metabolism studies: are we all the way there yet?Curr. Opin. Drug Discov. Devel. 9 (1), 61–74 (2006).
- Qian F , GoelG, MengH, WangX, YouF. Systems immunology reveals markers of susceptibility to West Nile virus infection. Clin. Vaccine Immunol. 22 (1), 6–16 (2015).
- Mohanty S , JoshiSR, UedaI, WilsonJ, BlevinsTP. Prolonged proinflammatory cytokine production in monocytes modulated by interleukin 10 after influenza vaccination in older adults. J. Infect. Dis. 211 (7), 1174–1184 (2015).
- Majonis D , OrnatskyO, KinachR, WinnikMA. Curious results with palladium- and platinum-carrying polymers in mass cytometry bioassays and an unexpected application as a dead cell stain. Biomacromolecules12 (11), 3997–4010 (2011).
- Nassar AE , CarterB, LanniganJet al. The first multi-center comparative study using a novel technology mass cytometry time-of-flight mass spectrometer (CyTOF2) for high-speed acquisition of highly multi-parametric single cell data: a status report. Presented at : CYTO 2015 30th Congress of the International Society for Advancement of Cytometry. Scottish Exhibition and Conference Centre Glasgow, UK, 26–30 June 2015.