
Abstract
Aim: Although regulatory guidances require human metabolism information of drug candidates early in the development process, the human mass balance study (or hADME study), is performed relatively late. hADME studies typically involve the administration of a 14C-radiolabelled drug where biological samples are measured by conventional scintillation counting analysis. Another approach is the administration of therapeutic doses containing a 14C-microtracer followed by accelerator mass spectrometry (AMS) analysis, enabling hADME studies completion much earlier. Consequently, there is an opportunity to change the current drug development paradigm. Materials & methods: To evaluate the applicability of the MICADAS–cAMS method, we successfully performed: the validation of MICADAS–cAMS for radioactivity quantification in biomatrices and, a rat ADME study, where the conventional methodology was assessed against a microtracer MICADAS–cAMS approach. Results & discussion: Combustion AMS (cAMS) technology is applicable to microtracer studies. A favorable opinion from EMA to complete the hADME in a Phase I setting was received, opening the possibilities to change drug development.
In the scope of drug development, regulatory guidances encourage the early identification of relevant human metabolites [Citation1–3]. A human ADME study that used radiolabeled drugs allows the identification of metabolites and the elucidation of key biotransformation pathways and clearance mechanisms in humans. However, due to the high study cost, the needs for a dosimetry assessment (which include a rat distribution investigation) and for a GMP manufacturing as well as the high attrition rates encountered in drug development, the conventional hADME is generally performed late in drug development (Phase II, see Supplementary Figure 1). The administered dose in a conventional hADME study can contain up to 3.7 mBq of radioactivity which is analysed by scintillation counting. To address the regulatory demands earlier, a first investigation of pharmacokinetics (PK) and excretion routes is typically performed with a radiolabeled drug in rodents. Subsequently, exploratory analysis of potentially relevant metabolites is investigated in early clinical samples (Phase I) without the use of radiolabel [Citation4,Citation5] (Supplementary Figure 1). However, the applied LC–MS methods can fail to identify unknown metabolites. If human-specific metabolites are generated in early clinical samples, these metabolites will not be detected in preclinical species using radiolabeled drug, and will not be discovered in humans until the radiolabeled human mass balance ADME study is completed. To address this gap, we propose to dose a normal, therapeutically relevant dose spiked with very low amounts of a radiotracer to healthy volunteers or patients in a Phase I setting. Thereafter, the mass balance, the excretion routes and levels of circulating metabolites in humans are determined by accelerator mass spectrometry (AMS) as suggested by Lappin and Garner [Citation6,Citation7].
AMS is a highly sensitive method for the detection of radioactive 14C, and this technology allows human clinical studies to be performed at radiochemical exposures that do not differ substantially from the natural background of radioactivity [Citation8,Citation9]. In general, AMS using graphitization of sample carbon (gAMS) has been accepted by health authorities as a method to provide data for human ADME studies [Citation10,Citation11]. In a previous white paper, the application of gAMS for the measurement of parent compound and/or metabolites circulating in plasma was described [Citation12]. However, the conversion of sample carbon to graphite makes gAMS slow, resource demanding and expensive and, therefore, is unsuitable for the analysis of large numbers of samples in an early clinical setting. The development of combustion AMS (cAMS) for microgram level samples [Citation13] has made the AMS technology more applicable to ADME studies. For instance, the analyte of interest in cAMS is converted to gaseous CO2 and directly measured. This direct measurement significantly simplifies the sample preparation for cAMS and greatly increases the sample throughput [Citation14,Citation15]. Futhermore, large, expensive and resource-demanding high-voltage AMS systems have been miniaturized and simplified substantially. Recent technology improvements such as the MIni CArbon DAting System (MICADAS) have led to low-voltage cAMS instruments with a small footprint and reduced costs compared with standard AMS systems [Citation16,Citation17].
Even though the transition to smaller AMS instruments positively affects the affordability and practicality, these newly developed systems have only been tested for their biomedical applicability using graphitization AMS (gAMS) [Citation18,Citation19]. However, the potential of the method could not be reached due to limitations of the graphitization process. This process is slow and also requires significant amounts of carrier carbon addition (on the order of hundreds of micrograms) to allow for sample handling. In the present study, we evaluate the direct measurement of sample CO2 (cAMS) combined with MICADAS (MICADAS–cAMS) for ADME studies. Whenever possible, our investigations follow previous recommendations [Citation8,Citation12,Citation20] on critical bioanalysis parameters needed to perform adequate radioactivity quantification in the scope of an ADME study.
In ADME studies using conventional radiotracer and analytical methods the biomatrices (blood/plasma, urine and feces) are usually analyzed directly for radioactivity to determine the entirety of the drug-related material. From the total radioactive dose and the total radioactivity in urine and feces (at specified time intervals), the mass balance can be derived. Metabolic profiles are generated by sample preparation and chromatographic separation of the different drug-related components. The microtracer approach using MICADAS–cAMS analytical methods can be applied to ADME studies in the same way: direct cAMS analyzes of total 14C (direct cAMS), which involves very limited sample preparation, that is, preparing the sample for combustion. Indirect cAMS analyzes of specific 14C-related components in a variety of matrices following methods of extraction, chromatographic separation and isolation (indirect AMS).
In order to validate the MICADAS–cAMS technology for use in ADME studies with 14C as a radiotracer, the dynamic range, sensitivity, accuracy and precision of MICADAS–cAMS were evaluated by spiking biomatrices with a labeled test compound (LDE225, Sonidegib). This compound has been previously used successfully in gAMS investigations [Citation10].
To demonstrate the applicability for ADME studies with MICADAS–cAMS, a head-to-head comparison of both the conventional and MICADAS–cAMS methodology was performed in a rat ADME study of CDZ173 (Leniolisib). CDZ173 is an inhibitor of phosphoinositide 3-kinase delta (PI3Kδ) which is currently in clinical development for autoimmune diseases. The study contained two arms: a conventional radiotracer with classical radiodetection (liquid scintillation counting [LSC] and TopCount) and, a microtracer with AMS mass spectrometric atom-counting in combination with high sensitivity radiodetection (MICADAS–cAMS in combination with low level liquid scintillation counting [LLLSC]).
Materials & methods
Chemicals & sample preparation
Chemicals
Ammonium formate, formic acid, sodium benzoate and phthalic anhydride of the highest grade were purchased from Sigma-Aldrich (Steinheim, Germany). Water, acetonitrile and methanol were of the highest grade available and were obtained from Thermo Fisher Scientific (Loughborough, UK). Acetanilide was acquired from Merck (Darmstadt, Germany).
Biomatrices linear dilution sample preparation
Four biomatrices (blood, plasma, urine and feces homogenate [containing 1% carboxymethylcellulose]) were spiked with a known amount of [14C]-LDE225. This amount was initially determined in each matrix by LLLSC. Subsequently, a linear dilution (weight/weight (w/w)) with biomatrix was applied to stay well within the MICADAS–cAMS dynamic range and below the activities tolerable for a natural abundance laboratory (samples typically corresponding to 0.5–1000 mBq/g). The total 14C content was determined through direct analysis by MICADAS–cAMS. Quantification of the test compound over the dynamic range was performed in triplicate (15 μl aliquots of biomatrix).
In vivo ADME sample preparation
[14C]-CDZ173 was synthesized by the isotope laboratory of Novartis, Basel, Switzerland, and purified by Pharmaron, Cardiff, UK. [14C]-CDZ173 was diluted with unlabeled CDZ173 to achieve the desired specific activities for the conventional and microtracer studies.
Animal dosing
The animal studies were approved by Animal Care and Use Committees of the Kanton Basel, Switzerland. Hannover Wistar rats (Charles River France, 299–326 g, 8–10 weeks) received an oral dose (p.o.) of 10 mg/kg [14C]CDZ173 solution containing 0.5% (w/w) methylcellulose and 0.5% (w/w) Tween-80 as vehicle. The radioactive doses were 20.8 MBq/kg and 564 Bq/kg (mean) across the three rats of the conventional (Group 1) and the three rats of the micro radiotracer (Group 2) studies, respectively (Supplementary Table 1). After dosing, blood was collected sublingually in anesthetized rats at 0.25, 0.5, 1, 4, 8, 24 and 48 h postdose. From each time-point, blood was processed immediately to plasma by centrifugation at 3000 × g for 10 min at 4°C. For Group 1, a small aliquot was taken for total radioactivity detection and the remainder material was stored at -80°C until further analysis. For Group 2, all material was stored at -80°C until further analysis.
Animals were housed in metabolic cages for urine and feces collection. Urine and feces were collected quantitatively from 0- to 48-h time-interval postdose. Feces were directly homogenized after addition of a 1% aqueous carboxymethylcellulose solution (about ten-times of the feces weight).
Preparation of a plasma pool
Individual time-points per rat were measured by LSC for total 14C determination in plasma of the conventional study, and then identical volumes were pooled per collection time-point for metabolite profiling by microplate scintillation counting via TopCount. For the microtracer arm, identical plasma volumes were pooled per collection time point, and total 14C content as well as metabolite profiling were determined by MICADAS–cAMS.
Preparation of a urine pool
Urine samples between 0 and 48 h were pooled across the three animals of the same dosing group by combining identical percentage (by weight) of individual urine fractions. Samples from the conventional arm were assayed by microplate scintillation counting via TopCount for metabolite profiling, whereas samples from the microtracer group were measured by MICADAS–cAMS.
Preparation of a feces pool
Feces homogenates were pooled over 0–48-h time interval of the three animals of the same dosing group. The pools were prepared by combining identical percentages of the amounts of the individual feces homogenates. Radioactivities were measured using the same approach as for urine pools.
Sample preparation of matrices for metabolite profiling
A subfraction from the above plasma and feces pools were prepared by protein precipitation/extraction with acetonitrile (fourfold volume addition). Following vortexing, sonication and centrifugation, the supernatant was collected and the resulting pellet was extracted two more times with a mixture of water/acetonitrile/methanol (4/4/2, v/v/v) and acetonitrile. All supernatants were combined and concentrated under a stream of nitrogen. The residues were reconstituted with a mixture of water/acetonitrile (9/1, v/v). Urine pools were prepared by vortex and centrifugation. An aliquot of the reconstituted samples was injected for metabolite profiling.
Analytical methods
Ultra-performance liquid chromatography & metabolite profiling
Ultra-performance liquid chromatography (UHPLC) was performed on an Acquity chromatographic system (Waters, MA, USA) using a HSS T3 column (2.1 × 150 mm, 1.8 μm particles; Waters), protected with a precolumn (2.1 × 5 mm) of the same stationary phase. The precolumn and column temperatures were set at 50°C. The components were eluted with a gradient of mobile phase A (10 mM ammonium formate, pH 3 [adjusted with formic acid]) versus mobile phase B (acetonitrile). Mobile phase B was initially set up at 2% for the first 2 min, increased to 12% at 2.1 min, to 30% at 20 min and to 98% at 24 min, then maintained at this level until 25.5 min. The total flow rate was 0.5 ml/min. The column effluent was collected in 6 s fractions with a GX271 fraction collector (Gilson AG, Mettmenstetten, Switzerland) for metabolite profiling. UHPLC instrumentations were managed under UNIFI™ (Waters, version 1.8).
Metabolite structure characterization
Metabolite structures were characterized by UHPLC combined with mass spectrometry analysis of the remaining aliquots prepared for metabolite profiling purpose, with the same UHPLC instrumentation coupled with a Xevo QtoF (accurate-mass quadrupole time-of-flight) (Waters) conducted under UNIFI™ (version 1.8). After the TUV (tunable, dual-wavelength ultraviolet/visible) detection (set at 254 nm) the collumn effluent was split in ∼1:5 ratio. Only the minor portion was directed into the electrospray interface of the mass spectrometer (operated in positive ion mode). The major portion was directed to the waste. Argon was used for collisional activation. A solution of leucine enkephalin was infused though the LockSpray™ interface to generate a lock-mass throughout the analysis and obtain accurate mass spectrometry data.
Nomenclature & assignment of the metabolites
Metabolites with an assigned structure based on full chromatographic and MS/MS data were labeled with an ‘M’ number, for example M1. Metabolites with limited structural information were named as Px (where x represents the approximate retention time).
Set-up for metabolite identification & profiling
A two-injections strategy, which was successfully applied in previous AMS studies [Citation10], was performed. The configuration is illustrated in Supplementary Figure 2. First, one small aliquot (15 μl) is injected on UHPLC instrumentation, and fractions are collected in 96-well plates, containing solid scintillator (LumaPlate 96 deepwell plate, PerkinElmer; Group 1), or precleaned tin cups (tin capsules for solids or liquids, PerkinElmer; Group 2). The 96-well plates content was assayed by TopCount (PerkinElmer, WA, USA) or measured on a MICADAS instrument at ETH Zurich (Ionplus AG, Switzerland) for Group 1 and Group 2, respectively. Sodium benzoate (a nonvolatile salt) was used as a carbon carrier in MICADAS–cAMS measurements. A solution of the benzoate carrier was manually pipetted in tin cups and dried prior to the fraction collection. After the first injection, a second aliquot (larger volume, up to 150 μl) is injected on the UHPLC system coupled directly to high resolution mass spectrometer for metabolite identification. With the help of the reconstructed radiochromatogram profiles generated by MICADAS–cAMS or TopCount, the metabolite masses under the relevant peaks were identified.
Quantification strategy
Radioactivity in the different matrices was quantified by MICADAS–cAMS, LLLSC or LSC. Total activities in plasma, urine and feces were measured by the appropriate quantification technology based on sensitivity and dynamic range. Radioactivity determinations from the conventional study (plasma, urine, feces and carcass) and in other samples (dose formulation, cage wash) were measured by LSC. The 14C content in biological samples of the microtracer study was determined by MICADAS–cAMS technology (plasma, urine) or LLLSC (urine, feces and dose formulation). All sample preparation techniques (e.g., homogenization, quenching etc.) followed the guidelines from Swart et al. ([Citation21] and its supplemental data). All determinations of radioactivity were conducted in weighed samples, and volumes were adjusted according to the analytical technique used (e.g., ∼0.1 g for LSC and ∼0.015 g for cAMS). Measurement of radioactivity for plasma was converted into concentrations (mol equivalents per volume or gram) considering the specific radioactivity and assuming a matrix density of 1 g/ml.
MICADAS–cAMS setup
All low-level 14C measurements were performed on a MICADAS–cAMS setup at the Laboratory of Ion Beam Physics at ETH Zurich, Switzerland (Supplementary Figure 3). In this setup, all the processes are software-controlled and fully automated. An elemental analyzer (EA, Elementar, Germany) with a sample-feeding wheel for 80 samples was used as a combustion unit for samples wrapped in cylindrical tin capsules (Elementar). The gases arising from the samples combustion were separated thermochromatographically into N2, CO2 and H2O and quantified by means of a thermal conductivity detector downstream from the thermochromatography column. The sample gases are then handled with a dedicated gas interface system (GIS, Ionplus AG, Switzerland, Supplementary Figures 3 & 4), allowing to trap the CO2 peak using a molecular sieve and to regulate its injection into the ion source of MICADAS to ensure a constant carbon mass flow. The hybrid ion source of MICADAS allows both measurements of graphitized and gaseous CO2 samples and is equipped with a random-access sample changer for 40 cathodes [Citation16]. A dynamic range of more than four orders of magnitude can be reached with this setup and the current technology.
MICADAS–cAMS analysis
Linear biomatrices studies were performed in short measurement campaigns of only a few days, whereas ADME measurements were performed on 15 workdays over a period of 3 weeks (Supplementary Figure 5). Most samples were measured with a counting time of 5 min and a total sample-to-sample time of just under 8 min. In addition to samples, AMS standards (oxalic acid 2, NIST SRM 4990C, OX-2) and background (fossil, radiocarbon-free, phthalic anhydride, Sigma-Aldrich, Germany) samples, were measured regularly to ensure stable measurement conditions and for quality control. Furthermore, solid acetanilide (K37102211, Merck, Germany) was used for carbon mass calibration of the elemental analyzer as precise mass determination was necessary for precise determination of the sample activity.
The MICADAS–cAMS measurement was run in daily batches of ca. 80–140 samples, for a total of 1755 samples (1608 samples, 74 background/acetanilide and 73 standard samples) measured within 15 consecutive workdays (Supplementary Figure 5). A quick retuning of the AMS instrument and the analysis of two standards and two background samples, for quality control, normalization and blank subtraction, were performed at the beginning of each measurement's day. In parallel, the adsorption trap was cleaned with a series of combustions without samples.
Data analysis
Biomatrices linear dilution analysis
Standard deviation (SD) and relative deviation (RD, %) from the measurements were calculated as well as the deviation (D,%) between the known amount (calculated from the linear dilution [w/w]) and the cAMS quantification (mean of quantified aliquots). The validation criteria in target matrix (performed only in triplicate in this study) were following the recommendation of the European Bioanalysis Forum [Citation12], whenever possible, and applied to determine the dynamic range, limit of detection [LOD] and lower limit of quantification [LLOQ] in biomatrices.
Data analysis for AMS
AMS data were evaluated according to standard procedures and conventions with the BATS software [Citation22]. Unlike the conventional radiometric methods, AMS does not measure radioactivity in samples but rather the isotopic ratios (12C/14C) on a fraction of the sample carbon. Therefore, not only the sample mass and its activity have to be known for activity determination, but rather the sample mass, the carbon mass of that sample and its isotopic ratio. In the present study, the sample mass for AMS analysis of biomatrices was typically set to ∼15 mg and carbon amounts were determined by the EA. For HPLC eluates, carrier carbon on the order of 40 μg C was added to fractions as dilution for 14C and for sample handling and quantification. In this case, only the isotopic ratio and the carbon addition had to be quantified.
ADME analysis
Mass balance calculations
The mean cumulative excretion of radioactivity was calculated from the sum of the individual percentages of dose excreted during the 24-h collection intervals in urine and feces.
PK analysis
PK parameters of total radioactivity in plasma were analyzed using BioBook IDBS electronic notebook (template version 10.0.1 created for Novartis). The AUClast were calculated using the linear trapezoidal rule. For metabolite profiles, the peaks in the radiochromatograms were integrated using the RadioStar software (version 5.0) from Berthold Technologies (Bad Wildbad, Germany). Relative peak areas, and concentrations of individual radiolabeled components in plasma and the amounts of individual radiolabeled components in excreta were calculated from the total 14C-labeled components in the respective original sample pools. Absorption, expressed as a percentage of dose, was determined based on radioactivity in urine and feces.
Results & discussion
Instrument qualification for direct MICADAS–cAMS analysis
Summary of MICADAS–cAMS studies, LOD & LLOQ
A total of 19 blood, 23 plasma, 27 urine and 22 feces samples were analyzed over a dynamic range from ∼0.5 to ∼1000 mBq/g. In general, SD and RD across triplicate measurements of the same concentration, as well as D were excellent. In blood, plasma, urine and feces the averaged RD and D values were all under 15% (Supplementary Tables 2–5). Linearity, reproducibility and accuracy were demonstrated within a dynamic range in all matrices. Although the analyses were performed only in triplicate, the results were in accordance with required bioanalysis criteria for ADME studies (RD: ± 20% within dynamic range, ± 25% at LLOQ, [Citation12]). The observed LLOQ (∼1, 0.5, ∼5 and ∼10 mBq/g for blood, plasma, urine and feces, respectively) were in line with the needs of microtracer ADME studies and with LLOQ from other cAMS instruments (Supplementary Table 6). It should be noted here, that the LLOQ in the current AMS study as well as in similar AMS studies is predominantly limited by sample preparation (due to the partial contamination of samples from higher activity sources (e.g., throughout the sample preparation, administration, collection, storage etc.) and the resulting variability of background samples rather than the sample combustion or measurement by cAMS. The background of the MICADAS–cAMS method determined during the present ADME study (n = 62) corresponded to 0.014 mBq/g in a 15 mg aliquot with a background variation of ca. 0.008 mBq/g. These samples had not been processed along with the other samples at Novartis but through pipetting of aliquots at ETH Zurich. With this background, an LLOQ (background value + 10 × background variation) on the order of 0.1 mBq/g should be achievable by the MICADAS–cAMS technology. This corresponds to an LOD of 0.04 mBq/g (background value + 3 × background variation). However, a prestudy analysis with 14C-free sodium benzoate from Novartis (which was also used in the ADME study as carrier carbon) revealed that the LLOQ was dominated by the variability of contamination with 14C during sample preparation and corresponded to ∼1.5 mBq/g (background of ∼0.16 mBq/g with a variability of ∼0.13 mBq/g). A large variation of values such as the ones observed for the lowest concentrations in Supplementary Table 4 is, therefore, also likely caused by the large variability coming from the sample preparation (e.g., after centrifugation, drying, handling with tweezers etc.) rather than cAMS measurements directly. We therefore think that the somewhat elevated LLOQs found in urine and feces are a consequence of either potential contamination with extraneous 14C and/or homogeneity issues in the case of feces. The overall cross-talk or carry-over of samples processed with the MICADAS–cAMS method has been determined to 0.5–1% of the activity of the previous sample. In the analysis of chromatograms, this cross-talk is usually masked by the broadness of chromatographic peaks which is not sharp to a single fraction but usually spans two or more fractions.
ULOQ & dynamic range
The cAMS upper LOQ (ULOQ) depends on the carbon content of the sample. It is on the order of 400 mBq/g for a 15 mg urine sample with a low carbon content of 0.4% or 4 Bq/g for a 15 mg plasma sample with 4% carbon content when no carbon dilution is used. Hence, the theoretical dynamic range of the MICADAS–cAMS instrumentation spans 4 or more orders of magnitude from LLOQ to ULOQ. Addition of diluting carbon at the final step of the sample preparation can extend the ULOQ even further as the ULOQ is mainly given by the highest 14C/12C ratio that can be measured in AMS (i.e., the highest count rate). In order to avoid any influence of the diluting carbon on the sample preparation, this carbon is introduced at the last step of the sample preparation for a cAMS measurement, which is just before drying down the collected sample for combustion or even as a separate tin capsule added during combustion in the elemental analyzer. The mentioned ULOQ values between 400 mBq/g and 4 Bq/g are well within the dynamic range of LLLSC as demonstrated by Swart et al. [Citation21]. Another technique, which could be considered, is to dilute samples higher than the ULOQ with blank matrices. However, a dilution of samples could introduce the risk of analytes (e.g., drug) adsorbing to surfaces or precipitating during the dilution steps. The linear overlap of the dynamic ranges of cAMS with those of less sensitive radioactivity quantification technologies, namely LSC and LLLSC, allow measurement of samples using a combination of the different technologies based on the absolute radioactivity content as these technologies have been determined to give identical results within their respective dynamic ranges [Citation21].
Head to head comparison of conventional & microtracer methodologies in the scope of a rat ADME
Although a 40,000-fold lower radioactivity was used in the microtracer arm (Group 2) than in the conventional study (Group 1), similar results were obtained from the MICADAS–cAMS quantification (Group 2) and LSC quantification (Group 1), providing evidence for the utility of MICADAS–cAMS for ADME studies.
PK of radioactivity
The plasma samples of Group 2 were directly measured by MICADAS–cAMS without an LLLSC precheck as 14C-compound concentrations were expected to be within the dynamic range of MICADAS–cAMS and the restrictions of the natural abundance 14C laboratory at ETH Zurich. The concentrations of total radiolabeled components in plasma were measureable up to 48 h after administrations in both Group 1 and 2 (Supplementary Tables 7 & 8). The MICADAS–cAMS data in plasma are listed in Supplementary Table 8. The precision was good with the relative deviation of <10.5% for all triplicate measurements. All amounts were above the predetermined MICADAS–cAMS LLOQ in plasma (Supplementary Table 3). The derived PK data of both arms are listed in . The concentration-time curves plots are depicted in and Supplementary Figure 6.
![Figure 1. Pharmacokinetic plots (logarithmic scale) of total radioactivity in plasma after dosing [14C]CDZ173 to rats with conventional radiolabeled dose (Group 1) and microtrace dose (Group 2).](/cms/asset/b9b38ad2-845e-4669-b6c5-5ef05f926e31/ibio_a_12352155_f0001.jpg)
Following administration of a single dose of 14C-CDZ173 (Leniolisib) in rats, the median Tmax (time to reach the maximum concentration) and Cmax (maximum concentration) values of radioactivity in plasma were similar (Tmax: 0.25 h for both groups, Cmax: 5.02 and 5.33 μM for Group 1 and Group 2, respectively).
For both groups, the initial half-lives were similar with 3.1 and 3.8 h for Groups 1 and 2, respectively, but a difference was observed for the terminal half-lives, which were 11 (Group 1) and 28 h (Group 2), respectively. The concentrations measured in Group 2 by MICADAS–cAMS technology were slightly higher than the concentrations measured in Group 1 by LSC, especially for the later time points. The reason for this observation is not clear at this point and it may be due to the low-level contamination in sample preparation as mentioned in the ‘Instrument qualification for direct MICADAS–cAMS analysis’ section. Once these sample preparation issues have been addressed, MICADAS–cAMS quantification at the later time points might be more accurate due to the superior sensitivity (atom counting 14C) for AMS versus decay counting for liquid scintillation technologies [Citation20,Citation23] and better precision of MICADAS–cAMS over LSC [Citation24]. This would lead to a better estimation of the terminal half-life of the compound in the Group 2 ().
The RD comparison across the intraindividual triplicate measurements from Group 1 (by LSC, Supplementary Table 7) and Group 2 (by MICADAS–cAMS, Supplementary Tables 8 & 9) also emphasize the better precision of MICADAS–cAMS technology versus LSC. The AUClast between the groups also differed and were calculated to be 23.1 μM·h and 47.7 μM·h (Groups 1 & 2). The difference between the groups is in line with a previous study, in which ca. twofold variability in AUClast values was observed between two groups of rats housed in different cages, despite low intraindividual variability within each group.
Mass balance of radioactivity
To stay within 14C activities of the ULOQ of MICADAS–cAMS and due to the limitations imposed by the restrictions of a natural abundance laboratory, urine and feces were initially measured by LLLSC, followed by repeat measurement of urine by MICADAS–cAMS when concentrations were within the required range.
Supplementary Tables 10 and 11 show the CDZ173 (Leniolisib) radioactivity values recovered in urine from LLLSC and MICADAS–cAMS data, respectively. The measured concentrations in the 0–24-h time interval were in the dynamic range of quantification by both LLLSC and cAMS (∼875 mBq/g urine), and values obtained with both methods were comparable (Supplementary Tables 10 & 11). For the 24–48-h aliquots, LLLSC measurements (Supplementary Table 10) gave a high relative deviation and the values were below the LLOQ of LLLSC according to Swart et al. [Citation21]. The MICADAS–cAMS relative deviation for these samples was <9% across all measurements (Supplementary Table 11), and therefore only cAMS data were considered for final assessment.
In feces (Supplementary Table 12), the radioactivity values measured by LLLSC were acceptable and above the defined LLOQ for LLLSC of 100 dpm/g [Citation21], and were therefore not reassessed by cAMS in order to avoid potential contamination of the instrument. The relative deviation from LLLSC measurements was acceptable for nearly all collected intervals. Only for the 24–48-h sample interval, the LLLSC value was calculated to be slightly high at 21.7%. However, the preparation of feces did not result in sufficient homogenization which could contribute to the observed high relative deviation.
The quantitative excretion profiles of both groups are shown in , and are very similar. Within 48 h after oral administration of Group 1, 5% of the administered radioactivity was excreted in urine and 90% in feces () with the major portion rapidly excreted within 24 h. In Group 2 (), the urinary and fecal excretion amounted to 6 and 96% of dose, respectively, after 48 h. At the end of the experiments (at 48-h postdose), only 2% of dose was measured in the carcasses from Group 1. In general, a good recovery of drug related material in range of 97.3–102% (mean, n = 3) was obtained for both groups.
Metabolism
Metabolite structures
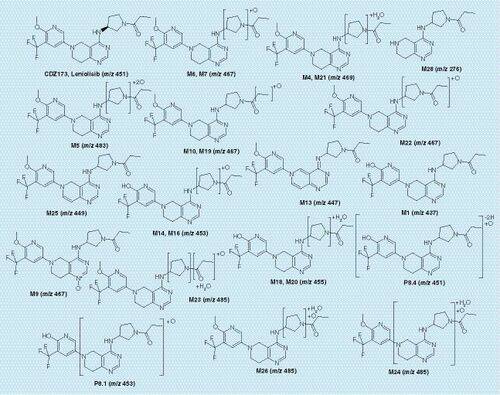
The structural characterization of metabolites in plasma and excreta was carried out by LC-MSe analysis. The product ion spectrum (Supplementary Figures 7 & 8) showed the [M + H]+ ion at mass over charge (m/z) 451, and fragments including: retro Diels-Alder fragmentation cleavage across the piperidine ring (m/z 247), cleavage of the piperidine with the loss of proprioaldehyde (m/z 191) or propioamide (m/z 174) and the retro Diels-Alder cleavage combined with the cleavage of the pyrrolidine moiety (m/z 124) were observed after collisional activation. Analogous fragment ions or fragmentation pathways were observed in metabolite mass spectra, allowing biotransformation localization based on m/z differences between fragments. The list of metabolites is presented in Supplementary Table 13, and their proposed structures are depicted in . As for previously investigated studies, Phase II metabolism is not relevant for Leniolisib in rats. As all major peaks of radioactivity have been characterized in depth, and based on comparable methodology used in other studies using other compounds or positive controls in the scope of in vitro incubations. We are confident that our analytical techniques would allow us to detect Phase II metabolites.
CDZ173 (Leniolisib) & its metabolites in plasma
Metabolite profiles in pooled samples after p.o. administration from Group 1 () and Group 2 () were qualitatively and quantitatively similar. The measured concentrations and derived PK parameters are listed in (Group 1) & (Group 2). The parent compound reached Cmax at 0.25 h (4.09 and 4.04 μM, for Group 1 and Group 2, respectively). The calculated AUC0–8 h (area under the time-concentration curve from 0 to 8 h) for parent, derived from the metabolite profiles, were similar (12.3 vs 14.9 μM × h for Group 1 [TopCount]) and Group 2 [MICADAS], respectively). However, the parent compound as percentage of total 14C-AUC0–8 h differed slightly (75% [Group 1] vs 64% [Group2]) as more low abundance uncharacterized radioactivity was integrated in metabolic profiles derived from Group 2.
Plasma pool from all three rats at 0.25 h (A), plasma pool from all three rats at 8 h (B), urine pool from all three rats across the 0–48-h interval (C) and feces pool from all three rats across the 0–48-h interval (D). The unit of radioactivity on the y-axis is disintegration per min (dpm) per ml of column effluent (dpm/ml).
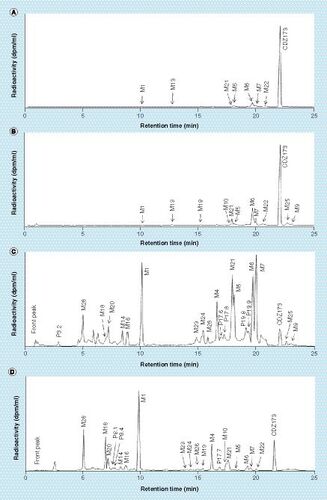
Plasma pool from all three rats at 0.25 h (A), plasma pool from all three rats at 8 h (B), urine pool from all three rats across the 0–48-h interval (C) and feces pool from all three rats across the 0–48-h interval (D). The unit of radioactivity on the y-axis is disintegration per min (dpm) per ml of column effluent (dpm/ml).
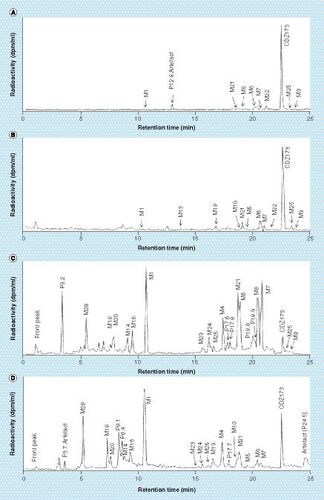
The major radiolabeled component in plasma was unchanged CDZ173 (Leniolisib), other noticeable components were the hydroxylated metabolites M6, M7 and M22 followed by M21 (hydroxylation combined with reduction), M5 (di-hydroxylation) and M13 (dehydrogenation). Other unidentified peaks observed in Group 2 were all of minor importance. For the main metabolites M6, M7 and M22 the measured values for M6 and M22 14C-AUC0–8 h were similar between the conventional and the microtracer methods, whereas a slightly higher extend of formation of M7 was observed in Group 2. Other observable differences are M9 (N-oxidation) and M25 (dehydrogenation) which are more prominent in Group 2 than Group 1.
CDZ173 (Leniolisib) & its metabolites in urine & feces
Urine fractions from the 0- to 48-h interval contained around 5% of the administered radioactivity. Metabolite profiles showed in (Group 1) and (Group 2) were similar. The most prominent metabolites were M1 (O-demethylation), the hydroxylated products M6, M7 or di-hydroxylated product M5 and metabolite M21 (hydroxylation and reduction), which represented <0.7% of dose each. The main observable difference between the profiles is the peak eluting at 3.2 min in the MICADAS–cAMS () profile which is less prominent in Group 1 ().
The 0–48 h fecal pools accounted for 90 and 96% of the administered radioactive dose for Group 1 and Group 2, respectively. Profiles acquired with both methods (TopCount, and MICADAS, ) were very comparable. shows the amount of CDZ173 and its metabolites excreted in urine and feces as detected by Topcount (Group 1) and MICADAS–cAMS (Group 2). The parent compound was one of the major components in feces accounting for 7 and 8% of dose for Group 1 and Group 2, respectively. Major metabolites in feces were M1 (21 and 19% of dose for Groups 1 & 2), M28 (9 and 8% of dose), M4 (6% of dose), M18 (7 and 5% of dose) and M21 (4% of dose). Uncharacterized or incompletely characterized metabolites were found to represent <4% of dose, except P8.1, P8.4 and P24.5 which were present in higher abundance in the Group 2 animals and represented 7, 4 and 5% of dose, respectively.
Overall, some small differences were observed in the plasma, urine and feces metabolite profiles between the two groups. Some possible explanations for these differences were considered as follows: certain peaks such as P12.8 () or P3.7 () were clearly identified as artefacts. In the current analytical setup, the UHPLC effluent was collected in 6-s fractions, knowing that a chromatographic peak elutes in average in 15 s with a UHPLC system, radioactivity should be observed in at least two consecutive fractions. For P12.8 and P3.7 a 12C/14C ratio higher than the background was observed in only one fraction. Consequently, those peaks were considered as artefacts coming from an external contamination after the effluent fraction collection. P24.5 was only detected in Group 2 analyzed by MICADAS–cAMS (). The peak shape is not well resolved or symmetrical, despite the fact that at this retention time the chromatographic eluant is nearly 100% organic, which usually results in a peak shape that is sharp and symmetrical. Therefore, P24.5 could be a component released from an earlier injection and may be a chromatographic artefact as well. It was labeled as artefact in and not integrated in the profile nor in the final . Other peaks such as P8.1 and P8.4 ( [Group1], [Group 2]) were more pronounced in Group 2, but were identified by mass spectrometry and ascribed to metabolites. The small differences between the groups could be explained here by the general variation of metabolism between two animal groups [Citation25]. Alternatively, as sample preparation and metabolite profiling were performed in a facility where radioactivity is routinely handled, it is possible that some differences are due to minor sample contamination. Therefore, prevention of contamination is paramount, especially for metabolite profiling where eluant fractions need to be collected and dried. Thus, we suggest that such microtracer studies should be only carried out in facilities where no or low levels of radioactivity are used as suggested by Young et al. [Citation26]. Furthermore, specific measures should be taken to prevent or minimize any external contamination or cross-contamination, for example blank injections before the preparative UHPLC run, specific protection while drying the fractions, etc.
Biotransformation pathways
The contributions of different biotransformation pathways to the metabolism of Leniolisib (CDZ173) were estimated based on the percentage of dose quantified in urine and feces () and were independent of the applied method (regular radiolabeled dose vs microtracer). The amounts of dose excreted as metabolites in urine (6% of dose) and feces (96% of dose) as measured by MICADAS–cAMS show that Leniolisib (CDZ173) was mainly eliminated by metabolism. Based on the metabolite structures, likely primary and secondary metabolism pathways, the main primary metabolic elimination routes were O-demethylation to M1 (up to 35 and 34% of dose for Groups 1 & 2, respectively) and hydroxylation to M6/M7 (up to 30 and 32% of dose for Groups 1 & 2, respectively). However, the relative importance of these two elimination pathways is not clear, as metabolites M3, M4, M5, M21, M23 and M26 are likely secondary metabolites of M6/M7 and the metabolites M14, M16, M18, M20 could be formed as secondary metabolites from either M6/M7 or from M1. In any case, the estimated pathway contributions are similar based on each of the two analytical methods. This leads to the same overall result from MICADAS–cAMS and the conventional method. Other elimination pathways were considered as minor and will not further be discussed.
Conclusion
In the present study, the MICADAS–cAMS setup has been successfully validated for 14C quantification in labeled compounds and biomatrices. The linear dynamic range of MICADAS–cAMS quantification overlaps with that of LLLSC, so that these technologies can be used complimentarily to cover the required wide dynamic range of radioactivity in an ADME study as previously outlined [Citation21]. Radioactivity quantification with MICADAS–cAMS was performed to levels of around 1 mBq/g on labeled samples, whereas the LLOQ determined on unlabeled background samples was determined to be on the order of 0.1 mBq/g. Hence, sample preparation and prevention of 14C contamination holds the key to exploit the full capabilities of the MICADAS–cAMS method.
With respect to the head to head comparison (microtracer with MICADAS–cAMS versus conventional radioactivity amount approaches), similar results were obtained from the two dosing/analysis groups. However, the minor difference observed on the quantification of the total radiolabeled components could be explained by a slight difference in metabolism between the two groups, or a low-level contamination which could be only observable at very-low concentrations of the late time points. The determination of the rates and routes of excretion (mass balance) as well as the identification and quantification of drug-related components in plasma and excreta were successful. The results of the ADME studies were similar regardless of the fact that in Group 2 (microtracer), a 40,000-fold lower radioactivity was dosed. In this study, the radioactive dose was chosen to test the limits of the MICADAS–cAMS technology, especially for metabolite profiling at later time points. In regular microtracer studies approximately one hundred-fold higher radioactivity would be dosed, which will likely increase the signal to noise ratio of the measurements, leading to improved overall study outcomes.
This work successfully proves that cAMS could be employed to routinely assess the ADME properties of a drug in animals and humans.
Future perspective
This validation has shown that modern cAMS technology such as MICADAS–cAMS may be routinely applied in microtracer ADME studies. Hence, we strongly believe that this technology is applicable to human ADME studies and will offer significant advantages over the standard human ADME approach.
For a standard radiolabeled human ADME study, a rat tissue distribution investigation by Quantitative Whole Body Autoradiography is needed in order to estimate the radioactive body burden in humans. However, if the amount of radiolabeled drug substance in the final drug product, in the scope of a microtracer study, does not exceed the impurity level, this calculation of the radioactive body burden is not required (at least in some European countries such as The Netherlands [Citation27]) and rodent ADME and tissue distribution could be reduced as they are not needed for the dosimetry assessment. Therefore, the tissue distribution studies are not needed anymore, but they might still be useful for interpretation of safety findings (e.g., melanin binding and brain penetration) to support a drug registration. This could then be addressed later in development.
Similarly, the radiolabeled drug substance in a microtracer study normally does not need to be produced under good manufacturing practices (GMP) [Citation27–29]. As a consequence, the GMP manufacturing cost of a drug product can be reduced, if common compounding approaches are followed. For example, radioactivity could be administered as a drinking solution [Citation30].
The above advantages could have a major impact on the costs and timelines for planning of a human ADME study and, more importantly, would also allow embedding the human ADME in a Phase I setting, where the therapeutic dose and the microtracer are administered to healthy volunteers or patients in an additional arm of a first-in-human clinical study [Citation31,Citation32]. As the amount of total administered radioactive is sufficiently low as to be considered non-radioactive, the study could be conducted in any clinical Phase I center which is able to collect blood and excreta accurately for at least 7 days.
The embedding in a Phase I setting could have major implications for the drug development process. As relevant human metabolites and excretion routes would already be known by the end of Phase I [Citation33], the clinical pharmacology program could be tailored to the compound's elimination properties. However, if the final therapeutic dose is significantly higher than the one tested in Phase I, and if with nonlinear kinetics is observed between the doses, metabolites profile and exposure may change. Then, a cold metabolite coverage assessment would be required.
In addition, further animal ADME studies might become obsolete as exposure coverage of the relevant human metabolites in the toxicology species (mandatory to fulfill guidelines like FDA MIST [Citation34,Citation35] and ICH M3 guidelines [Citation3]) could be determined directly in animal samples from toxicology studies with qualified bioanalytical methods and, hence, without the need for a radiolabel [Citation4,Citation36,Citation37].
In our view, one of the main added values of the new proposed concept would be that in microtracer studies, patients or healthy volunteers are not be exposed to higher amounts of radioactivity as currently the case in conventional human ADME studies. This approach would also potentially allow the conduct of ADME type investigations in special populations like children, infants, pregnant women or elderly, where the administering of higher amounts of radioactivity is prohibited [Citation9]. Also, the technology could be applied to study the ADME fate of entities with a very long half-life, like for example biologics [Citation38] or modified biologics like antibody–drug conjugates.
We believe that the abovementioned advantages of microtracer studies will provide a significant incentive for the adoption of miniaturized cAMS systems such as MICADAS–cAMS. Currently, we are pursuing further technical developments spanning several aspects: for one, an increase in sample throughput from the current 120 samples per day to at least double that number is planned. To maximize the effect of this higher throughput, we plan on improving the automation and increasing the number of samples that can be processed without user interaction while minimizing the workload for sample preparation as well as the operating cost for the required instruments. Moreover, sample cross-talk, dynamic range as well as accuracy of all involved determinations will be further improved. To that end, we propose an important transition to the pharma sector conducting these studies: microtracer studies should be well isolated from any space or instrumentation that has been in contact with conventional radioactive doses. By consequently preventing sample contamination with higher activities during any step of the sample preparation, the full potential of microtracer studies with the cAMS technology will be exploited.
In conclusion, we believe that modern miniaturized combustion AMS technology has the potential to make a substantial impact on the overall drug development. We have presented this concept recently to the Committee for Medicinal Product for Human Use at EMA and have received a favorable opinion.
Table 1. Concentration of total radiolabeled components and pharmacokinetic parameters in plasma (Group 1 and Group 2).
Table 2. Excretion and recovery of total radiolabeled components.
Table 3. Plasma concentration, AUC values of CDZ173 and metabolites derived from metabolite profiles of pooled samples from Group 1, measured with TopCount technology.
Table 4. Plasma concentration, AUC values of CDZ173 and metabolites derived from metabolite profiles of pooled samples from Group 2, measured with MICADAS–cAMS technology.
Table 5. Amounts excreted of CDZ173 and metabolites derived from metabolite profiles of pooled samples (Group 1 [TopCount technology], Group 2 [MICADAS technology]).
Aim
Miniaturized combustion Accelerator Mass Spectrometry (cAMS), namely MICADAS–cAMS, has potential to be utilized in microtracer ADME studies.
Implementation of MICADAS–cAMS could allow hADME investigations in Phase I of drug development.
Experimental
MICADAS–cAMS validation was performed in the biomatrices blood, plasma, urine and feces.
Leniolisib was dosed at 10 mg/kg p.o. in rats as: a conventional radiotracer with conventional radiodetection, and a microtracer with MICADAS–cAMS atom counting. Mass balance, metabolite identification and clearance mechanism as well as biotransformation pathways were derived.
Results & discussion
Both the validation and head to head comparison were successful and led to similar results between the two compared methods.
Microtracer ADME studies can be conducted with MICADAS–cAMS sample analysis.
Conclusion
The application of microtrace approach in a Phase I clinical setting in combination with MICADAS–cAMS sample analysis could change the drug development paradigm if applied in humans.
Authors’ contributions
F Lozac'h, S Fahrni, T Faller, Suetterlin-Hachmann, D Pearson, M Walles and G Camenisch participated in research design. F Lozac'h, S Fahrni, D De Maria, C Welte and Suetterlin-Hachmann conducted experiments. F Lozac'h and S Fahrni performed data analysis. F Lozac'h, D De Maria, S Fahrni, Suetterlin-Hachmann, J Bourquin, D Pearson, M Walles and G Camenisch wrote or contributed to the writing of the manuscript.
Ethical conduct of research
The authors state that they have obtained appropriate institutional review board approval or have followed the principles outlined in the Declaration of Helsinki for all human or animal experimental investigations. In addition, for investigations involving human subjects, informed consent has been obtained from the participants involved.
Supplementary data to
Download MS Word (1.2 MB)Acknowledgements
The authors sincerely thank M Suetterlin-Hachmann, T Faller and S Desrayaud at Novartis for their nonclinical in vivo PK science and excellent support with the animal study. The authors gratefully acknowledge L Wacker (ETH Zurich) for his excellent technical assistance with MICADAS–cAMS analysis and T Wolf (Novartis) for metabolite profiling assistance and support.
Financial & competing interests disclosure
F Lozac'h, D Pearson, M Walles and G Camenisch are employees of Novartis Pharma and have received salaries and benefits commensurate with employment. S Fahrni and J Bourquin are employees of Ionplus AG and have received salaries and benefits commensurate with employment. The authors have no other relevant affiliations or financial involvement with any organization or entity with a financial interest in or financial conflict with the subject matter or materials discussed in the manuscript apart from those disclosed.
No writing assistance was utilized in the production of this manuscript.
Supplementary data
To view the supplementary data that accompany this paper please visit the journal website at: www.tandfonline.com/doi/suppl/10.2144/000112170
References
- US FDA . Code of Federal Regulations 21 CFR Part 361.1 Radioactive Drugs for Certain Research Uses. US Department of Health and Human Services, MS, USA (2007).
- European Medicines Agency . Guideline on Bioanalytical Method Validation. London, UK (2012). www.ema.europa.eu/docs/en_GB/document_library/Scientific_guideline/2011/08/WC500109686.pdf.
- European Medicines Agency . Guideline on the Investigation of Drug Interactions. London, UK (2013). www.ema.europa.eu/docs/en_GB/document_library/Scientific_guideline/2012/07/WC500129606.pdf.
- Yu CP , ChenCL, GoryckiFLet al. A rapid method for quantitatively estimating metabolites in human plasma in the absence of synthetic standards using a combination of liquid chromatography/mass spectrometry and radiometric detection. Rapid Comm. Mass Spectrom.21, 497–502 (2007).
- Ma S , LiZ, LeeKJet al. Determination of exposure multiples of human metabolites for MIST assessment in preclinical safety species without using reference standards or radiolabeled compounds. Chem. Res. Toxicol.23, 1871–1873 (2010).
- Lappin G , GarnerRC. Big physics, small doses: the use of AMS and PET in human microdosing of development drugs. Nat. Rev. Drug Discov.2 ( 3 ), 233–240 (2003).
- Lappin G , GarnerRC. The use of accelerator mass spectrometry to obtain early human ADME/PK data. Expert Opin. Drug Metabol. Toxicol.1 ( 1 ), 23–31 (2005).
- Young GC , SeymourM, DuekerSR, TimmermanP, ArjomandA, NozawaK. New frontiers-accelerator mass spectrometry (AMS): recommendation for best practices and harmonization from Global Bioanalysis Consortium Harmonization Team. AAPS J.16 ( 2 ), 357–359 (2014).
- Vuong LT , SongQ, LeeHJet al. Opportunities in low-level radiocarbon microtracing: applications and new technology. Future Sci. OA2 ( 1 ), FSO74 (2015).
- Zollinger M , Lozac'hF, HurhE, EmotteC, BaulyH, SwartP. Absorption, distribution, metabolism, and excretion (ADME) of 14C-sonidegib (LDE225) in healthy volunteers. Cancer Chemother. Pharmacol.74, 63–75 (2014).
- Graham RA , LumBL, MorrisonGet al. A single dose mass balance study of the Hedgehog pathway inhibitor vismodegib (GDC-0449) in humans using accelerator mass spectrometry. Drug Metab. Dispos.39, 1460–1467 (2011).
- Higton D , YoungG, TimmermanP, AbbottR, KnutssonM, SvenssonLD. European Bioanalysis Forum recommendation: scientific validation of quantification by accelerator mass spectrometry. Bioanalysis4 ( 22 ), 2669–2679 (2012).
- Ruff M , FahrniS, GäggelerHet al. On-line radiocarbon measurements of small samples using elemental analyzer and MICADAS gas ion source. Radiocarbon52, 1645–1656 (2010).
- Ognibene T , BenchG, VogelJ, PeasleeG, MurovS. A high-throughput method for the conversion of CO2 obtained from biochemical samples to graphite in septa-sealed vials for quantification of 14C via accelerator mass spectrometry. Anal. Chem.75 ( 9 ), 2192–2196 (2003).
- Van Duijn E , SandmanH, GrossouwD, MockingJA, CoulierL, VaesWH. Automated combustion accelerator mass spectrometry for the analysis of biomedical samples in the low attomole range. Anal. Chem.86 ( 15 ), 7635–7641 (2014).
- Synal HA , StockerM, SuterM. MICADAS: a new compact radiocarbon AMS. Nucl. Instrum. Methods. Phys. Res. B259 ( 1 ), 7–13 (2007).
- Suter M . Challenging developments in three decades of accelerator mass spectrometry at ETH: from large particle accelerators to table size instruments. Eur. J. Mass Spectrom.16, 471–478 (2010).
- Schulze-König T , DuekerSR, GiacomoJ, SuterM, VogelJS, SynalH-A. BioMICADAS: compact next generation AMS system for pharmaceutical science. Nucl. Instrum. Methods. Phys. Res. B268, 891–894 (2010).
- Dueker SR , LohstrohPN, GiacomoJA, VuongLT, KeckBD, VogelJS. Early human ADME using microdoses and microtracers: bioanalytical considerations. Bioanalysis2 ( 3 ), 441–454 (2010).
- Garner RC , BarkerJ, FlavellCet al. A validation study comparing accelerator MS and liquid scintillation counting for analysis of 14-C labelled drugs in plasma, urine and faecal extracts. J. Pharm. Biomed. Anal.24, 197–209 (2000).
- Swart P , Lozac'hF, SimonM, van DuijnE, VaesWH. The impact of early human data on clinical development: there is time to win. Drug Discov. Today21 ( 6 ), 873–879 (2016).
- Wacker L , ChristlM, SynalHA. Bats: a new tool for AMS data reduction. Nucl. Instrum. Methods. Phys. Res. B268, 976–979 (2010).
- Horrocks DL . The mechanisms of the liquid scintillation process. Liquid Scintil. Sci. Tech.1–16 (1976).
- Noakes J , NortonG, CulpR, NigamM, DvoracekD. A comparison of analytical methods for the certification of biobased products. Adv. Liquid Scintil. Spectr.259–271 (2005).
- Baillie TA , RettieAE. Role of biotransformation in drug-induced toxicity: influence of intra- and inter-species differences in drug metabolism. Drug Metab. Pharmacokinet.26 ( 1 ), 15–29 (2011).
- Young G , EllisW, AyrtonJ, HusseyE, AdamkiewiczB. Accelerator mass spectrometry (AMS): recent experience if its use in a clinical study and the potential future of the technique. Xenobiotica31 ( 8/9 ), 619–632 (2001).
- Roffel AD , PoelmanH. Human ADME and studies with radiolabeled compounds: Phase I-IIa. PRAhealthsciences, Groningen, The Netherlands.
- International Council for Harmonization of Technical Requirements for Pharmaceuticals for Human Use . M3(R2) Nonclinical Safety Studies for the Conduct of Human Clinical Trials and Marketing Authorization for Pharmaceuticals (2013) www.ich.org/fileadmin/Public_Web_Site/ICH_Products/Guidelines/Multidisciplinary/M3_R2/Step4/M3_R2__Guideline.pdf.
- International Council for Harmonization of Technical Requirements for Pharmaceuticals for Human Use . Q3A(R2) Impurities in New Drug Substances (2008).
- Stopfer P , MarzinK, NarjesHet al. Afatinib pharmacokinetics and metabolism after oral administration to healthy male volunteers. Cancer Chemother. Pharmacol.69, 1051–1061 (2012).
- Lappin G , SeymourM, GrossG, J⊘rgensenM, KallM, KværnoL. Meeting the MIST regulations: human metabolism in phase I using AMS and a tiered bioanalytical approach. Bioanalysis4 ( 4 ), 407–416 (2012).
- Gupta N , ZhangS, PusalkarSet al. A Phase I study to assess the mass balance, excretion, and pharmacokinetics of [14C]-ixazomib, an oral proteasome inhibitor, in patients with advanced solid tumors. Invest. New Drugs. doi:10.1007/s10637-017-0509-1 (2017) ( Epub ahead of print ).
- Roffel AF , van MarleSP, van LierJJ, HartstraJ, van HoogdalemEJ. An evaluation of human ADME and mass balance studies using regular or low doses of radiocarbon. J. Labelled Comp. Radiophamaceuticals59, 619–626 (2016).
- US FDA . Guidance for Industry: Safety Testing of Drug Metabolites. US Department of Health and Human Services, MS, USA (2008).
- US FDA . Guidance for Industry CGMP for Phase I Investigational Drugs. US department of Health and Human Services, MS, USA (2008). www.fda.gov/ohrms/dockets/98fr/oc07114.pdf.
- Obach RS , NeddermanA, SmithDA. Radiolabelled mass-balance excretion and metabolism studies in laboratory animals: are they still necessary?Xenobiotica42 ( 1 ), 46–56 (2012).
- Roffey SJ , ObachRS, GedgeJIet al. What is the objective of the mass balance study? A retrospective analysis of data in animal and human excretion studies employing radiolabeled drugs. Drug Metab. Rev.39, 17–43 (2007).
- Vlaming ML , van DuijnE, DillinghMRet al. Microdosing of a carbon-14 labeled protein in healthy volunteers accurately predicts its pharmacokinetics at therapeutic dosages. Clin. Pharmacol. Ther.98 ( 2 ), 196–204 (2015).