
Abstract
In response to an earlier workshop covering the pros and cons of quantification below the LLOQ (BLQ) the author reviews the topics discussed from the bioanalytical standpoint. Important considerations for estimating concentrations below the LLOQ include: method signal-to-noise, baseline shape and condition, close lying interference peaks (especially for protein methods), matrix effect, adsorption and stability of the analyte at low concentrations and carryover. These methodological issues are discussed as possible contributors to inaccuracy in BLQ estimations, and appropriate cautions are provided via examples. A proposed method for the evaluation of BLQ estimations utilizes extended incurred sample reanalysis analysis where BLQ samples or spiked simulated samples are analyzed with quality controls and standards in addition to those in the original study. Generally, BLQ estimations are discouraged, with the recommendation that any extrapolations should be done in close collaboration between the pharmacokinetic (PK) and bioanalytical scientists in consultation with the regulatory agency.
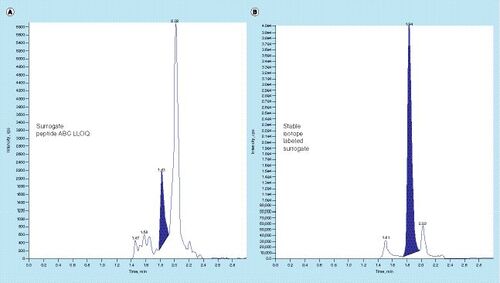
(A) SRM chromatogram of the analyte surrogate peptide spiked into processed matrix, and (B) SRM chromatogram of the internal standard, a stable isotope-labeled form (13C15N) of the analyte surrogate peptide, in the same matrix sample. In both chromatograms (A) and (B), the column effluent was diverted to waste until 1.4min run time.
The analyte is introduced postcolumn such that a steady state LC–MS/MS signal is produced, then a slug of the extracted matrix blank from the analytical extraction procedure is injected. The resulting ‘suppressogram’ will show deflections in the signal that cause ionization suppression or enhancement over the course of the chromatogram [Citation31]. The top three curves are from blanks prepared by (A) solid phase extraction; (B) protein precipitation; and (C) liquid/liquid extraction. The lower chromatogram shows chromatograms for the analyte(1-) and internal standard (2-).
![Figure 2. Diagram of a chromatographic system used to observe matrix effect (suppression and enhancement).The analyte is introduced postcolumn such that a steady state LC–MS/MS signal is produced, then a slug of the extracted matrix blank from the analytical extraction procedure is injected. The resulting ‘suppressogram’ will show deflections in the signal that cause ionization suppression or enhancement over the course of the chromatogram [Citation31]. The top three curves are from blanks prepared by (A) solid phase extraction; (B) protein precipitation; and (C) liquid/liquid extraction. The lower chromatogram shows chromatograms for the analyte(1-) and internal standard (2-).](/cms/asset/468956da-13d2-48c0-b03e-7fedcdff0f61/ibio_a_12352391_f0002.jpg)
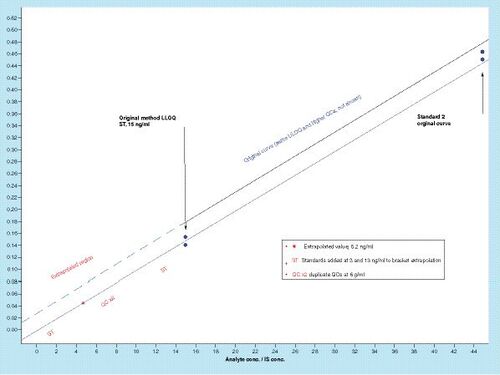
In this case a validated method with an LLOQ of 15ng/ml was used to analyze a study. For pharmacokinetic0 purposes an estimated value of 5.2ng/ml was obtained from a below the LLOQ sample. To help support this estimation, incurred sample reanalysis samples were run using additional standards and quality controls within the extrapolation region. All other calibrators and quality controls were kept the same as in the original method.
Recently, the author participated in an American Association of Pharmaceutical Scientists (AAPS) workshop discussing the pros and cons of releasing plasma concentrations in GLP and GCP studies below the LLOQ (BLQ) for PK or pharmacodynamic (PD) purposes [Citation1]. The discussion at this workshop was quite spirited, and there was great overall interest in the topic. As such, it seemed worthwhile to publish a discussion of the topics presented at this workshop from the bioanalytical point of view, specifically pertaining to LC–MS/MS methods for both small molecules and protein analytes but excluding ligand binding methods. Note that, while many of these bioanalytical considerations can also pertain to metabolites and biomarkers, these discussions are intended for conventionally validated drug analyte molecules.
There are often reasons to seek estimated (calculated concentrations from actual chromatographic run data) concentrations BLQ [Citation2] or extrapolated BLQ concentrations (concentration data projected to a sub-LLOQ concentration via mathematical calculations [Citation3]). These reasons include: obtaining a value for terminal half-life at lower drug doses, determining trough values for extended dosing or low doses, and PK modeling exercises [Citation4,Citation5]. While these methods all seek to obtain usable PK data to support their respective studies, there are many potential bioanalytical pitfalls that must be considered when ‘extending BLQ’ using even the best modeling techniques or direct estimations from existing chromatographic data. Beyond the basic regulatory considerations for reporting values outside the calibration range, there are chemical and bioanalytical issues that can impact the accuracy of reported BLQ values. In this paper we will discuss those issues, using examples where possible.
PK extrapolations/estimations
In many cases extrapolations or estimations of concentrations BLQ are helpful, and in some cases, they are necessary for modeling and interpretive reasons [Citation3–5]. Despite these needs, the following bioanalytical questions need to be answered when extrapolations are considered:
What is the relative magnitude of the extrapolations or estimations proposed for a given method and study?
What are the bioanalytical factors that come into play to affect values in the desired range below the LLOQ and how can they be critically evaluated?
When is it scientifically valid to use extrapolated values or to estimate them from sub-LLOQ chromatograms?
What, if any, validation or verification of the extrapolated or estimated values needs to be performed?
Questions must be asked both from first, the interpretive standpoint: what is the purpose and value of the BLQ extrapolation for the PK exercise we wish to perform? and second, from the standpoint of bioanalytical validity: how much extrapolation can be made? Can valid concentrations be estimated at 20%, 50%, 100% or more below the determined assay LLOQ? The answer in terms of question second can be determined empirically and is likely different for each assay and for each study. It may even differ for individual runs within the same study. Depending upon the assay and circumstances, the extrapolations may also be supportable by validation or verification data (described below).
Here, we will look at some of the important factors that can adversely impact BLQ quantification. All these factors are known to experienced bioanalytical scientists, as they are routinely encountered in various assays; but they have not been collectively considered as they may apply to BLQ extrapolations/estimations. As such, this discussion might be useful to PK scientists and their bioanalytical colleagues who are considering BLQ extrapolations for regulated studies.
Regulatory considerations
The regulatory guidances for bioanalytical validation both from the US FDA [Citation6–8] and EMA [Citation9] clearly specify that the calibration range of an assay is defined by a series of standards prepared in matrix, which is bounded by the upper limit of calibration (ULOQ) and the lower limit of calibration (LLOQ). Another series of quality control (QC) samples are prepared at concentrations near the lower, middle and upper ends of the curve, and processed along with standards and samples in each analytical run. These standards and QCs qualify the run, determining whether it passes or fails acceptance according to fixed accuracy and precision criteria over 3 runs. As such, the regulatory agencies strictly define the qualified assay range at the time of validation and generally do not support reporting values BLQ. A quote from the 2001 FDA guidance on this subject reads as follows: “Estimation of concentration in unknown samples by extrapolation of standard curves below LLOQ or above the highest standard is not recommended. Instead, the standard curve should be redefined …” [Citation6]. Similarly, the 2013 Draft FDA validation guidance states “Concentrations in unknown samples should not be extrapolated below the LLOQ or above the ULOQ of the standard curve. Instead, the standard curve should be extended and revalidated, or samples with concentrations above the ULOQ should be diluted and reanalyzed. Concentrations below the LLOQ should be reported as zeroes” [Citation7]. The most recent FDA guidance states “study samples with concentrations listed below the LLOQ should be reported as below the LLOQ (BLQ)” [Citation8].
The regulators consistently state that extrapolations BLQ should be avoided and that additional validation experiments be performed to verify the performance of the method at any points BLQ if such values are to be used for analysis. Their concerns lie in the possible losses of accuracy, precision and linearity that may occur below the lower limits of the assay range; yet there are certainly situations where an extended concentration BLQ can potentially provide useful data for various PK-related exercises [Citation3–5]. Here we will consider some of the important chemical, physical and matrix-related forces that have impacted quantification at low analyte levels in our labs over the past years, and we will discuss their potential for disruption of the quantitative properties of bioanalytical assays at sub LLOQ concentrations.
Bioanalytical & chemical considerations
Support provided by the method validation
As discussed briefly above, the formal validation conducted according to the regulatory agencies’ guidances [Citation8,Citation9] provides a solid framework that verifies the performance of the method over the defined concentration range. Beyond the quantitative calibration range supported by method’s standards and QCs, the validation verifies the selectivity of the method with different lots of matrix, explores the numeric value of the matrix effect, the stability of the analyte in matrix, during bench top processing and extracted storage, the accuracy of dilutions, the precision and accuracy of the assay over multiple batches, as well as a number of other important parameters [Citation8,Citation9]. One example of a key validation component is that of chromatographic selectivity testing used for protein LC–MS/MS methods depicted in [Citation10]. In this example 20 individual blanks from both control and disease state matrices are spiked at the assay LLOQ, then they are analyzed in a full assay run. In this case the selectivity test meets criteria if eight out of ten results calculate within 25% of the nominal concentration.
As shown in the legend for , selectivity experiments were used for the validation of a hybrid protein immunocapture LC–MS/MS method (IC PrD-LC–MS). Ten individual (right column) and ten disease state (left column) plasmas were analyzed both as blanks and spiked at the assay LLOQ. The selectivity/specificity test passes for this assay if eight out of ten samples quantify within 25% of the LLOQ.
In addition to quantitative ‘pass/fail’ information, inspection of individual blank and LLOQ chromatograms can reveal details such as poor peak shape, co-eluting or close-lying interference peaks and undesirable baseline characteristics that might adversely affect integration [Citation10].
Such selectivity tests provide rigorous examinations of assay performance at the LLOQ using various matrices, including those that will be encountered in planned studies. For BLQ samples these verifications may still be valid, but they are not guaranteed. It is especially important to know if quantitative or chromatographic changes can affect the assay at the LLOQ in disease state matrices before initiating studies in patient populations. Both quantitative and chromatographic issues related to selectivity can be amplified at low analyte concentrations, that is, in extrapolated or estimated BLQ values.
Improvements in LC–MS/MS instrumentation
Over the last 15years, the power and absolute sensitivity of triple quadrupole LC–MS/MS instruments used for bioanalysis have increased dramatically [Citation11–13].LODs for small molecules in picogram per milliliter range are now commonplace, and attomole LODs have been reported for some of the latest instruments [Citation13]. These improvements have been brought about by new designs for highly efficient atmospheric ionization, better collection of ions and focusing into the mass spectrometer, more efficient collision cells, and more sensitive detectors with better dynamic range [Citation13]. In recent years, additional quantitative sensitivity has been achieved via micro- and nanoflow chromatographic techniques [Citation14,Citation15]. These improvements in method sensitivity have provided major advantages for analysts, especially when study samples contain very high potency drug candidates that are delivered in low doses.
One bioanalytical advantage of these modern, very high sensitivity LC–MS/MS instruments is that they can be used to perform routine assays with normal LLOQs but using more diluted matrix, thus exhibiting reduced matrix effect [Citation16]. Nevertheless, when very high sensitivity is required for low level detection, matrix effect can be an important factor.
One type of LC–MS/MS instrumentation that has not been discussed here is that of hybrid systems: quadrupole-TOF and quadrupole-orbitrap instruments. These instruments provide very high resolution for the SRM fragment ion (HRMS), and they can improve quantitative performance by eliminating near isobaric interferences via their extremely narrow spectral bandwidth. The obstacles that are preventing the use of HRMS in routine high-throughput bioanalysis include high unit cost, complexity and limited sensitivity. Though the examples cited here pertain primarily to triple quadrupole instruments, technological improvements and cost reduction in HRMS systems promise to overcome these problems in coming years [Citation11].
Sensitivity: chromatographic signal-to-noise at the LLOQ
One of the most basic considerations for extrapolation of any BLQ value in a bioanalytical study is the instrument’s actual LOD, which can be determined directly, but it can also be anticipated by the chromatographic signal-to-noise at the assay LLOQ. While a compound can be considered detectable with a chromatographic signal-to-noise (S/N) value of 3:1 (LOD), most analysts consider S/N values of at least 10:1 to be required for quantification [Citation17,Citation18]; and some authors provide evidence that S/N values of 50:1 or 100:1 are necessary to achieve the best chromatographic methods with very low recordable variation [Citation19,Citation20]. The regulators’ expectations for this value are stated in the FDA’s Guidance for Bioanalytical Validation, defines the minimum required response at the LLOQ in terms of a multiple of the response of the appropriate blank: “the analyte response at the LLOQ should be at least five times the response compared to blank response” [Citation7,Citation8].
Because of newer very high sensitivity LC–MS/MS systems (above), there may often be modern assays with large S/N values at the LLOQ. It is not uncommon for the project PK scientist to set a target for the assay LLOQ that will satisfy requirements for the dosing regimen and expected plasma concentrations, where this LLOQ is well above the sensitivity limits of the LC–MC/MS system; nevertheless, when an assay is designed for very low doses, the S/N at the assay LLOQ can be nearer to the minimum 10:1 ratio even with very high sensitivity LC–MS/MS instrumentation. In such situations, there are a number of chemical, physical and biochemical interactions that become more critical when considering BLQ extrapolations/estimates. The most important of these are outlined below.
Baselines & integration
As the chromatographic peak height decreases, it approaches the magnitude of the peak-to-peak baseline noise of the system [Citation19]. This is the reason why the 2013 draft guidance specifies that the signal at the LLOQ must be at least five-times the blank value [Citation7]. In all cases, as the S/N decreases, baseline integration will become less reliable, and variability will increase [Citation20].
Skewed or inclined baselines are less common in SRM chromatograms, but they can be encountered, especially when a solvent gradient is employed. Slanting baselines will have an additional negative effect on the accuracy of integration. In all cases, baseline integration will be less accurate and variability will increase as the S/N decreases. In other cases, the baseline can develop an undulating variation that can be due to changing gradient conditions and/or pump oscillations and can also become problematic at high sensitivities.
Such baseline aberrations can make accurate integration more difficult as compared with chromatograms with similar S/N but flat baselines. Most of these baseline effects are not as significant at concentrations above the LLOQ, since assay performance between the LLOQ and ULOQ has been verified during validation.
Chemical noise & unidentified chromatographic interference peaks
Chemical noise in LC–MS/MS is defined as baseline noise due to those components in the chromatogram that are molecular or chemical in nature but are not from the analyte’s SRM signal [Citation21–23]. These components are difficult to precisely define, but they can include elements of the mobile phase or matrix that impact the baseline, as well as close lying or ‘nearly isobaric’ interferences in the matrix or the injection slug. In many cases, chemical noise can simply appear as a noisy or irregular baseline in the chromatogram [Citation21].
In other cases, discrete potentially interfering peaks can be observed. The origin of such peaks can be due to matrix derived contaminants picked up in the extraction process or eluted from the column and appearing in the SRM chromatogram. The retention time proximity and intensity relative to the analyte peak are critical in determining whether they will interfere with the assay. As is the case for the other baseline interferences and aberrations mentioned above, these close-lying interference peaks become more significant at low concentrations and may be especially problematic BLQ.
Chemical noise and interference on the baseline are particularly important analytical issues with protein bioanalytical methods that use LC–MS/MS of a surrogate peptide after proteolytic digestion from a crude matrix (PrD-LC–MS). Because of these interferences, PrD-LC–MS methods are usually effective for protein quantification only at levels down to the microgram per milliliter range. A shows the SRM chromatogram of a surrogate peptide derived from crude plasma trypsin digestion. This chromatogram is characterized by an irregular baseline due to chemical noise and multiple unresolved peaks derived from a very complex mixture of peptides and other matrix components from the proteolytic digest. In this chromatogram, the integrated peak, corresponding to the LLOQ concentration of the surrogate peptide, is not fully resolved from a large peak immediately adjacent to the analyte peak (A). Clearly, this chromatographic system would not permit accurate integration and quantification at concentrations much BLQ as shown.
Chromatogram A in is from the analyte peptide at its LLOQ concentration after proteolytic digestion in matrix, and chromatogram B is from the internal standard (a stable isotope labeled form of the surrogate peptide) monitored in the same injection.
In examining these chromatograms, chemical noise and close lying potentially interfering peaks can be seen both in the analyte and in the internal standard chromatogram; but here, the interferences are quite different in retention time and intensity in these two chromatograms due to 8Da shift of the SRM mass in the internal standards compared with that of the analyte. When proteolytic digests of complex matrices such as plasma are analyzed, even SRM chromatograms are subject to interferences such as these, a major factor that limits the sensitivity of PrD-LC–MS methods [Citation24].
Adsorption
Many molecules exhibit adsorption to surfaces, depending upon their solvation and the type of surfaces they are exposed to. Proteins and peptides are particularly susceptible to surface adsorption because of their inherent amphipathic nature [Citation25]. In LC–MS/MS systems, adsorption of peptides can occur in portions of the autosampler flow path, the injector valve, and even on the walls of plate wells holding extracts prior to injection [Citation26]. shows the results for adsorption loss of a protein drug candidate at 10 and 200ng/ml in the presence and absence of two concentrations of bovine serum albumin (BSA), used here as an antiadsorption reagent, in both plasma and urine.
In urine, more than half of the drug is lost without added BSA after 4days of storage. The observation that the recovery shows an initial decline but does not continue to decrease over the 1 month storage period (light text) is indicative of adsorption where the number of available analyte binding sites on the surface of the storage vessel is limited and becomes saturated quickly in the absence of the antiadsorption reagent. Adsorption can be a problem in any stage of storage or analysis, and losses can occur on processing apparatus, glassware, 96-well plates and in autosampler flow path components. In cases where the antiadsorption additives are absent, diluted by the extraction process, or present at nonoptimal concentrations, adsorptive effects can be a serious issue, and they are likely to be more pronounced at lower assay and certainly BLQ analyte concentrations.
Matrix effect
Plasma and other biological matrices contain salts, small molecules, peptides, proteins, lipids and many other soluble components, which can modify the LC–MS/MS analyte signal [Citation27–34]. One of the best described matrix interferents in plasma are phospholipids [Citation33]. The observed signal attenuation is usually a reduction in response (ionization suppression), but in some cases it can be an increase (ionization enhancement) [Citation28,Citation31]. The extent of matrix interference realized by an analyte is dependent upon the matrix type and concentration, the analyte’s structure, the chromatographic system that can allow matrix effectors to co-elute with analyte, and the sensitivity of the LC–MS/MS source to ionization suppression or enhancement [Citation31,Citation32,Citation34]. The matrix effect of a given assay is routinely measured during validation [Citation8,Citation9,Citation27], but matrix effect data do not provide information about the causes of suppression or enhancement. Since these matrix effects are multifactorial, it is often difficult to control them and even to monitor them as assay conditions change [Citation31,Citation32,Citation34].
In 1999, scientists at Merck & Co. published a method whereby the matrix effect on a specific analyte can be rapidly and simply visualized under any defined set of extraction and chromatographic conditions [Citation31]. This is achieved by first running the chromatographic system with the column and mobile phase under analytical conditions; then introducing the analyte postcolumn via a tee union while monitoring the analyte SRM, thus yielding a constant MS/MS signal. An extracted matrix blank is then injected to generate a ‘suppressogram’, such that positive or negative deflections in the signal indicate the relative extent of ionization suppression or enhancement as matrix components elute from the column [Citation31]. A chromatogram of the analyte run under the same conditions can be aligned with the suppressogram to visually determine the retention time range where suppression overlaps with the chromatographic peak. An example of this technique, run in our lab several years ago, is shown in .
In this example, matrix blanks were extracted by protein precipitation, SPE and liquid–liquid extraction. The reference chromatograms for the analyte and its internal standard, run in the same system, are shown at the bottom of the graph. Clearly, the matrix effect differs in extent and retention time for each extraction method. It can also be demonstrated that there are differences in matrix effect between different matrices from the same species, such as control versus disease state plasmas [Citation34].
These examples of extraction method- and retention time-dependent matrix suppression also indicate that suppression at a given injection volume will be more impactful at lower analyte concentration with a constant amount of matrix on column. Matrix effect is tested during validation at the low and high QC concentrations for the assay range [Citation7,Citation9], so that the extent of these effects at sub LLOQ concentrations and their potential interference with the assay cannot be determined without additional testing. Certainly, the use of stable isotope-labeled internal standards is now the usual procedure in most small molecule and surrogate peptide-based LC–MS/MS assays, and this technique is very helpful in compensating for chromatographically variable matrix effects [Citation32]. Nevertheless, matrix suppression can reduce analyte S/N at low concentrations, regardless of the internal standard type.
Selectivity: interferences
Hybrid protein LC–MS/MS assays (IC PrD-LC–MS) can be particularly susceptible to interferences by plasma components that block or inhibit the analyte capture step [Citation10,Citation35,Citation36]. These assays work by first purifying the analyte from matrix using immunocapture followed by proteolytic digestion and LC–MS/MS analysis of surrogate peptide for quantification. Circulating target molecules, antidrug antibodies (ADA) or other specific ligand molecules in the matrix that bind to the drug or capture reagent can inhibit the assay by blocking the immunopurification process.
Spike-recovery experiments such as those described below () can measure specific recovery of the analyte in the immunocapture step of such assays, and the relative recoveries can be compared between different matrices, additives and putative interfering ligands [Citation10]. In these experiments the matrix samples, with or without putative interferents, are spiked with the analyte protein either before or after the immunocapture step, then separately processed and quantified. The resulting quantitative difference indicates the immunocapture recovery or efficiency (ICE), as affected by the specific additives.
shows the results of ICE spike-recovery experiments on an IC PrD-LC–MS assay comparing various matrix types and additives. These results show that the presence of ADAs added at low, medium and high titer levels as well as disease state plasma ‘C’ shows no significant differences in ICE values from the control and BSA-containing plasmas. It does appear that disease state plasma ‘A’ and possibly plasma ‘B’ at the low QC concentration might reduce ICE relative to the controls.
Taken together, these data show that there is a potential disease state matrix sensitivity in the immunocapture phase of the assay. With reference to disease state ‘B’ plasma second row (), the data suggest that there may be more matrix inhibition at the lower QC level [Citation10]. In this case, with an effect realized at the low QC level (3× the LLOQ), BLQ extrapolations would need to be performed with caution and likely with accompanying verification as described below.
Carryover
Most chromatographic assays are prone to and must be evaluated for carryover [Citation37–39]. Carryover occurs when a processed sample-containing analyte is first injected in the analytical chromatographic system followed by a blank or low-level sample; and the subsequent injection yields an analyte signal comprising some fraction of the signal from the previous injection. That fraction is termed the percent carryover, and it can cause both false-positives and erroneously elevated concentrations in some samples [Citation39]. The causes of carryover are often difficult both to identify and to remediate, and carryover must be monitored continually even when validation results have been acceptable. This is because components of the HPLC flow path, injector and column can contribute variably to carryover depending upon their condition with the result that carryover can change over the course of sample analysis [Citation38,Citation39].
Carryover in peptide LC–MS/MS systems, including those used as surrogates for protein quantification can be particularly problematic. The severity of such problems depends upon the size, polarity and relative ‘stickiness’ of the peptide analyte in the chromatographic system in use [Citation25,Citation26]. Carryover can be a particularly difficult problem for peptide and PrD-LC–MS methods. For the latter, it can impact the selection of a surrogate peptide during method development [Citation26]. If changes in flush solvent composition and duration, post run strong solvent washes and the installation of low adsorption rotor seal and injection path materials fail to remediate carryover problems, then another surrogate peptide must be chosen. In other cases, carryover can be mitigated by such actions, but analysis must be monitored continually to ensure that each run complies with the carryover specification (20% of the average LLOQ peak area for small molecule methods [Citation8,Citation9], 25% recommended for PrD-LC–MS methods [Citation35,Citation36]).
In most regulated bioanalytical laboratories, the analysts monitor and formally document carryover for every run to ensure that observed carryover remains within specification. An example of a worksheet that can be used for in-study carryover documentation is shown in . The advantage of this type of vigilance is that chromatographic carryover issues can be followed over time, allowing pre-emptive actions, which can reduce or eliminate carryover problems before they interfere with a study run.
As described in the legend, the SRM analyte channel peak areas from two matrix blank samples placed in the run immediately after two ULOQ standards are used to calculate carryover, with the mean LLOQ peak area as the denominator. The specification for a passing is that mean carryover for each blank position should be <20% of the mean LLOQ peak area for small molecules [Citation7–9].
The run represented in does pass the literal carryover specification, but the value of 18.9% for the first blank is considered marginal (). As the analyst comments indicate, the marginal carryover value requires some remediation. This might consist simply of changing the autosampler’s rotor seal, as wear and tear can erode surfaces in the flow path making it more likely for carryover to occur. This type of change is considered normal maintenance; and, while it must be documented, it does not require method revalidation. If actions such as modifying the flush solvent or flushing time must be done, then this constitutes a change in the method, and a partial validation will be required [Citation8,Citation9].
While evaluation of study sample runs may show marginally acceptable carryover such as that in , they clearly can affect the acceptability of samples with estimated concentrations BLQ, which might be chosen from the same run. Considering , if a result was chosen from this run with a peak area of 1/3 of the average LLOQ, then the projected carryover could amount to as much as 57% of extraneous peak area contribution to that chromatogram, depending on the sample’s position in the run relative to other high concentration samples.
Analyte stability
Analyte stability also warrants consideration when proposing the use of BLQ data. In validating LC–MS/MS bioanalytical methods for both small and large molecule analytes, stability experiments must be performed [Citation8,Citation9]. The scope of these experiments includes bench top, freeze–thaw, room temperature, extracted sample, autosampler and frozen sample stability testing [Citation8,Citation9]. While it is likely that these stability parameters as tested during validation will remain valid for a reasonable excursion BLQ, this can never be stated with certainty; and the tested properties of the analyte molecule need to be considered carefully when extrapolating. Depending upon the analyte’s molecular stability and chemical properties and/or its tendency to adsorb to the storage containers’ surfaces [Citation25], stability or adsorptive loss may have increased impact in low-level samples, BLQ and well below the tested low-stability QCs, which are prepared at 3× the LLOQ concentration.
In urine samples containing 1.0% Tween 20 (abbreviated T-20 in Table 5) to combat adsorption were spiked with a small molecule analyte at the low- and high-QC levels then stored either at room temperature or at -20°C. Each group was analyzed at 24 and 72h using six replicate assays. While all groups of samples pass the stability criteria (±15% difference from the nominal concentration) [Citation8,Citation9] and yield very reproducible results (<5% RSD within each group), it appears that the low-level QC (3nM) when stored at room temperature shows a declining percentage difference that becomes marginal acceptable(14.2%) at 72h. There is not enough data here to prove that there is an inverse concentration dependence in stability; but there is enough of a message that samples analyzed at sub LLOQ concentrations should be looked at carefully, and some stability verification should be considered. In this assay, the LLOQ is 1nM, such that even a sample measured at half of the LLOQ would be 6× lower in concentration than the tested low-stability QC. Taking a close look at pertinent stability studies, with plans to verify stability near the extrapolated concentration, is necessary in such cases.
Discussion
Summary of possible adverse BLQ effects
In the sections above, several scenarios have been described (aside from regulatory concerns) which, together or in combination, could impact the accuracy and reliability of BLQ quantification of a validated LC–MS/MS bioanalytical assay. This purpose of these scenarios has been to discourage routine sub LLOQ extrapolations, and to encourage PK scientists to view such exercises with great caution, especially where regulated studies are concerned. Those key bioanalytical topics discussed include:
Low signal-to-noise BLQ;
Baseline chemical noise, irregularities and skewing;
Chromatographic interference peaks due to matrix;
Analyte loss by adsorption on surfaces in storage vessels, equipment or injector flow path;
Matrix suppression amplified BLQ;
Effects of specific interfering matrix components present in population or disease state matrix;
Chromatographic interference specific to protein quantification methods using proteolytic digestion and surrogate peptides (PrD-LC–MS);
Amplified effects of chromatographic carryover; and
Stability considerations at lower analyte concentrations.
While these elements have been individually discussed in the body of the paper, the most important considerations will be prioritized and emphasized again below, as they can have high impact on any potential BLQ data.
The importance of absolute sensitivity, S/N
Of all the assay parameters we have discussed, absolute sensitivity is the most fundamental consideration for extending any bioanalytical method below its LLOQ. Clearly, if the S/N of the method is limiting, then this factor dictates the extent of an extrapolation. The shape and structure of the baseline are also an important consideration. As the method is pushed to its lower limits, baseline characteristic such as skewing and undulation can have a significant impact on peak shape and integration, which should also be carefully evaluated.
Special considerations for protein LC–MS/MS methods, PrD-LC–MS
As described above, protein quantification methods employing proteolytic digestion of crude matrix samples with a surrogate peptide (PrD-LC–MS) present special potential BLQ quantification problems, because they typically suffer from cluttered baselines due to the complex mixture of peptides in the matrix digest. These components can limit the LLOQ of the method, and they can certainly interfere with BLQ estimations (). Different problems can occur when a hybrid method is utilized, which first captures the protein analyte from the matrix prior to proteolytic digestion (IC PrD-LC–MS), because many of the same factors that interfere with ligand binding assays can come into play during the immunocapture step [Citation10,Citation35,Citation36]; and they can impact the lower end of the assay’s quantitative range. These effects can be more acute in disease state matrices or those from dosed patients. Spike-recovery (ICE) experiments can provide more specific information about ligand-binding interferences for these methods [Citation10].
Matrix effect & internal standards
Matrix suppression for LC–MS/MS methods is complex and variable [Citation27–32]. In addition to those potential problems described above, special issues may come into play with analog internal standards having different retention times and ionization properties from the analyte [Citation34]. In such cases, differentially eluting suppressing components can alter the internal standard-to-analyte signal ratios, with more dramatic differences and quantitative errors possible in BLQ samples with high matrix to analyte ratios.
Carryover
The importance of carryover effects cannot be overstated [Citation37–39]. When a method has measurable carryover, special care must be taken to avoid errors in BLQ quantification. The use of ‘within range’ incurred sample reanalysis (ISR) samples coupled with blanks to evaluate carryover in sub LLOQ samples can help to demonstrate the magnitude of such effects and any quantification errors that may result ().
Large studies & multiple systems
In cases where the bioanalysis for larger clinical studies is being handled either in-house or by a CRO, there may often be multiple LC–MS/MS systems and multiple analysts performing sample runs for the study. In such cases, both the instruments and analysts are separately qualified for the method by partial validation, but each separate system can display individual performance characteristics. The mass spectrometers, even if the same model, will exhibit performance variations due to their states of tune and cleanliness. Chromatographic systems with the same mobile phase, solvent program, injector and column can show chromatographic differences that depend upon the condition of the column, state of the injector and its rotor seal (carryover), as well as differences in tubing and connections. All these small system differences can combine to generate significant run-to-run variability between systems. As such, critical conditions related to BLQ estimations should be tracked on the specific system that was used to produce the original concentrations leading to the estimation. Carryover data (), baseline noise (S/N), baseline slope and shape, close lying interference peaks and other parameters that are believed to be run specific should be determined using the same system, and any further BLQ verification ( and text below) should also utilize that system.
Post-run verification
The use of extended range ISR exercises
The FDA 2018 Bioanalytical Method Validation Guidance states that “a method should be revalidated in cases where there are extensions of the bioanalytical range” [Citation8]. It is not always practical or possible to confirm an extrapolated value immediately via a validation for extrapolation of only one or a few samples, especially if those extrapolated concentrations are for information purposes only. It does make sense, however, to try to generate some supporting data, even if the specific sample concentrations will be not part of a formal GLP or GCP report. A straightforward way to help verify any estimated value is to perform a type of ‘extended range ISR’ where the assay design and ULOQ are unchanged, but the lower end is extended to include those concentrations that were extrapolated or estimated. If BLQ estimations are supported by this type of ISR, then they can likely be confirmed by validation with some confidence, even if that validation is not immediate.
The general design of a practical experiment that can help to test the validity of any BLQ estimations/extrapolations is shown in .
BLQ standards & QCs that bracket the proposed sub-LLOQ range
As shown in , the displayed data are from a hypothetical study where the PK scientist needed to analyze a specific BLQ sample, and this sample produced an estimated calculated concentration of 5.2ng/ml, about a third of the LLOQ concentration. The sub-LLOQ ISR experiment was designed to rerun the BLQ sample under the exact method used for initial analysis, except to add standards that would bracket its concentration and to add QCs near that concentration to provide monitoring capability. Standards at 3 and 13ng/ml accompanied by duplicate QCs at 6ng/ml were used to achieve this purpose.
Blanks & ‘within range’ ISR samples
Blank samples (not shown on figure) should be placed near the extrapolated ISR sample bracketed by ISR samples from the original run that would have been adjacent to the estimated BLQ sample(s). These samples would serve to evaluate carryover specifically as it impacts the BLQ estimation. Running these additional ‘within range’ ISR samples, using the order of the original run, would also verify that the ‘extended’ method is also working properly within the original validated range while retesting the BLQ sample using the extended range.
Spiked surrogate samples, replicate standards & QCs, & quantitative goals
In some studies, where sample quantities are limited, or where their use is restricted, supporting data can be generated by applying a system such as that shown in , but using ‘surrogate samples’ spiked with analyte at or near the extrapolated BLQ concentration. In such a scenario it might be advisable to use blank prestudy samples or to spike matrix from the study phenotype/disease state to normalize matrix effects. To provide additional precision and accuracy data, the BLQ QCs and standards can be run in more replicates, providing statistics to further support the original estimation. For example, running the extended standards and QCs (standard [ST] and QC in ) in triplicate or quadruplicate, can be used to generate accuracy (mean %RE) and precision (%CV) statistical data, which can help to support (or oppose) verification of the BLQ data as well as future extension of the calibration curve via validation exercises.
A reasonable goal for the analyses of these standards and QCs would be that they produce accuracy specifications in accordance with ISR criteria specified in the guidances [Citation8,Citation9] where two out of three of the ISR samples must yield accuracies within ±20% (30% for protein analytes [Citation35]) of the concentrations from the original run. The analogous goal for BLQ standards and QCs run in replicate would be ±20% accuracy to the nominal concentrations and 20% CV (30% for proteins [Citation35]). These criteria would align with the normal validation specs for an assay LLOQ standard or QC. In any case, the accuracy and precision of these measurements can provide indicators of their usability in PK studies, and they would be prognostic for the success of any potential revalidation. A surrogate sample BLQ analysis has the further advantage that it could be used to provide such feasibility evidence to regulators, allowing them to assess the accuracy and reproducibility of BLQ surrogate test data before any GCP samples are rerun or sub LLOQ estimations made from actual data.
Timing of BLQ verification runs
In smaller GLP or GCP clinical studies, the verification runs described above could be performed simultaneously with the ISR data runs for that study. For larger studies, run over more extended time frames, verification runs should be performed as soon as the need for them is recognized, well before the end of the planned study and associated sample analysis. This is also the appropriate time to contact the regulatory agency to discuss any proposed use of BLQ data in PK calculations.
Typically, ISR studies run in multiple groups spread out over larger clinical studies to ensure that the assay is reproducible and under control at every stage [Citation40]. BLQ verification could be run with any planned ISR group, to include some ‘within range’ ISR samples as described above. The primary reason to run BLQ verification early in the study is to learn whether the BLQ estimates have sufficient accuracy and precision for the intended purpose. If the verification results show otherwise, then it is certainly not worth validating them any further or attempting to use them in any PK exercises.
Revalidation
For regulated studies, the method should be revalidated to include the adjusted range [Citation8,Citation9]. As stated above, performing a BLQ verification as soon as possible after the initial analysis would predict the potential success of any revalidation effort. If any extrapolation is intended, the appropriate regulatory agency should be consulted early on to determine if any such exercises can be conducted and what type of validation support is necessary. Because of the additional effort, reporting and record keeping are necessary for any verification exercise or for the revalidation of a method and subsequent sample analysis; companies must carefully weigh the end result of using BLQ data against required resources (see below).
BLQ extrapolations or estimations applied to PK & PD studies
PK scientists have often made the argument that the use of some BLQ data in PK studies is both justified and necessary, and should not always be omitted from calculations solely because of the regulatory bioanalytical guidances [Citation2,Citation4]. Examples have been published where computational approaches have been successfully used to generate BLQ values in AUC determinations and ‘washout’ of drugs or metabolites [Citation3]. An approach designed by Fang et al. used model predictions to impute BLQ values, and it compared these imputed values with ad hoc values such as LLOQ, LLOQ/2 and zero [Citation5]. Zhou et al. [Citation41] described the use of a Bayesian model to handle BLQ data, and they used a simulation to compare their results with those derived from conventional values, as was done in Fang’s comparisons [Citation5,Citation41]. Their simulation showed that the Bayesian approach was superior to the two ad hoc models [Citation41].
Keizer et al. have studied and compared different methods for simulating BLQ data and estimating BLQ values from actual chromatographic data between the LOD and the LLOQ for use in population PK modeling [Citation3]. While these authors show that simulated data using two different models can be used to replace BLQ values, they also advocate the use of actual BLQ chromatograms with peak heights between the LOD and the LLOQ of the assay [Citation3]. They stressed that the use of both simulated and estimated data produced better results for population PK studies when the original data contained 10% or more BLQ values. They also pointed out that there was an ethical consideration for patient’s well being that required producing the best population PK models possible (containing BLQ concentrations, if necessary) for each study; and they stressed that the techniques they advocated depend upon close cooperation and understanding between the PK scientist and the bioanalytical laboratory [Citation3].
An article by Hecht et al. was published in August of 2018, after the first writing of this manuscript [Citation42]. This article seeks to reopen the dialog about calculating and using BLQ values in PK studies, where such data would improve the quality of PK models. It is a comprehensive paper with many literature references that describes approaches to the use of various empirical and mathematical methods for determining BLQ concentrations and applying them to PK. This paper proposes an experimental technique for determining the LOD and its interday variability using fortified BLQ samples, and then to restrict BLQ extrapolations to concentrations between the LOD and the LLOQ. These authors recommend that the calculation of LOD be incorporated into the validation of each bioanalytical method. They further recommend that, when the proportion of BLQ values in a study is large, samples be re-analyzed after the assay is re-validated with a lower LLOQ [Citation42].
Decisions on the use of BLQ data in regulated clinical studies & conclusion
While any final decisions on the use of BLQ data in a clinical study are made by the study director in collaboration with the PK scientists and the bioanalytical group, there are specific study types where BLQ extrapolations should not be made. These include bioequivalence (BE) and bioavailability (BA) studies, which are very strictly regulated, and where some regulatory agencies have issued specific statements in their study monitoring guide (i.e., FDA Bioresearch Monitoring Program [BIMO]) prohibiting extrapolation or estimation using BLQ values [Citation43]. Studies where PK is the primary end point should also be looked at very carefully and BLQ extrapolations should generally not be done. In cases where extrapolated values are used in modeling and predictions that are only designed to inform the PK scientists and study directors but are not used in support of the filing, there may be exceptions. Generally, where key regulated studies are concerned, the use of data BLQ should be avoided. In situations where there is a compelling need to use BLQ data, this should be done only after coordinated discussions with the regulatory agencies; and these discussions should be initiated early in the process so that the exact data to be used are approved by the regulatory agency and the use of this data is warranted for the proposed PK model. Supporting experiments using spiked BLQ QCs, blanks and standards as described in can also be prepared for presentation to the regulatory agencies without using data from any study samples. During such cooperative discussions, it is expected that exact details of required data submissions (two datasets, methodologies, etc.) would be laid out during the discussion. The appropriate notebooks and records also need to be maintained in GLP/GCP condition along with the extrapolated data. Clearly, the mobilization of additional company time and resources for these efforts must also be an important consideration.
The potential methodological issues with BLQs that have been described here are ones that are commonly encountered in LC–MS/MS bioanalysis; but, as stated above, they are not usually discussed together for their impact on sub-LLOQ estimations. Taking these factors into consideration is important when extrapolating or estimating BLQ values. This process requires close cooperation between the bioanalytical team and the PK scientists. Such collaboration, if it occurs before or very early in the study, can be invaluable in helping to predict the efficacy of extrapolation. It will also facilitate timely action in verifying extrapolations through extended ISR (above) or re-validation of the method with an extended range. In general, the use of BLQ extrapolations for regulated studies is discouraged, given the many bioanalytical factors discussed here that can contribute to inaccuracy and excessive variability. In cases where there is doubt about compliance issues with BLQ extrapolations or estimates, the PK and bioanalytical teams together with the study director should consult with their regulatory agency early in the process.
Future perspective
This paper has detailed the bioanalytical problems that can accompany attempts to estimate or extrapolate study concentrations that are below the validate LLOQ. Its purpose is to elicit caution in doing so and also to encourage early collaboration between the study director, PK scientists, bioanalytical laboratory and the regulatory agencies to assess the need and feasibility to use BLQ data. Of the technical limitations faced by bioanalysts, those of sensitivity, dynamic range and resistance to carryover are among the most important factors preventing methods from covering a wide range of concentrations needed for extensive PK analysis. Matrix effect is another parameter with significant impact on low level measurements. With the current rapid pace of instrument development, a combination of high sensitivity LC–MS/MS systems with very wide dynamic range and HPLCs exhibiting extremely low carryover may be available in the near future. Additionally, improvements and cost reduction in HRMS instrumentation may also provide an effective way to eliminate near isobaric interferences yet provide high sensitivity for routine analyses, especially for protein and peptide methods. These types of improved instruments combined with newer extraction techniques could help to provide methods with sufficient sensitivity and range to include both normal clinical drug levels and very low level concentrations, yielding valid bioanalytical data for PK and modeling calculations that had previously been determined as BLQ.
Table 1. BI XYZ123 specificity in K2-EDTA human plasma concentration, ug/ml
Table 2. The recovery of a protein drug analyte spiked into plasma and urine at 10 and 200ng/ml then analyzed after frozen storage at various times from 4 to 30days after preparation against freshly prepared standards.
Table 3. IC efficiency in healthy, disease state and ADA plasma
Table 4. Carryover evaluation on two blanks immediately following a ULOQ
Table 5. Results of urine storage stability experiments conducted at room temperature and -20°C.
Thispaper describes in detail the elements in the bioanalytical methodology, which can negatively impact estimations or extrapolations of concentrations below the method LLOQ. Below the LLOQ (BLQ) extrapolations for pharmacokinetics (PK) purposes should be avoided for Good Laboratory Practice or Good Clinical Practice studies, but, if considered, they should be first evaluated by the bioanalytical and PK scientists in cooperation with the regulatory agencies.
Background
The current regulatory guidances do not allow reporting of data BLQ.
Extrapolated versus estimated BLQ concentrations.
Discussion of chemical and biochemical factors impacting BLQ accuracy and precision.
Current regulatory considerations.
Bioanalytical & chemical considerations
The support and value of the method validation are summarized.
The relationships between LLOQ, method signal-to-noise and viability of BLQ extrapolation/estimation are discussed.
BLQ bioanalysis will be impacted improved LC–MS/MS instrumentation.
The potential effects of baseline noise, shape and skewing on BLQ estimations are discussed.
Protein/peptide LC/MS quantification often shows severe baseline interference due to complex mixtures in protein digests. These interferences can have high impact on sub LLOQ determinations.
Some analytes, particularly peptides and proteins, exhibit adsorptive effects which can interfere with quantification, especially at very low concentrations (BLQ estimations).
Matrix effects impact many types of LC/MS/MS quantificationthat vary with both the matrix and the extraction type, and the effects are amplified al low concentrations.
Protein LC–MS/MS, particularly thosemethods using predigestion immunocapture, are susceptible to interferences from ligands, antidrug antibodies and other matrix components that can block or inhibit the immunocapture step. These effects can be amplified at sub LLOQ concentrations.
Carry over is eliminated in method development, or it is controlled to comprise <20% of the analyte LLOQ signal. Carryover can be a major problem for BLQ estimations, as its relative contribution to sub-LLOQ signal will be increased.
Analyte stability must be considered at BLQ concentrations, particularly the effect of any adsorption to surfaces during processing or storage, can be exaggerated at very low concentrations.
Discussion
Factors that are known to impact bioanalytical methods, particularly at lower analyte concentrations are reviewed.
Post-run BLQ verification
A method to perform ‘BLQ incurred sample reanalysis’ is proposed. This method can be used with actual samples or with spiked matrix to assess the accuracy and viability of BLQ estimations, and to predict the potential success of a method re-validation using an extended range. Such an exercise using ‘simulated BLQ’ samples and BLQ matrix standards/quality controls can also provide a model of efficacy present in any meetings with the regulatory agencies.
BLQ test simulation can be performed without using study samples; but using spiked samples, quality controls, and STDs in multiple replicates to statistically test precision and accuracy of potential BLQ measurements.Such data may be useful for presentation to regulators without performing reanalysis of study samples.
Any use of BLQ data should be avoided in regulated studies, where possible; but, if it is essential to do so, plans should be discussed with the appropriate regulatory agencies.
The use of BLQdata in bioavailability (BA) and bioequivalence (BE) studies is not permitted by the US FDA.
In all cases, the PK scientists, bioanalysts and clinical scientists should consult with regulators before BLQ data are used in PK models to establish a justification and plan of action for their use.
A short summary is provided of some recent published methods for extrapolating/estimating BLQ values for PK studies.
Decisions on the use of BLQ data in regulated clinical studies & conclusion
Generally, the use of sub LLOQ data is not recommended for regulated studies, especially BA and BE studies.
Close attention must be paid to all of the possible chemical, physical and bioanalytical factors that can impact the assay at low concentrations.
Verification of BLQ data must often be followed by extension of the assay range and revalidation.
Company time and resources for performing, maintaining and documenting potential BLQ data must be carefully weighed whenever such exercises are considered.
When considering BLQ estimations for PK purposes, close collaboration between bioanalysts, PK scientists and the regulatory agencies is recommended.
Acknowledgments
The author would like to thank members of the bioanalytical group at Boehringer-Ingelheim Pharmaceuticals, Ridgefield, CT, USA; the small molecule bioanalytical group at the former Midwest Bioresearch Corp., Evanston, IL, USA; members of the bioanalytical group at Searle Pharmaceutical, Skokie, IL, USA; all of whom he worked closely with on various bioanalytical projects. The author wishes to express special thanks to his former colleagues at the NTG Mass Spectrometry Group, especially Dr J Conboy, under Sciex in Norwalk, CT, USA, where he gained initial experience and focused interest in quantitative MS and bioanalysis.
Financial & competing interests disclosure
The author has no relevant affiliations or financial involvement with any organization or entity with a financial interest in or financial conflict with the subject matter or materials discussed in the manuscript. This includes employment, consultancies, honoraria, stock ownership or options, expert testimony, grants or patents received or pending, or royalties.
No writing assistance was utilized in the production of this manuscript.
References
- Kemper C . The case for and against the release of bioanalytical data below the LLOQ. Presented at: AAPSNational Conference and Exhibition, Denver, CO, USA, 15 November2016.
- Dorababu M . Pharmacokinetic modeling of data with below quantification limit. J. Bioequivalence Bioavailability.4(2), ii–iii (2012).
- Keizer R , JansenR, RosingHet al. Incorporation of concentration data below the limit of quantification in population pharmacokinetic analyses. Pharma. Res. Per.3(2), 1–15 (2015).
- Jusko W . Use of pharmacokinetic data below lower limit of quantitation. Pharm. Res.29(9), 2628–2631 (2012).
- Fang L , PengC, KeC. Estimating area under the curve and relative exposure in a pharmacokinetic study with data below quantification limit. J. Biopharm. Stats.21(1), 66–76 (2010).
- US FDA. Guidance For The Industry: Bioanalytical Method Validation. US FDA, Rockville, USA (2001).
- US FDA. Draft Guidance: Bioanalytical Method Validation. US FDA, Rockville, USA (2013).
- US FDA. Guidance For The Industry: Bioanalytical Method Validation. US FDA, Rockville, USA (2018).
- European Medicines Agency, Committee for Medicinal products for Human Use (CHMP). Guideline on bioanalytical method validation (2011).
- Duggan J , RenB, MaoY, ChenL, PhilipE. LC–MS quantification of protein drugs: validating protein LC–MS methods with predigestion immunocapture. Bioanalysis8(18), 1951–1964 (2016).
- Loos G , Van SchepdaelA, CabooterD. Quantitative mass spectrometry methods for pharmaceutical analysis. Philos. Trans. A Math. Phys. Eng. Sci. A 374, 20150366, 1–25 (2016).
- Applied Biosystems, MDS Sciex, Mass Spectrometry solutions for qualitative and quantitative analysis: best in class LC/MS/MS systems. 114BR20-02, 1–13 (2006).
- AB Sciex, The AB SCIEX Triple Quad™ 6500 and QTRAP® 6500 – a new level of sensitivity. 5780212–01, 1–4 (2012).
- Needham S , ValaskovicG. Microspray and microflow LC–MS/MS: the perfect fit for bioanalysis. Bioanalysis7(9), 1061–1064 (2015).
- Bang D , KangD, MoonM. Nanoflow liquid chromatography–tandem mass spectrometry for the characterization of intact phosphatidylcholines from soybean, bovine brain, and liver. J. Chrom. A1104(1–2), 222–229 (2006).
- Ye W , ZangY, XuYet al. Quantification and pharmacokinetics of alpinetin in rat plasma by UHPLC–MS/MS using protein coupled with dilution approach to eliminate matrix effects. J. Pharm. Biomed. Anal.152, 242–247 (2018).
- Evard H , KruveA, LeioI. Tutorial on estimating the limit of detection using LC–MS analysis, part II: practical aspects. Anal. Chim. Act.942, 40–49 (2016).
- Sheehan T , YostR. What’s the most meaningful standard for mass spectrometry: instrument detection limit or signal-to-noise ratio?Spectroscopy13(4), 16–22 (2015).
- Meyer S , SellepP, BiesC, CianciulliC, WätzigH, MeyerVR. Minimum required signal-to-noise ratio for optimal precision in HPLC and CE. Electrophoresis33(11), 1509–1516 (2012).
- Dolan W . Enhancing signal-to-noise. LCGC28(3), 212–216 (2013).
- Busch K . Chemical noise in mass spectrometry, part 1. Spectroscopy17(10), 32–37 (2002).
- Guo X , BruinsA, CoveyT. Characterization of typical chemical background interferences in atmospheric pressure ionization liquid chromatography–mass spectrometry. Rapid Commun. Mass Spectrom.20, 3145–3150 (2006).
- Guo X , BruinsA, CoveyT, TrotzmullerM, LankmayrE. Alternative reagents for chemical noise reduction in liquid chromatography–mass spectrometry using selective ion-molecule reactions. J. ASMS20, 105–111 (2009).
- Angel T , ArialU, HengelSet al. Mass spectrometry-based proteomics: existing capabilities and future directions. Chem. Soc. Rev.41(10), 3912–3928 (2012).
- Kristensen K , HenriksenJ, AndresenT. Adsorption of cationic peptides to solid surfaces of glass and plastic. PLoS ONE10(5), 1–17 (2015).
- Maes K , SmoldersI, MichotteY, Van EeckhautA. Strategies to reduce aspecific adsorption of peptides and proteins in liquid chromatography–mass spectrometry-based bioanalyses: an overview. J. Chromatogr. A1358, 1–13 (2014).
- Van Eeckhaut A , SarreS, SmoldersI, SarreS, MichotteY. Validation of bioanalytical LC–MS/MS assays: evaluation of matrix effects. J. Chrom. B877, 2198–2207 (2009).
- George R , HaywoodA, KhanS, RadovanovicM, SimmondsJ, NorrisR. Enhancement and suppression of ionization in drug analysis using HPLC–MS/MS in support of therapeutic drug monitoring: a review of current knowledge of its minimization and assessment. Ther. Drug Monit.40(1), 1–8 (2018).
- Panuet P , HunterR, D’SouzaPet al. Biological matrix effects in quantitative tandem mass spectrometry-based analytical methods: advancing biomonitoring. Crit. Rev. Anal. Chem.46(2), 93–105 (2016).
- Fang N , YuS, RonisMJ, BadgerTM. Matrix effects break the LC behavior rule for analytes in LCMS/MS analysis of biological samples. Exper. Biol. Med.240, 488–497 (2015).
- Bonfiglio R , KingR, OlahT, MerkleK. The effects of sample and preparation methods on the variability of the electrospray ionization response for model drug compounds. Rapid Comm. Mass Spec.12(12), 1175–1185 (1999).
- Hall T , SmuksteI, BrescianoKet al. Identifying and overcoming matrix effects in drug discovery and development. In:Tandem Mass Spectrometry – Applications and Principles. PrasainJ ( Ed.). Intech Open, London, UK, 18, 390–419 (2012).
- Ismaiel OA , HalquistMS, ElmamlyMY, ShalabyA, KarnesTH. Monitoring phospholipids for assessment of ion enhancement and ion suppression in ESI and APCI LC/MS/MS for chlorpheniramine in human plasma and the importance of multiple source matrix effect evaluations. J. Chrom. B875(2), 333–343 (2008).
- Vogeser M , SegerC. Pitfalls associated with the use of liquid chromatography–tandem mass spectrometry in the clinical lab. Clin. Chem.56(8), 1234–1244 (2010).
- Jenkins R , DugganJX, AubryAet al. Recommendations for validation of LC–MS/MS bioanalytical methods for protein biotherapeutics. AAPS J.17(1), 1–16 (2015).
- Duggan J , VazvaeiF, JenkinsR. Bioanalytical method validation considerations for LC–MS/MS assays of therapeutic proteins. Bioanalysis7(11), 1389–1395 (2015).
- Hughes N , WongE, FanJ, BajajN. Determination of carryover and contamination for mass spectrometry-based chromatographic assays. AAPS J.9(3), E353–E360 (2007).
- Valllano P , ShigartsS, WoolfE, MatuszuskiB. Elimination of autosampler carryover in a bioanalytical HPLC–MS/MS. J. Pharm. Biomed. Anal.36, 1073–1078 (2005).
- Hill M , SmithG. Evaluation and elimination of carryover and/or contamination. In: Handbook of LC–MS Bioanalysis: Best Practices, Experimental Protocols, and Regulations. LiW, ZhangJ, TseF (Eds).J Willey and Sons, Hoboken, NJ, USA, 21, 259–273 (2013).
- Fluhler E , VazvaeiF, SinghaiPet al. Repeat analysis and incurred sample reanalysis: recommendation for best practices and harmonization from the Global Bioanalysis Consortium Harmonization Team. AAPS J.16(6), 1167–1174 (2014).
- Zhou H , HartfordA, TsaiK. A Bayesian approach for PK/PD modeling with PD data below limit of quantification. J. Biopharm. Stat.22(6), 1220–1243 (2012).
- Hecht M , VeigureR, CouchmanLet al. Utilization of data below the analytical limit of quantitation in pharmacokinetic analysis and modeling: promoting interdisciplinary debate. Bioanalysis10(15), 1229–1248 (2018).
- US FDA. Compliance program 7348.809, bioresearch monitoring (BIM0). 1–59 (2018).