
ABSTRACT
Aim: Two separate LC–MS/MS assays were developed to quantitate sulfatides and lysosulfatide in human cerebrospinal fluid (CSF). Materials & methods: Lysosulfatide and the 15 most abundant sulfatide species were quantitated by LC–MS/MS using artificial CSF as surrogate matrix to prepare calibration curves. Results: Validation criteria were met (linear range: 0.02–1.00 μg/ml sulfatides [0.02–1.00 ng/ml lysosulfatide]); accuracy/precision were within ±15%. CSF from 21 children with metachromatic leukodystrophy had significantly higher sulfatide and lysosulfatide concentrations than CSF from 60 healthy children (p < 0.0001). Worse motor function correlated with higher CSF sulfatide (p = 0.0087) and lysosulfatide (p = 0.0034) levels. Conclusion: These assays, validated in patients with metachromatic leukodystrophy, may aid the clinical assessment of therapeutic responses.
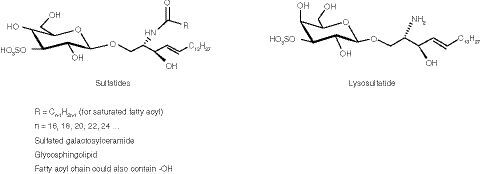
Metachromatic leukodystrophy (MLD; OMIM 250100) is a rare, autosomal recessive, lysosomal storage disease, with an estimated prevalence of one in 40,000–170,000 in different populations [Citation1,Citation2]. MLD is caused by deficient activity of arylsulfatase A (ASA; EC 3.1.6.8), which normally acts to catalyze the first step in the degradation of sulfatides (the substrates of ASA) [Citation3]. Sulfatides occur as several different molecular species, depending on the length and composition of the acyl group, as well as in a deacylated form called lysosulfatide (). Without functional ASA, there is an accumulation of sulfatides and lysosulfatide in the CNS and the PNS of patients with MLD, leading to demyelination and axonal loss [Citation3]. For MLD to be diagnosed, both ASA deficiency in leukocytes and elevated sulfatide concentrations in urine must be demonstrated.
The natural course of MLD involves severe and progressive motor and cognitive dysfunction and eventually premature death [Citation3]. Three clinical forms of MLD (late-infantile, juvenile and adult) have been described based on the age of onset; the most common of these is late-infantile MLD, which accounts for 40–50% of cases [Citation4]. The first symptoms of late-infantile MLD typically occur in the first 30 months of life, with patients usually progressing to a paralytic state within 1 or 2 years. Patients may live in this state for several years, but ultimately die prematurely [Citation5,Citation6]. Patients with juvenile MLD usually present with symptoms between 2.5 and 16 years of age and disease progression is typically slower and more variable than in the infantile form [Citation5,Citation6].
There are no approved pharmacological therapies for patients with MLD. Hematopoietic stem cell transplantation has been reported to delay disease progression in some patients with juvenile MLD; however, it has shown little benefit in symptomatic patients or those with late-infantile MLD [Citation6,Citation7]. Intravenous delivery of enzyme replacement therapy has been used successfully to treat patients with other lysosomal storage diseases, including mucopolysaccharidosis II [Citation8]. However, intravenously administered proteins are not expected to cross the blood–brain barrier in therapeutic quantities, and thus are not anticipated to alleviate symptoms that are due to CNS pathology [Citation9]. Consistent with this expectation, a Phase I/II clinical trial of intravenously administered recombinant human ASA (rhASA; HGT-1111, previously known as Metazym) did not identify an effect of treatment on clinical markers of disease (e.g., sulfatides and lysosulfatide) in patients with late-infantile MLD (NCT00633139) [Citation10]. This observation prompted the investigation of intrathecal delivery of rhASA (IT rhASA; SHP611, now TAK-611) as an alternative therapeutic option for children with MLD in a Phase I/II clinical study (NCT01510028), the results of which suggest a slowing of motor function decline in some patients treated with this drug [Citation11]. Pharmacokinetic modeling analyses suggest rapid distribution of rhASA into a putative brain tissue compartment after administration [Citation12].
A key aim of the Phase I/II clinical trial is measuring the pharmacodynamic effects of IT rhASA in children with MLD, most notably on sulfatide and lysosulfatide concentrations. LC–MS/MS is the method of choice for quantitating compounds in complex sample matrix, owing to superior sensitivity and specificity. Most LC–MS/MS-based assays for the quantification of sulfatides and/or lysosulfatide have been developed for urine or blood matrices for screening of patients with MLD [Citation13–15]. However, given the neurodegenerative pathology of MLD, measuring these biomarkers in cerebrospinal fluid (CSF) is potentially of greater interest for monitoring disease progression and effects of therapeutic interventions. One LC–MS/MS-based assay has been reported for the detection of sulfatides (but not lysosulfatide) in CSF samples from patients with Alzheimer’s disease, and was not reported in accordance with the US FDA guidelines for the validation of bioanalytical assays [Citation16].
We present here the development and validation of CSF sulfatides and lysosulfatide assays for use in the Phase I/II trial of IT rhASA in children with MLD. The CSF sulfatide and lysosulfatide levels measured using these assays in children with MLD are compared with CSF samples from children without MLD, and the potential correlations between sulfatide and lysosulfatide levels and the degree of motor dysfunction in these patients are explored.
Materials & methods
Materials
Sulfatides (from bovine spinal cord), C18:0-D3-sulfatide (internal standard [IS] for sulfatides [sulf-IS]), lysosulfatide and N-acetyl-sulfatide (IS for lysosulfatide [lyso-IS]) were purchased from Matreya (PA, USA). Human CSF (hCSF) was purchased from BioIVT (NY, USA) and artificial CSF (aCSF) was purchased from Harvard Apparatus (MA, USA). Hexadecylpyridinium chloride monohydrate (HDP) was purchased from Sigma-Aldrich (MO, USA). All other chemicals used were high-grade, standard preparations.
LC–MS/MS conditions
All LC–MS/MS analyses were conducted on an API 5000 (MDS, Sciex, ON, Canada) mass spectrometer. The column used for both assays was a Supelco Ascentis Express C8 (2.1 × 50 mm, 2.7 μm particle) with a guard column packed with the same material (2.1 × 5 mm). The injection volume was 10 μl.
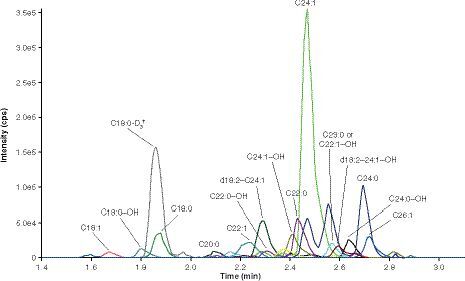
For the sulfatides assay, mobile phase A comprised 20 mM ammonium formate with 0.1% formic acid and mobile phase B comprised a 1:1 (v:v) mix of methanol and acetone. The column was maintained at 60°C with a flow rate of 0.4 ml/min. The gradient elution was initiated at 80% B, increasing to 90% B at 2.50 min and then 100% B at 3.05 min, before returning to 80% B at 3.60 min for the remainder of the run (total run time of 4.00 min). Sulfatides eluted at 1.48–2.70 min () and sulf-IS eluted at 1.75 min. The mass spectrometer was operated in negative ion mode using multiple reaction monitoring (MRM), with mass transitions of different sulfatides as precursor ions to m/z 97.0 as product ions (), and m/z 809.6→97.0 for sulf-IS.
For the lysosulfatide assay, mobile phase A comprised aqueous 0.1% formic acid and mobile phase B comprised a 1:1 (v:v) mix of isopropyl alcohol (IPA) and acetone. The column was maintained at 60°C with a flow rate of 0.5 ml/min. The gradient elution was initiated at 40% B, increasing to 90% B at 2.50 min and then 100% B at 2.75 min, before returning to 40% B at 3.75 min for the remainder of the run (total run time of 4.00 min). Lysosulfatide eluted at 1.61 min and lyso-IS eluted at 1.85 min. The mass spectrometer was operated in negative ion mode using MRM with mass transitions of m/z 540.3→96.9 for lysosulfatide and m/z 582.4→96.9 for lyso-IS.
Instrument parameters for the sulfatides assay (and the lysosulfatide assay, unless otherwise specified) were set as follows: collision-activated dissociation gas setting 6, dwell time 20 ms (lysosulfatide assay, 50 ms), ion spray voltage -4500 V, temperature 500°C, curtain gas 20 units, ion source gas (1 and 2) 70 units, collision energy from -100 to -90 eV for sulfatides and -90 eV for sulf-IS (lysosulfatide assay: -72 eV [lysosulfatide] and -110 eV [N-acetyl-sulfatide]), collision exit potential -16.5 V (lysosulfatide assay: -15.0 V), declustering potential -225 V (lysosulfatide assay: -255 V) and entrance potential -10 V.
Preparation of calibration standards
Sulfatide assay calibration stock solution was prepared by dissolving 5 mg sulfatides in 3.20 ml DMSO in a glass vial, followed by the addition of 0.80 ml water with mixing. The stock was stored at -20°C in a glass container. Lysosulfatide assay calibration stock solution was prepared by dissolving 1 mg lysosulfatide in 1.0 ml DMSO, followed by the addition of 0.250 ml water with mixing. Calibration working solutions were prepared by diluting stock solution in aqueous 80% DMSO to concentrations of 0.4, 0.8, 1.5, 3.0, 5.0, 10.0, 16.0 and 20.0 μg/ml sulfatides (ng/ml lysosulfatide) in glass vials, and were stored at -20°C in glass containers. Assay calibration standards were prepared fresh on the day of each run in 1.5 ml polypropylene microcentrifuge tubes, by diluting each working solution 20-fold in aCSF containing 1.5 mg/ml HDP to minimize nonspecific binding, to reach final calibration standard concentrations of 0.02, 0.04, 0.075, 0.150, 0.250, 0.500, 0.800 and 1.00 μg/ml sulfatides (ng/ml lysosulfatide).
Preparation of quality controls
Sulfatide and lysosulfatide assay stock solutions for quality controls (QCs) were prepared and stored as per the calibration standard methods above. Working QC solutions were prepared by diluting stock solution in aqueous 80% DMSO to concentrations of 0.4, 1.2, 6.0, 15.0 and 75.0 μg/ml sulfatides (ng/ml lysosulfatide) in glass vials, and were stored at -20°C in glass containers. QCs were prepared by diluting each working solution 20-fold in hCSF containing 1.5 mg/ml HDP, to final concentrations of 0.020 (LLOQ QC), 0.060 (low QC), 0.30 (mid QC) and 0.75 (high QC) μg/ml sulfatides (ng/ml lysosulfatide) and were stored in 1.5 ml polypropylene microcentrifuge tubes at -70°C.
Preparation of ISs
IS stock solutions were prepared by dissolving 1 mg IS (sulf-IS or lyso-IS) in 1.00 ml DMSO in a glass vial and adding 0.250 ml water with mixing, and were stored at -20°C in glass containers. IS working solutions were prepared by diluting the stock solutions to a final concentration of 50 ng/ml, using 0.20 mg/ml HDP in IPA as the diluent, and were stored at 4°C in glass containers.
Protein precipitation extraction & assay procedures
CSF sulfatides assay
A 100 μl aliquot of sulf-IS working solution was added to each well in a 1 ml, 96-well Nunc plate (prep plate), except for control blank wells, to which 100 μl of 0.2 mg/ml HDP in IPA (neat solution) was added. Aliquots of 100 μl of the sample preparations (calibration standards, QCs and test samples [see test sample preparation details below]) were then added to wells containing sulf-IS working solution. To each well, 200 μl of 1:1 (v:v) water and IPA (sample diluent) was then added. The plate was capped, shaken at 2500 r.p.m. for 5 min and centrifuged at 2250 g for 5 min. The plate was then loaded onto the Hamilton Star robot, which transferred 250 μl of each sample to a clean 1 ml, 96-well Nunc plate (analysis plate). The analysis plate was then capped and placed in the autosampler at a temperature of 0–10°C for analysis.
CSF lysosulfatide assay
The assay procedure for the CSF lysosulfatide assay was the same as for the CSF sulfatides assay, except that aliquots of 25 μl of neat solution (for control blanks), 25 μl of lyso-IS and 275 μl of sample diluent were used.
Assay validation
The fit-for-purpose assays were validated following FDA guidance for bioanalytical assay method validation [Citation17].
Calibration curve
Calibration standards were analyzed in duplicate at each concentration during each of three accuracy and precision runs that were performed. The concentration of each calibration standard was back-calculated using the standard curve generated from all the calibration standards. Accuracy and precision for each calibration standard were assessed in terms of the degree of deviation of the back-calculated concentration from the intended target concentration; deviations of ≤15% were deemed acceptable.
Assessment of carryover
Analyte and IS carryover were examined in each run by injecting two control blanks after the second replicate of the highest calibration standard and comparing these with the residual peak area in the LLOQ calibration standard. Potential interference of each analyte with other analytes and with the IS was evaluated by injecting a matrix sample with analyte only at the ULOQ. Interference responses for this injection at the retention times of the other analytes and the IS were then compared with those observed for the other analytes that were injected at the LLOQ, and the IS that was injected at the spiking concentration. Potential interference of the IS with analytes was evaluated by assessing interference responses following injection of a matrix sample containing IS only at the spiking concentration with analytes at the LLOQ.
Accuracy & precision
Intrarun and inter-run accuracy and precision were evaluated in three runs. Six replicates of the LLOQ QC, low QC, mid QC and high QC samples in hCSF were included in each run. Endogenous sulfatide (ESULF) concentrations and endogenous lysosulfatide (ELYSO) concentrations were determined for each respective hCSF lot used and then added to target concentration values before calculating accuracy and precision estimates for QCs.
Matrix effects
LLOQ reproducibility in the matrix was assessed by comparing results obtained from LLOQ samples prepared with different lots of hCSF (i.e., from different donors) and different lots of aCSF. ESULF and ELYSO concentrations were determined for each respective hCSF lot and then added to target concentration values before calculating accuracy and precision estimates for LLOQ reproducibility in hCSF.
For the determination of the matrix factor, extractions were performed on six different lots of hCSF (from different donors) and aCSF. Two samples from each extracted lot were then spiked with analyte (one at low QC and one at high QC) and IS. To calculate the matrix factor, mean responses from the spiked samples (corrected for ESULF or ELYSO concentrations for the respective hCSF lots used and normalized to IS) were compared with IS-normalized mean responses from six injections of neat solution containing analyte and IS at the same concentrations.
Extraction efficiency
To determine the extraction efficiency for analyte and IS following the protein precipitation extraction, the mean instrument response for analyte and IS spiked into matrix prior to extraction was compared with the mean instrument response for analyte and IS spiked into matrix after extraction. Analyte extraction efficiency was evaluated at three concentrations to determine if there was a concentration bias.
Matrix stability & reinjection reproducibility
Matrix stability was evaluated by subjecting QCs (high and low; n = 6 each) prepared in hCSF and aCSF to the freeze–thaw, bench-top and long-term storage conditions that would be used for test samples. Reinjection reproducibility was determined by reinjecting previously acceptable calibration standards and QCs that had been stored under specified test conditions. The QC concentrations of the reinjected samples were then calculated from the reinjected calibration curve and compared with theoretical concentrations.
Analysis of test CSF samples
CSF samples from 21 children with MLD (aged <12 years; symptom onset at/before 30 months of age; Gross Motor Function Measure-88 [GMFM-88] score ≥35) were collected via lumbar puncture at the baseline assessment of a Phase I/II clinical trial (NCT01510028), which was approved by the institutional review board and/or independent ethics committee at each participating site [Citation11]. In total, 24 children were included in the trial; however, for three of these children, it was not possible to obtain sufficient quantities of CSF for analysis. Written informed consent was provided by the parents or legally authorized representatives of the children who provided samples. CSF samples were also obtained from 60 children without MLD (‘controls’) to establish the normal concentration range for sulfatides and lysosulfatide. These control samples, provided by the Children’s National Medical Center, DC, USA, were biobanked excess lab samples. It was not practicable to obtain informed consent for the use of these samples, as they were not obtained specifically for the purposes of the current study. A waiver of consent for these samples was, however, approved by the institutional review board.
Test samples stored at -70°C were thawed at 37°C in a water bath, mixed using a vortex and then allowed to come to room temperature (RT). An aliquot of 0.975 ml of each sample was then added to 0.025 ml of aqueous 60 mg/ml HDP in a 1.5 ml polypropylene microcentrifuge tube and mixed in a plate shaker at 2500 r.p.m. for 1.5 min. Samples were then sonicated for 5 min before being assayed.
Analysis software & statistics
LC–MS/MS data were acquired, and chromatographic peaks integrated, using Analyst (version 1.4.2) software. Following analytical assessments, data were imported into Watson LIMS (version 7.4.2) software to perform regression analysis and to calculate sulfatide and lysosulfatide concentrations. Precision and accuracy estimates for the assay validation runs were calculated as percentage CV (%CV) and percentage bias (%bias) values, respectively. Statistical comparisons of CSF sulfatide and lysosulfatide levels in children with MLD with those in children without MLD were evaluated using two-sample t-tests. Spearman’s rank-order correlation coefficient was used to test for correlations of CSF sulfatide and CSF lysosulfatide levels with GMFM-88 scores [Citation18] in children with MLD.
Results & discussion
Analytical strategy
We aimed to develop fit-for-purpose methods for measuring sulfatides and lysosulfatide in hCSF, for use in clinical trials in patients with MLD. Due to the complex nature of the analytes, special considerations were taken to ensure the robustness of the assays. First, as sulfatides and lysosulfatide are endogenous compounds, aCSF was used as a surrogate matrix for the preparation of calibration curves, whereas QCs prepared in hCSF were used to assess the accuracy and precision of the assays. Second, both sulfatides and lysosulfatide are highly hydrophobic and tend to bind to containers. Therefore, HDP, a cationic quaternary ammonium compound, was added to CSF prior to sample preparation because this was found to inhibit nonspecific container-binding behavior observed during assay development. Third, sulfatides are a mixture of compounds with variable carbon chain lengths, oxidation states and numbers of double bonds. Only the 15 most abundant were summed for quantification, although the method was developed to monitor 19 sulfatide species of potential interest. Sulfatide concentrations were calculated with a 1/x linear regression (range: 0.0200–1.00 μg/ml) using C18:0-D3-sulfatide as the IS. Lysosulfatide concentrations were calculated with a 1/x2 linear regression (range: 0.0200–1.00 ng/ml) using N-acetyl-sulfatide as the IS.
LC conditions & chromatogram peak detection
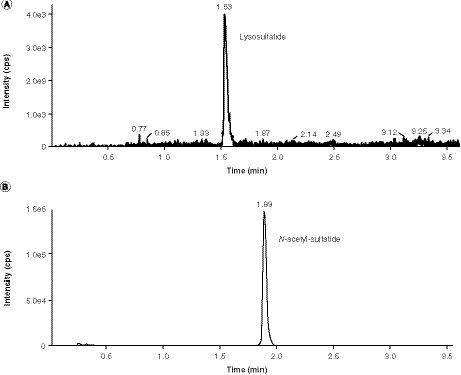
An API 5000 was operated in the MRM mode under optimized conditions for detection of sulfatides, C18:0-D3-sulfatide, lysosulfatide and N-acetyl sulfatide negative ions formed by electrospray ionization. Sulfatides and lysosulfatide were quantified separately owing to the presence of trace amounts of lysosulfatide in the sulfatide reference standard. As a result of the large difference in abundance (three orders of magnitude) between the two analytes, this trace contamination would significantly affect the accuracy of lysosulfatide measurements in a multiplex assay. Example chromatograms are presented in for the CSF sulfatides assay, and for the CSF lysosulfatide assay for samples at the LLOQ level. At the LLOQ level, sulfatide species C18:1 (m/z 804) and C20:0 (m/z 834) were generally very low or undetectable, whereas sulfatide species C18:0-OH (m/z 822), C22:1 (m/z 860), C22:0-OH (m/z 878), d18:2–C24:1 (m/z 886) and d18:2–24:1-OH or d18:1–25:1 (m/z 902) were generally at low but measurable levels. Sulfatide species C24:1 (m/z 888) typically had the most intense peak. Chromatogram peaks for the remaining sulfatides (C18:0 [m/z 806], C22:0 [m/z 862], C23:0 or C22:1-OH [m/z 876], C24:0 [m/z 890], C24:1-OH [m/z 904], C24:0-OH [m/z 906] and C26:1 [m/z 916]), lysosulfatide, sulf-IS and lyso-IS were all within a reasonable, detectable range.
The 15 sulfatide species at the LLOQ (0.020 μg/ml) that comprised the assessment of total sulfatide levels from samples.
†Internal standard (C18:0-D3-sulfatide) at the spiking concentration (50 ng/ml).
cps: Counts per second.
(A) Lysosulfatide at the LLOQ (0.02 ng/ml). (B) Internal standard (N-acetyl-sulfatide) at the spiking concentration (50 ng/ml).
cps: Counts per second.
Assay validation results
Calibration curve
We prepared calibration standards in aCSF because it closely matches the electrolyte concentrations in hCSF but does not contain any of the analytes of interest or the ISs, or factors that could cause interference peaks. Representative calibration curves are presented in for the CSF sulfatides assay and the CSF lysosulfatide assay.
(A) First run of cerebrospinal fluid sulfatides assay. (B) First run of cerebrospinal fluid lysosulfatide assay.
IS: Internal standard.
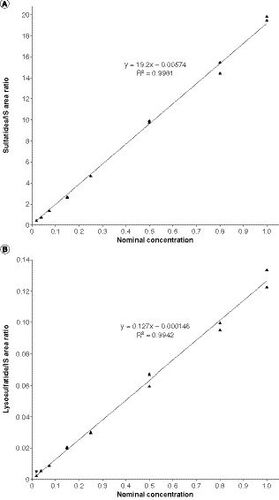
For both assays, a linear relationship was observed between the peak area ratios of analyte/IS and the target analyte concentrations. For the CSF sulfatides assay, the calibration curve for the first run had a best-fit equation of y = 19.2x - 0.00574 and R2 = 0.9981. The %bias for back-calculated mean sulfatide concentrations ranged from -3.6 to 8.5%, and the %CV ranged from 2.6 to 6.6%. For the CSF lysosulfatide assay, the calibration curve for the first run had a best-fit equation of y = 0.127x - 0.000146 and R2 = 0.9942. The %bias for back-calculated mean lysosulfatide concentrations ranged from -3.5 to 6.0%, and the %CV ranged from 3.0 to 9.7%. These values were well within the accuracy and precision parameters specified in the acceptance criteria.
Analyte and IS carryover in each run were also within acceptable parameters for both assays, with no peaks greater than 20% (5% for IS) of the LLOQ calibration standard observed after the second injection of the highest calibration standard. In addition, no significant interference was observed for the analyte-only and IS-only runs.
Assay accuracy & precision
Accuracy and precision data for all QCs passed the acceptance criteria after accounting for ESULF and ELYSO levels in hCSF (). For the CSF sulfatides assay, intrarun accuracy ranged from -5.5 to 1.6% (inter-run accuracy: -6.7 to 5.2%) and intrarun precision ranged from 2.2 to 5.7% (inter-run precision: 1.8–3.9%). For the CSF lysosulfatide assay, intrarun accuracy ranged from -3.3 to -10.4% (inter-run accuracy: -4.2 to -2.8%) and intrarun precision ranged from 1.7 to 12.7% (inter-run precision: 5.2–14.3%).
Extraction efficiency
The comparison of mean peak ratios from samples spiked with analyte and IS before protein precipitation extraction with those spiked after protein precipitation extraction (Supplementary Table 1) indicated good extraction efficiency for sulfatides (range: 94–103%) and lysosulfatide (range: 93–102%). Good extraction efficiency was also demonstrated for both ISs (sulf-IS: 83%; lyso-IS: 103%).
Matrix effects
For the CSF sulfatides assay, the ESULF-corrected, IS-normalized matrix factor test for hCSF was 1.00 for the low QC and 1.03 for the high QC. Similar results were observed for matrix factor in aCSF (low QC: 1.10; high QC: 1.13). The ELYSO-corrected, IS-normalized matrix factor test for hCSF for the CSF lysosulfatide assay was 0.894 for the low QC and 0.846 for the high QC. Similar results were observed for matrix factor in aCSF (low QC: 0.818; high QC: 0.853). Overall, these results indicate that the impacts of endogenous matrix compounds in terms of ion suppression or enhancement during LC–MS/MS are minimal for both the CSF sulfatides assay and the CSF lysosulfatide assay.
It is important to note potential limitations of the C18:0-D3-sulfatide standard used in the sulfatides assay, which is the only IS available for quantification of different sulfatide species. Specifically, non-C18 species will not comigrate with this IS, and may therefore be subject to ion suppression issues. In addition, the response factors in the MS/MS for one sulfatide species are not necessarily the same as for other species. However, the use of a mixture of sulfatides as reference materials for the calibration curve and QCs partially mitigates these limitations, and overall, the assay displayed acceptable precision and accuracy and was fit for its intended purpose.
Matrix stability & reinjection reproducibility
Bench-top matrix stability, long-term matrix stability and freeze–thaw stability were evaluated for both aCSF and pooled hCSF matrices. Bench-top stability was demonstrated for 24 and 23 h at RT for sulfatides and lysosulfatide assays, respectively, and long-term matrix stability was demonstrated at 84 and 101 days at -70°C temperature for sulfatides and lysosulfatide assays, respectively. Freeze–thaw matrix stability (six cycles of being stored at -70°C for at least 12 h and then thawed to RT) was demonstrated in hCSF for both the sulfatides and lysosulfatide assays. Test runs for freeze–thaw stability in aCSF, however, failed to meet acceptance criteria for the CSF sulfatides assay, supporting preparation of calibration standards fresh on the day of each run (as per the protocol). Reinjection reproducibility was demonstrated for 101 and 113 h at 1–8°C for the CSF sulfatides assay and the CSF lysosulfatide assay, respectively.
Analysis of MLD & control samples
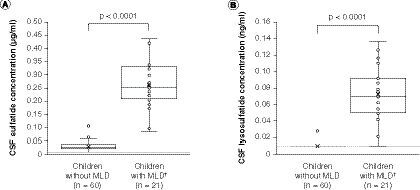
The concentration of sulfatides and lysosulfatide in CSF was determined in 21 children with MLD, and in a control group of 60 children without MLD (), using the assay methods described above. The CSF samples with analyte concentrations calculated as being below the LLOQ were considered below the limit of quantification (BLQ) and were reported as half of the LLOQ value, in other words, 0.0103 μg/ml (sulfatides) and 0.0103 ng/ml (lysosulfatide) after factoring in the volume change in final solution. The mean CSF sulfatide level in children with MLD was 0.262 μg/ml (range: 0.0831–0.436 μg/ml). This was significantly higher (p < 0.0001) than the mean concentration of 0.031 μg/ml (range: 0.0103–0.113 μg/ml) observed in the 60 samples from children without MLD, of which 13 were BLQ. CSF lysosulfatide levels were also significantly higher (p < 0.0001) in children with MLD (mean: 0.072 ng/ml; range: 0.0103–0.137 ng/ml) than in children without MLD (mean: 0.011 ng/ml; range: 0.0103–0.0277 ng/ml). The lysosulfatide level was BLQ in 59 of the 60 samples for children without MLD and only one of the 21 children with MLD. It is worth noting that the proportion of CSF samples that were BLQ in children without MLD was substantially higher for the lysosulfatide assay than for the sulfatides assay. Thus, although it cannot be confirmed from the current dataset, the fold-difference in CSF lysosulfatide levels between children with MLD and children without MLD may be larger, relative to the fold-difference in CSF sulfatide levels, than is indicated by our results.
(A) Sulfatides. (B) Lysosulfatide. Sulfatide concentrations were below the limit of quantification, defined as half of the LLOQ value (0.0103 μg/ml; panel A dashed line) after factoring in the volume change in final solution, in 13 of the 60 CSF samples from children without MLD, and lysosulfatide concentrations were below the limit of quantification (0.0103 ng/ml; panel B dashed line) in 59 of the 60 CSF samples from children without MLD, skewing the distribution of these box and whisker plots. For children with MLD, none of the CSF sulfatide concentrations were below the limit of quantification and one CSF lysosulfatide concentration was below the limit of quantification. The data points above the plot for children without MLD may be considered outliers; however, an outlier analysis was not performed. P-values are for two-sample t-tests for differences between mean values (denoted as crosses) between children without MLD and children with MLD.
†Concentrations for children with MLD are baseline concentrations.
CSF: Cerebrospinal fluid; MLD: Metachromatic leukodystrophy.
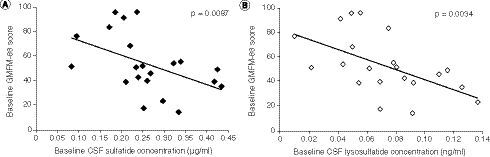
Within the MLD group, higher baseline CSF sulfatide levels and higher baseline lysosulfatide levels were significantly correlated with worse motor function, indicated by lower GMFM-88 scores (correlation coefficient for CSF sulfatides: -0.56; p = 0.0087; correlation coefficient for CSF lysosulfatide: -0.61; p = 0.0034) ().
(A) Baseline CSF sulfatide levels. (B) Baseline CSF lysosulfatide levels. P-values are based on Spearman’s correlation tests.
CSF: Cerebrospinal fluid; GMFM-88: Gross Motor Function Measure-88.
To our knowledge, this is the first study to report and to compare LC–MS/MS assay-derived CSF sulfatide and CSF lysosulfatide levels in children with MLD with those in children without MLD. In addition, we are aware of only one other study that has assessed LC–MS/MS assay-derived sulfatide and lysosulfatide levels in relation to the degree of motor dysfunction in children with MLD [Citation19]. In that study, neither sulfatide nor lysosulfatide levels derived from sural nerve tissue samples, nor CSF sulfatide levels determined by immunostaining, were significantly correlated with GMFM-88 scores. This may be due to the sample type or assay methods used, and/or the smaller sample size compared with our study (n = 13 vs n = 21), among other potential factors.
Conclusion
In this report, we described LC–MS/MS assays for quantitative measurement of sulfatides and lysosulfatide in clinical CSF samples. Both assays were simple and robust and were validated in accordance with regulatory guidelines. The data reported here indicate that these LC–MS/MS assays can reliably determine CSF sulfatide and lysosulfatide levels in children with MLD. These methods are being applied to clinical studies to assess the response to therapeutic intervention.
Future perspective
The assays described here have already been successfully applied in a Phase I/II clinical study in patients with MLD (NCT01510028) [Citation11] to support assessments of disease progression and therapeutic efficacy, and their use in a future Phase IIb trial in patients with MLD (NCT03771898) is also planned. In addition, the current method is capable of quantifying individual molecular species of sulfatides, allowing for further data mining to explore whether specific sulfatide species may be more sensitive disease markers or indicators of drug efficacy.
Table 1 Mass transition and elution times for the 19 sulfatide species monitored by the cerebrospinal fluid sulfatides assay.
Table 2 Intra- and interday accuracy (%bias) and precision (%CV) using the sulfatide and lysosulfatide quality controls in human cerebrospinal fluid.
Executive summary
Patients with metachromatic leukodystrophy (MLD) have deficient arylsulfatase A (ASA) activity, causing sulfatides and lysosulfatide (the substrates of ASA) to accumulate in the CNS and PNS.
Two separate LC–MS/MS assays were developed and validated for the quantification of human cerebrospinal fluid (CSF) sulfatides and CSF lysosulfatide, to investigate the effects on their concentrations of intrathecally administered recombinant human ASA, in children with MLD participating in a Phase I/II clinical trial.
The assays used artificial CSF as surrogate matrix to decrease the LLOQ.
Using these assays, significantly higher CSF sulfatide and lysosulfatide levels were observed in children with MLD than in children without MLD, and higher CSF sulfatide and lysosulfatide levels were significantly correlated with worse motor function in children with MLD.
Ethical conduct of research
The authors state that they have obtained appropriate institutional review board approval or have followed the principles outlined in the Declaration of Helsinki for all human or animal experimental investigations. In addition, for investigations involving human subjects, informed consent has been obtained from the participants involved.
Supplemental Material
Download MS Word (162.5 KB)Supplemental Material
Download MS Word (14.1 KB)Acknowledgments
The authors thank all study participants and their caregivers, the study centers and the clinical teams for their participation in the study. The authors acknowledge Adeline Vanderver and the Children’s National Medical Center, Washington, DC, USA, for providing the 60 control cerebrospinal fluid samples used in the sulfatide and lysosulfatide assays. The authors would also like to thank James Wu for his contribution to the statistical analysis and Margaret Wasilewski for her contributions throughout this study.
Supplementary data
To view the supplementary data that accompany this paper please visit the journal website at: www.tandfonline.com/doi/suppl/10.2144/000112170
Financial & competing interests disclosure
This analysis and the Phase I/II study (NCT01510028) were funded by Shire, a member of the Takeda group of companies. H Cao and G Zhang were employees of Shire (a Takeda company) at the time of this analysis and are currently employees of Alnylam Pharmaceuticals. G Zhang is a Takeda stock owner. L Jacobsen was an employee of Shire (a Takeda company) at the time of this analysis, is a Takeda stock owner, and is currently an employee of AVROBIO. J Wu is an employee of Shire (a Takeda company) and a Takeda stock owner. The authors have no other relevant affiliations or financial involvement with any organization or entity with a financial interest in or financial conflict with the subject matter or materials discussed in the manuscript apart from those disclosed.
Writing assistance was utilized in the production of this manuscript. Medical writing support was provided by M Molloy-Bland of Oxford PharmaGenesis, Melbourne, Australia, and funded by Shire, a member of the Takeda group of companies.
Data sharing statement
The authors certify that this manuscript reports the secondary analysis of clinical trial data that have been shared with them, and that the use of this shared data is in accordance with the terms (if any) agreed upon their receipt. The source of this data is NCT01510028. Shire (a Takeda company) does not plan to share data supporting the results reported in this article as there is a reasonable likelihood that individual patients could be re-identified (due to the limited number of study participants/study sites).
Additional information
Funding
References
- Gieselmann V , Krägeloh-MannI. Metachromatic leukodystrophy. In: Scriver’s Online Metabolic and Molecular Bases of Inherited Disease.ValleD, BeaudetAL, VogelsteinB ( Eds). McGraw-Hill, NY, USA (2018).
- Gomez-Ospina N . Arylsulfatase A deficiency. In: GeneReviews®. AdamMP (Ed.). WA, USA (2017).
- Gieselmann V . Metachromatic leukodystrophy: genetics, pathogenesis and therapeutic options. Acta Paediatr.97(457), 15–21 (2008).
- Gieselmann V , Krageloh-MannI. Metachromatic leukodystrophy: an update. Neuropediatrics41(1), 1–6 (2010).
- Kehrer C , BlumenstockG, GieselmannV, Krageloh-MannI, GermanL. The natural course of gross motor deterioration in metachromatic leukodystrophy. Dev. Med. Child Neurol.53(9), 850–855 (2011).
- Van Rappard DF , BoelensJJ, WolfNI. Metachromatic leukodystrophy: disease spectrum and approaches for treatment. Best Pract. Res. Clin. Endocrinol. Metab.29(2), 261–273 (2015).
- Groeschel S , KuhlJS, BleyAEet al. Long-term outcome of allogeneic hematopoietic stem cell transplantation in patients with juvenile metachromatic leukodystrophy compared with nontransplanted control patients. JAMA Neurol.73(9), 1133–1140 (2016).
- Baldo BA . Enzymes approved for human therapy: indications, mechanisms and adverse effects. BioDrugs29(1), 31–55 (2015).
- Whiteman DA , KimuraA. Development of idursulfase therapy for mucopolysaccharidosis type II (Hunter syndrome): the past, the present and the future. Drug Des. Devel. Ther.11, 2467–2480 (2017).
- Shire . Long-term metazym treatment of patients with late infantile metachromatic leukodystrophy (MLD) (2020). https://clinicaltrials.gov/ct2/show/results/NCT00633139?view=results
- Í Dali C , SevinC, Krageloh-MannIet al. Safety of intrathecal delivery of recombinant human arylsulfatase A in children with metachromatic leukodystrophy: results from a Phase I/II clinical trial. Mol. Genet. Metab. doi:10.1016/j.ymgme.2020.07.002 (2020) ( Epub ahead of print).
- Troy S , WasilewskiM, BeusmansJ, GodfreyCJ. Pharmacokinetic modeling of intrathecally administered recombinant human arylsulfatase A (TAK-611) in children with metachromatic leukodystrophy. Clin. Pharmacol. Ther.107(6), 1394–1404 (2020).
- Kuchar L , AsfawB, PoupetovaH, HonzikovaJ, TurecekF, LedvinovaJ. Direct tandem mass spectrometric profiling of sulfatides in dry urinary samples for screening of metachromatic leukodystrophy. Clin. Chim. Acta425, 153–159 (2013).
- Mirzaian M , KramerG, PoorthuisBJ. Quantification of sulfatides and lysosulfatides in tissues and body fluids by liquid chromatography-tandem mass spectrometry. J. Lipid Res.56(4), 936–943 (2015).
- Spacil Z , BabuKumar A, LiaoHCet al. Sulfatide analysis by mass spectrometry for screening of metachromatic leukodystrophy in dried blood and urine samples. Clin. Chem.62(1), 279–286 (2016).
- Blomqvist M , BorenJ, ZetterbergH, BlennowK, ManssonJE, StahlmanM. High-throughput analysis of sulfatides in cerebrospinal fluid using automated extraction and UPLC-MS/MS. J. Lipid Res.58(7), 1482–1489 (2017).
- US FDA . Bioanalytical Method Validation Guidance for Industry (2020). http://academy.gmp-compliance.org/guidemgr/files/UCM368107.PDF
- Harvey AR . The Gross Motor Function Measure (GMFM). J. Physiother.63(3), 187 (2017).
- Dali CI , BartonNW, FarahMHet al. Sulfatide levels correlate with severity of neuropathy in metachromatic leukodystrophy. Ann. Clin. Transl. Neurol.2(5), 518–533 (2015).