
Abstract
Background: The small blood volume of mice complicates tacrolimus pharmacokinetic studies in these animals. Here we explored dried blood spot (DBS) as a novel method to measure tacrolimus blood concentrations in mice. DBS samples were collected from three sampling sites (cheek, tail and heart) and compared with heart whole blood samples measured via LC–MS/MS. Results: Tacrolimus concentrations in the whole blood samples ranged from 2.56 to 27.64 μg/l. DBS of cheek vein blood was the most reliable sampling site, with a mean bias of 0.15 μg/l (95% CI: -4.20 to 4.50). Conclusion: The DBS cheek method can be used for serial monitoring of tacrolimus blood concentrations in mice, offering an animal-friendly method for tacrolimus pharmacokinetic studies in mice.
Graphical abstract
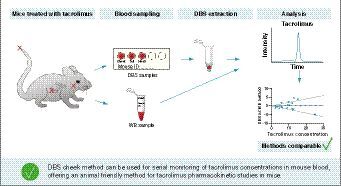
DBS: Dried blood spot; WB: Whole blood.
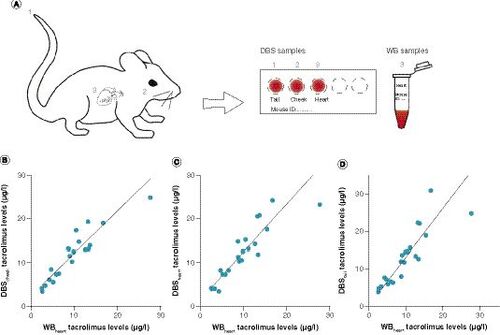
(A) Schematic overview of blood sampling. Blood was sampled from mice treated with tacrolimus at the tail tip (1), cheek (2) and, after sacrifice, heart (3). Tail tip, cheek and heart blood was spotted on a DBS card; heart blood was also stored as a whole blood sample and used as a reference. (B–D) Deming regression analysis of (B) DBSCHEEK, (C) DBSHEART and (D) DBSTAIL tacrolimus concentrations versus heart blood tacrolimus concentrations measured with LC–MS/MS. Calculated correction factor formulas were Y = 1.02*X + 1.74 for DBSCHEEK, Y = 1.13*X + 1.06 for DBSHEART and Y = 1.30*X + 0.15 for DBSTAIL.
DBS: Dried blood spot; WB: Whole blood.
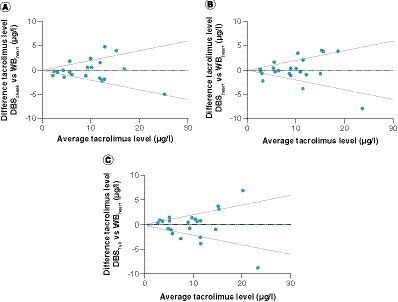
Bland–Altman absolute difference plot of tacrolimus whole blood concentrations versus dried blood spots from (A) cheek, (B) heart and (C) tail tip. Upper and lower lines represent 20 and -20% difference from average, dotted blue line represents the bias.
DBS: Dried blood spot; WB: Whole blood.
The immunosuppressive drug tacrolimus is a first-line treatment option to prevent organ and tissue rejection after transplantation [Citation1]. Even at low dosages, tacrolimus can cause serious side effects, including infections [Citation2,Citation3], nephrotoxicity [Citation4], hypertension [Citation5,Citation6], diabetes mellitus [Citation7] and neurotoxicity [Citation8]. Mice are often used as a model organism to study these side effects of tacrolimus and its effects on transplant immunology [Citation9]. However, many tacrolimus studies using mice lack validation of tacrolimus blood concentration measurements [Citation2,Citation10,Citation11], which makes it difficult to interpret the pharmacokinetic data and to compare studies.
Currently, the most common detection method for tacrolimus in human blood is LC–MS/MS [Citation1,Citation12]. However, it can be challenging to use LC–MS/MS for tacrolimus validation in mouse blood. For an average adult mouse weighing 25 g, the circulating blood volume approximates only 1.80 ml [Citation13]. According to current guidelines, a maximum of 10% of the circulating blood volume can be sampled biweekly, which equals a maximum volume of 180 μl [Citation13,Citation14]. Exceeding this volume may induce hypovolemia and cardiovascular failure [Citation13,Citation14]. The required whole blood (WB) volume for LC–MS/MS analysis of the tacrolimus concentration is approximately 100–200 μl, which limits the number of samples that can be obtained from a single mouse to a one-time or end-point measurement [Citation14]. In addition, not every research facility is equipped with the possibility to measure tacrolimus with LC–MS/MS.
Advances in LC–MS/MS technology in combination with the dried blood spot (DBS) method have enabled the quantification of lower drug concentrations in smaller sample sizes. In DBS analyses, samples are blotted and dried on a filter paper which can be stored at ambient temperatures [Citation15]. This method requires a WB volume of only 40–50 μl [Citation16]. These DBS samples are then analyzed with LC–MS/MS [Citation16]. The DBS method has been used before in pharmacokinetic mouse studies [Citation17–20], showing that it can be used to reduce mouse sampling size and that DBS improves data quality [Citation17]. An added benefit is the lowered cost of storing DBS samples compared with full blood samples [Citation15], and the possibility to easily analyze tacrolimus blood concentrations in another research institute, by sending the DBS card by mail. However, so far, the DBS method has not been validated to measure tacrolimus concentrations in mouse blood.
Recently, a method for the analysis of tacrolimus in human DBS samples was developed and validated according to current guidelines in our hospital [Citation16,Citation21,Citation22]. In this method, no correction for differences in hematocrit concentrations in the normal human range (0.25–0.50 l/l) was needed, which is in accordance with literature [Citation23,Citation24]. Mouse hematocrit concentrations range from 0.40–0.50 l/l [Citation14]. For human DBS, blood samples are collected via finger prick. Capillary blood withdrawal via finger prick is not possible in mice, and the site and manner of blood sampling might influence the blood quality by, for example, tissue exudate. Therefore, we compared tacrolimus concentrations by means of DBS in mouse WB that was collected by three different blood withdrawal techniques: tail tip bleeding, which resembles capillary bleeding; a cheek puncture, the recommended technique for venous blood sampling in mice in our institution; and lastly, heart blood derived via heart puncture during sacrifice. To validate whether DBS can be used as a method to measure tacrolimus concentrations in mouse blood, LC–MS/MS analysis of these samples was compared with standard LC–MS/MS on WB.
Materials & methods
Tacrolimus reference samples
A tacrolimus (S5003; SelleckChem, Huissen, The Netherlands) stock solution was prepared by dissolving the accurately weighted reference standard in methanol. The samples were prepared by spiking blank mouse blood with the appropriate stock solution or an intermediate solution, resulting in samples of 250 μl with tacrolimus concentrations ranging between 4.50 and 60 ng/ml. From these samples, 50 μl was spotted on a DBS card (Whatman 903 Protein in Saver Cards, art. no. 10531018; GE Healthcare, Hoevelaken, The Netherlands) for DBS measurements and the other 200 μl was used for standard WB LC–MS/MS analysis. The DBS cards were dried for at least 10 min at room temperature before being stored in zip bags with desiccant. The remnants of the mouse WB samples spiked with tacrolimus were stored at -80°C until both the DBS and WB samples were analyzed with LC–MS/MS.
Tacrolimus administration in mice
This study was performed in accordance with all applicable national and institutional policies. The protocol was approved by the Dutch Animal Ethics Committee (protocol no. AVD1010020197724). Certified biotechnicians carried out all experimental protocols under strict guidelines to ensure careful and consistent handling of the mice. The mice used in this study were females and males of a C57BL/6J background aged 12–20 months. The mice were kept in individual cages from the start of the experiment with ad libitum access to food and water.
Twenty-six mice received 1 or 3 mg/kg tacrolimus per day for 28 days via Alzet® osmotic mini-pumps (Alzet, model 2004; Charles River, Sulzfeld, Deutschland). The Alzet pumps were preloaded with tacrolimus dissolved in a 50% DMSO/50% EtOH solvent. After loading, the pumps were incubated in phosphate-buffered saline at 37°C for 24 h prior to subcutaneous intrascapular implantation. Blood samples were collected at the end of the mouse experiment.
Blood sampling for tacrolimus measurements
Blood was sampled in three ways: via tail tip, cheek vein and heart puncture. Just before sacrificing the mice, 50 μl capillary mouse blood was sampled from the tail tip by removing the boneless tip of the tail with surgical scissors. Blood flow in the tail was supported by applying slight pressure on the tail vein from base to tip [Citation25], and 50 μl per sample was spotted by use of a pipette onto a DBS card. For cheek sampling, 50 μl venous blood was collected from the cheek by a small needle puncture near the submandibular vein, and the blood was spotted on a DBS card. After sacrifice, at least 250 μl venous blood was sampled via terminal cardiac puncture (under anesthesia) with a syringe, out of which 50 μl was spotted on a DBS card and the 200 μl surplus WB was transferred to an EDTA-coated 1-ml vial, which was frozen at -80°C as LC–MS/MS sample until analysis. DBS samples were stored at room temperature in the dark in a desiccator for at most 6 months until they were measured. Tacrolimus DBS samples can be stored for up to 6 months [Citation26].
Sample preparation
For sample preparation, a 6-mm punch was taken from the center of the DBS spot with an automatic puncher (Analytical Sales & Services, Inc., NJ, USA). This 6-mm punch is the fully saturated part of the DBS spot and is used to prevent the influence of inhomogeneous distribution of analytes near the edges of the DBS spot [Citation27,Citation28]. The punches were collected in vials to which 200 μl internal standard (5 μg/l tacrolimus-13C2H4) working solution (Alsa Chim, Illkirch-Graffenstaden, France) was added. The vials were vortexed and then sonicated for 15 min. The supernatant was transferred to a snap ring vial with insert (VWR, Amsterdam, The Netherlands). A volume of 10 μl was injected into the LC system.
For WB sample preparation, 50-μl aliquots were spiked in a vial with 700 μl internal standard working solution (5 μg/l tacrolimus-13C2H4). The vials were vortex-mixed for 10 s and then centrifuged at 13,000 r.p.m for 10 min. The vials were placed in the autosampler of the LC–MS, where 10 μl of the supernatant was injected into the system.
Instrumentation & UPLC conditions
Analyses were performed on a Waters Acquity UPLC–MS/MS system (Waters Corp., MA, USA). The UPLC was connected to a Waters Xevo TQ-S micro triple quadrupole mass spectrometer. Chromatic separation was performed on a Waters Acquity UPLC BEH C18 column (1.7 μm; 50 × 2.1 mm) at a temperature of 60°C. A multistep gradient elution was applied at a flow rate of 0.50 ml/min using 2 mM ammonium acetate and 0.1% formic acid in water (eluent A) and 2 mM ammonium acetate and 0.10% formic acid in methanol (eluent B). The initial gradient was set at 45:55 A:B. Eluent B increased to 70% in 0.6 min, then to 90% in 0.1 min, followed by 100% B in 0.1 min, where it was kept for 1.0 min. Finally, the gradient was reset to the initial conditions for 0.20 min to equilibrate for the next injection adding up to a total run time of 2.0 min.
Method comparisons
Validation of the DBS method and WB method were based on the US FDA’s guidelines for bioanalytical validations guideline and the IATDMCT guideline [Citation22,Citation29]. The correlation coefficient (r) was >0.99 over the concentration range of 1.00–35 μg/l for the WB method and 2.00–35 μg/l for the DBS method. For both methods, accuracy, intra-day precision and inter-day precision were within the requirements (relative standard deviation <15%). The results of these validation parameters are summarized in .
The analysis of tacrolimus in WB is based on an application note from Waters (Waters Corp., Wilmslow, UK) [Citation30]. According to this application note, no matrix effects were reported. In human DBS tacrolimus samples, an average recovery of 0.92 (range 0.74–1.14) was found. No effect of hematocrit concentrations was seen.
To compare tacrolimus measurement in mouse blood via DBS method with WB method, a method comparison was performed, based on Deming regression and a Bland–Altman plot. To do so, from 22 mice, 3 × 22 DBS samples and 22 WB samples were collected and compared. Deming regression was used to calculate a correction factor for every type of DBS sampling, to compensate for systematic differences between both methods. Corrected DBS values were compared with WB values in Bland–Altman plots. According to the guidelines of the EMA, the difference between tacrolimus measurements with DBS and WB methods should be less than 20% of the mean of the concentrations for at least 66.67% of the samples [Citation31].
Results & discussion
Quality control samples
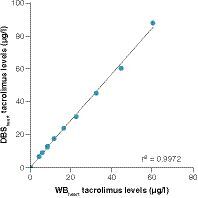
In order to validate whether the DBS method can be applied to analyze tacrolimus concentrations in mouse blood, we first set out to analyze blank mouse blood spiked with tacrolimus. Simple linear regression analysis showed a highly significant relationship (r2 = 0.99; p < 0.0001) between WB tacrolimus concentrations and DBS tacrolimus concentrations of the validation samples (). This correlation analysis also showed that DBS tacrolimus concentrations tended to be higher than the WB tacrolimus concentrations (slope: 1.42).
Comparison of DBS LC–MS/MS tacrolimus concentrations with WB LC–MS/MS tacrolimus concentrations
Next, we analyzed the concentrations of tacrolimus in mice that had been treated with 1–3 mg/kg tacrolimus for over 2 weeks. A reference venous WB sample derived by heart puncture was compared with three techniques of blood withdrawal spotted on DBS, which were cheek puncture (DBSCHEEK), heart puncture (DBSHEART) and tail tip bleeding (DBSTAIL; A). The tacrolimus concentrations in the WB samples ranged from 2.56 to 27.64 μg/l, and in all DBS samples from 3.39 to 30.97 μg/l.
Deming regression analysis showed a strong relationship between WB tacrolimus concentrations and DBS tacrolimus concentrations for all analyzed blood sampling methods (n = 22; p > 0.0001; ).
In accordance with the spiked blood samples, the DBSCHEEK, DBSHEART and DBSTAIL tacrolimus concentrations tended to be higher than the WB tacrolimus concentrations; therefore a correction factor was calculated based on the DBS to WB tacrolimus concentration Deming regression fit slopes. DBSCHEEK had a slope of 1.02 and a y-intercept of 1.74, DBSHEART had a slope of 1.13 and an intercept of 1.06, and DBSTAIL had a slope of 1.30 and an intercept of 0.15 (). A Bland–Altman plot with the corrected DBSCHEEK values (A) shows a very small mean bias (0.15) and 95% limits of agreement of -4.20 and 4.50. In total, 67% of the paired concentrations showed a difference between methods of ≤20%, thereby complying with the EMA’s predefined minimum of ≥66.67% [Citation31]. The other assayed measurements had lower compliance; for DBSHEART 64% of the measured samples fell within 20% of the ratio identity line (B), and for DBSTAIL this was only 54% (C). No trends in deviations over the concentration range were observed. Taken together, these data indicate that DBS with mouse blood drawn via cheek puncture can be accurately used as a method to measure tacrolimus concentrations in mouse blood.
Interestingly, the DBSHEART and WBHEART method comparison of mice treated with tacrolimus has a lower agreement than the DBSHEART and WBHEART method comparison of heart blood spiked with tacrolimus ( & B). This discrepancy suggests a role for varying pharmacokinetics of tacrolimus in mice or, for example, differences in wound exudate in the blood samples.
Conclusion
Our comparison between DBS and WB tacrolimus concentrations shows that DBS can be used to measure tacrolimus concentrations in a small volume of mouse blood. When comparing different blood sampling techniques, we discovered that the venous blood withdrawal by cheek puncture spotted on DBS cards gave the most reliable results. Heart DBS demonstrated almost equal agreements between DBS and WB methods (64% compliance for DBSHEART compared with 67% for DBSCHEEK); however, this method is not suitable for serial blood sampling as it can only be used as an end point blood withdrawal technique. DBSTAIL demonstrated poorer agreement between the DBS and WB methods, making this blood withdrawal location also unsuitable for monitoring tacrolimus blood concentrations via DBS in mice. Differences in pharmacokinetic profiling between blood sampling sites have been observed before and have been attributed to, among others, the distribution kinetics of therapeutics in the body [Citation32,Citation33]. Blood withdrawal from the tail tip also promotes leakage of wound exudate, which might account for the lower agreement between DBS and WB methods for tail tip-derived DBS samples. For cheek DBS, 67% of the samples scored a difference from the WB measurement within 20% of the mean, which just complies with the EMA guidelines for method agreement. For a specific pharmacokinetic study in mice, it might be useful to optimize the DBSCHEEK method to increase specificity, or to use the WB method if a larger sample volume can be taken.
We argue therefore that the DBSCHEEK method can be used to obtain a solid estimate of tacrolimus blood concentration in mouse studies. For various compounds it has been shown that hematocrit levels can influence the extraction recovery from DBS. However, from DBS assays developed for human samples, we know that the hematocrit effect does not exist or at least is very minimal for tacrolimus [Citation23,Citation34]. Especially in the hematocrit range 0.25–0.50 l/l, there is no clinical relevance to correct for hematocrit in tacrolimus measurements. The average hematocrit levels for mice range between 0.40 and 0.50 l/l [Citation14]. The authors have assumed that due to the comparable and even narrower range of hematocrit in mice, it is not necessary to correct for hematocrit in mice. It is important to consider hematocrit effects in advance when setting up DBS for other immunosuppressive compounds.
DBS is an advantageous method for monitoring mouse tacrolimus blood concentrations and has many benefits over WB sampling: lower blood volumes are necessary, which allows for serial sampling during the experiment; the DBS cards can be easily stored for longer times at ambient temperature, offering a sustainable alternative to ultra-low freezer storage of WB samples; and lastly, the DBS cards can be sent via post to another laboratory for analysis, offering tacrolimus pharmacokinetic analysis to institutes that do not have the means to analyze this in house. Furthermore, using DBSCHEEK improves animal welfare, as tacrolimus measurements are not restricted to an end point sacrifice blood withdrawal and multiple blood samples can be taken from one mouse in a noninvasive manner. Only a few publications containing data with mice treated with tacrolimus have actually measured tacrolimus blood concentrations, suggesting that there is a need for an assay measuring tacrolimus blood concentrations. Our results demonstrate that DBS of cheek blood is a useful new method for measuring tacrolimus blood concentrations in mice.
Future perspective
Here we have developed a DBS method for the quantification of tacrolimus in mouse blood, which is useful for the quantification of tacrolimus in animal studies. However, the interlaboratory reproducibility of this method remains unclear. We hope that, in the future, the described method will be used as a template for DBS-based analysis of tacrolimus in mouse blood, to improve the overall quality and interpretation of tacrolimus pharmacokinetic studies in mice.
Table 1. Results for accuracy, intra-day precision and inter-day precision for dried blood spot and whole blood methods.
Summary points
This is the first dried blood spot (DBS) bioanalytical method for determination of tacrolimus concentrations in mouse blood.
Out of the three tested blood sampling sites, DBS from cheek blood had the highest agreement with whole blood samples.
Mouse blood spiked with tacrolimus showed a high agreement between the DBS and whole blood methods for tacrolimus determination.
These data suggest that the variation in the measured tacrolimus concentrations between the blood sampling sites in the same mice might be caused by pharmacokinetics or, for example, differences in wound exudate leakage.
Financial & competing interests disclosure
H van Willigenburg is supported by a grant from the Dutch Kidney Foundation (15OP11). The authors have no other relevant affiliations or financial involvement with any organization or entity with a financial interest in or financial conflict with the subject matter or materials discussed in the manuscript apart from those disclosed.
No writing assistance was utilized in the production of this manuscript.
Ethical conduct of research
The authors state that they have obtained appropriate institutional review board approval or have followed the principles outlined in the Declaration of Helsinki for all human or animal experimental investigations. In addition, for investigations involving human subjects, informed consent has been obtained from the participants involved.
References
- Brunet M , van GelderT, ÅsbergAet al. Therapeutic drug monitoring of tacrolimus-personalized therapy: second consensus report. Ther. Drug Monit.41(3), 261–307 (2019).
- Emal D , RampanelliE, ClaessenNet al. Calcineurin inhibitor tacrolimus impairs host immune response against urinary tract infection. Sci. Rep.9(1), 1–11 (2019).
- Abidi MZ , ErlandsonKM. A comprehensive review of infections in older kidney transplant recipients. Curr. Transplant. Rep.8, 90–99 (2021).
- Randhawa PS , StarzlTE, DemetrisAJ. Tacrolimus (FK506)-associated renal pathology. Adv. Anat. Pathol.4(4), 265 (1997).
- Hošková L , MálekI, KopkanL, KautznerJ. Pathophysiological mechanisms of calcineurin inhibitor-induced nephrotoxicity and arterial hypertension. Physiol. Res.66(2), 167–180 (2017).
- Moes A , HesselinkD, vanden Meiracker A, ZietseR, HoornE. Chlorthalidone versus amlodipine for hypertension in kidney transplant recipients treated with tacrolimus: a randomized crossover trial. Am. J. Kidney Dis.69(6), 796–804 (2017).
- Shivaswamy V , BoernerB, LarsenJ. Post-transplant diabetes mellitus: causes, treatment, and impact on outcomes. Endocr. Rev.37(1), 37–61 (2016).
- Piotrowski PC , LutkowskaA, TsibulskiA, KarczewskiM, JagodzińskiPP. Neurologic complications in kidney transplant recipients. Folia Neuropathologica55(2), 86–109 (2017).
- Diehl R , FerraraF, MüllerCet al. Immunosuppression for in vivo research: state-of-the-art protocols and experimental approaches. Cell. Mol. Immunol.14(2), 146–179 (2016).
- Lee W-S , JeongJ-H, LeeE-Get al. Tacrolimus regulates endoplasmic reticulum stress-mediated osteoclastogenesis and inflammation: in vitro and collagen-induced arthritis mouse model. Cell Biol. Int.42(4), 393–402 (2018).
- Vandenbussche C , Vander Hauwaert C, DewaelesEet al. Tacrolimus-induced nephrotoxicity in mice is associated with microRNA deregulation. Arch. Toxicol.92(4), 1539–1550 (2018).
- Kalt DA . Tacrolimus: a review of laboratory detection methods and indications for use. Lab. Med.48(4), e62–e65 (2017).
- Diehl KH , HullR, MortonDet al. A good practice guide to the administration of substances and removal of blood, including routes and volumes. J. Appl. Toxicol.21(1), 15–23 (2001).
- van Zuthphen LFM , BaumansV, BeynenAC. Principles of Laboratory Animal Science revised edition.Elsevier, Amsterdam, The Netherlands, ISBN: 9780444506122 (2001).
- Van Amsterdam P , WaldropC. The application of dried blood spot sampling in global clinical trials. Bioanalysis2(11), 1783–1786 (2010).
- Koster RA , GreijdanusB, AlffenaarJWC, TouwDJ. Dried blood spot analysis of creatinine with LC–MS/MS in addition to immunosuppressants analysis. Anal. Bioanal. Chem.407(6), 1585–1594 (2014).
- Wickremsinhe ER , PerkinsEJ. Using dried blood spot sampling to improve data quality and reduce animal use in mouse pharmacokinetic studies. J. Ame. Assoc. Lab. Anim. Sci.54(2), 139–144 (2015).
- Clark GT , HaynesJJ, BaylissMAJ, BurrowsL. Utilization of DBS within drug discovery: development of a serial microsampling pharmacokinetic study in mice. Bioanalysis2(8), 1477–1488 (2010).
- Wong P , PhamR, WhitelyCet al. Application of automated serial blood sampling and dried blood spot technique with liquid chromatography–tandem mass spectrometry for pharmacokinetic studies in mice. J. Pharm. Biomed. Anal.56(3), 604–608 (2011).
- Rahavendran SV , VekichS, SkorHet al. Discovery pharmacokinetic studies in mice using serial microsampling, dried blood spots and microbore LC–MS/MS. Bioanalysis4(9), 1077–1095 (2012).
- van de Velde D , vander Graaf J, BoussaidiMet al. Development and validation of hematocrit level measurement in dried blood spots using near-infrared spectroscopy. Ther. Drug Monit.43(3), 351–357 (2021).
- Capiau S , VeenhofH, KosterRAet al. Official International Association for Therapeutic Drug Monitoring and Clinical Toxicology Guideline: development and validation of dried blood spot-based methods for therapeutic drug monitoring. Ther. Drug Monit.41(4), 409–430 (2019).
- Koster RA , VeenhofH, BotmaRet al. Dried blood spot validation of five immunosuppressants, without hematocrit correction, on two LC–MS/MS systems. Bioanalysis9(7), 553–563 (2017).
- Martial LC , HoogtandersKEJ, SchreuderMFet al. Dried blood spot sampling for tacrolimus and mycophenolic acid in children: analytical and clinical validation. Ther. Drug Monit.39(4), 412–421 (2017).
- Buchanan J , HolidayS, EverhartR, MileyM. Pressure and time. RivalSons (2011).
- den Burger JCG , WilhelmAJ, ChahbouniA, VosRM, SinjewelA, SwartEL. Analysis of cyclosporin A, tacrolimus, sirolimus, and everolimus in dried blood spot samples using liquid chromatography tandem mass spectrometry. Anal. Bioanal. Chem.404(6–7), 1803–1811 (2012).
- Moretti M , FreniF, TomacielloIet al. Determination of benzodiazepines in blood and in dried blood spots collected from post-mortem samples and evaluation of the stability over a three-month period. Drug Test. Anal.11(9), 1403–1411 (2019).
- Ghareeb M , AkhlaghiF. Alternative matrices for therapeutic drug monitoring of immunosuppressive agents using LC–MS/MS. Bioanalysis7(8), 1037 (2015).
- US Department of Health and Human Services. Guidance for Industry, Bioanalytical Method Validation (2001). www.fda.gov/files/drugs/published/Bioanalytical-Method-Validation-Guidance-for-Industry.pdf
- Balloch S , CaltonLJ, HammondG. Analysis of cyclosporine, everolimus, sirolimus, and tacrolimus in whole blood for clinical research. Application note. www.waters.com/nextgen/au/en/library/application-notes/2018/analysis-of-cyclosporine--everolimus--sirolimus--and-tacrolimus-.html
- European Medicines Agency. Bioanalytical method validation. www.ema.europa.eu/en/bioanalytical-method-validation
- Rangaraj N , VaghasiyaK, JaiswalS, SharmaA, LalJ. Do blood sampling sites affect pharmacokinetics?Chem. Biol. Interface4(3), 176–191 (2014).
- Chiou WL . The phenomenon and rationale of marked dependence of drug concentration on blood sampling site: implications in pharmacokinetics, pharmacodynamics, toxicology and therapeutics (part II). Clin. Pharmacokinet.17(4), 275–290 (1989).
- Koster RA , AlffenaarJWC, GreijdanusB, UgesDRA. Fast LC–MS/MS analysis of tacrolimus, sirolimus, everolimus and cyclosporin A in dried blood spots and the influence of the hematocrit and immunosuppressant concentration on recovery. Talanta115, 47–54 (2013).