
Abstract
Aim: To develop a bioanalytical method for quantifying INCB000928 in human saliva. Materials & methods: Human centrifuged saliva and human whole saliva were compared for matrix selection. Protein precipitation extraction and HPLC–MS/MS was used for analysis. Results & conclusion: Nonspecific binding of INCB000928 was reduced in whole versus centrifuged saliva. Whole saliva was a preferred matrix for INCB000928 bioanalytical method validation. Incurred sample reanalysis (ISR) using a successfully validated method failed in a healthy volunteer study because of inhomogeneous INCB000928 concentration across sample tube depths. Individual mixing of sample tubes followed by immediate aliquoting corrected the ISR failure, with 97.2% of repeats passing versus 41.7% for the same ISR samples.
Plain language summary
Fibrodysplasia ossificans progressiva (FOP) is a very rare condition where bone forms outside the skeleton (ossification), leading to restricted movement, decreased quality of life and shortened life span. Mutations in a gene called ALK2 have been identified as causing FOP. INCB000928 is a novel drug (to be taken by mouth) which inhibits ALK2 activity and prevents ossification in a laboratory mouse model of FOP. Because monitoring of the levels and efficacy of a drug often requires blood draws, which can be taxing in patients with FOP, this study aimed to develop a method to measure INCB000928 levels in saliva. The authors propose a unique procedure to process saliva samples to ensure accurate, reproducible quantitation of INCB000928 levels in saliva.
Tweetable abstract
INCB000928 bioanalysis in human saliva resulted in incurred sample reanalysis failure due to inhomogeneous concentration across sample tube depths, which was corrected by individual tube mixing followed by immediate aliquoting.
Graphical abstract
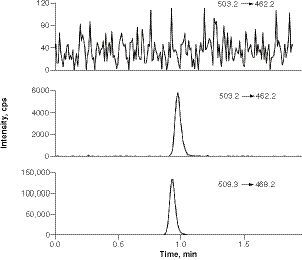
INCB000928 in blank human saliva (top), INCB000928 in saliva spiked at LLOQ (middle), and D6-INCB000928 (bottom) in a LLOQ sample.
LLOQ: Lower limit of quantification.
QC: Quality control.
PAR: Peak area ratio.
(C & D) Nonspecific binding analysis for INCB018424 and INCB050465 in human whole saliva samples over four sequential tube transfers (T0: no tube transfer; T1–T4, one to four sequential tube transfer[s]) at the LQC level.
PAR: Peak area ratio.
![Figure 5. (A & B) Effects of sample aliquot positions on INCB018424 and INCB050465 saliva concentrations at the low quality control (LQC) level. (C & D) Nonspecific binding analysis for INCB018424 and INCB050465 in human whole saliva samples over four sequential tube transfers (T0: no tube transfer; T1–T4, one to four sequential tube transfer[s]) at the LQC level.PAR: Peak area ratio.](/cms/asset/3c6aaf0f-e1d0-4c0e-8ea9-59b2bda62dfd/ibio_a_12352838_f0006.jpg)
Fibrodysplasia ossificans progressiva (FOP) is an ultra-rare and permanently disabling genetic disorder in which skeletal muscles and connective tissues gradually ossify, leading to bone formation outside the skeleton that restricts movement, decreases quality of life and shortens life span [Citation1,Citation2]. Gain-of-function mutations in the activin receptor A type-1 gene, which encodes activin receptor-like kinase 2 (ALK2), involved in bone morphogenetic protein and TGF-β family signaling, have been identified to cause FOP [Citation3]. Although other pathogenic variants have been more recently identified, more than 97% of patients with FOP share the same heterozygous mutation R206H (c.617G>A) in ALK2, and all the pathogenic mutations are located in the glycine-rich and serine-rich domain or in the protein kinase domain, making it an attractive target for therapeutic intervention [Citation2,Citation4].
There are no effective treatments for FOP. Small-molecule inhibitors of ALK2 have been developed and explored as targeted treatments [Citation4–6]. INCB000928 is a novel, potent, selective and orally available small-molecule inhibitor of wild-type and mutant ALK2 (R206H) [Citation7]. INCB000928 significantly reduces the production of hepcidin in human liver cells, primary hepatocytes and rodent models of anemia, and has shown efficacy in preventing injury-induced heterotopic ossification in a human FOP mouse model, offering a promising path to clinical proof-of-efficacy studies and potential benefits to patients with hepcidin-induced anemia and FOP [Citation7].
Blood draws for pharmacokinetic evaluation in patients with FOP are challenging. This is mainly due to poor venous access, contractures and unusual positioning [Citation8]. Although patients with FOP can tolerate peripheral blood collection performed as gently as possible by an experienced phlebotomist, tourniquet time and frequent blood draw attempts should be minimized [Citation8]. Furthermore, minor trauma – such as intramuscular injections, muscle fatigue and blunt muscle trauma from bumps, bruises and falls – can trigger episodic flare-ups and irreversible heterotopic ossification [Citation9,Citation10]. In contrast to plasma, saliva offers a noninvasive alternative and is viable if concordance with plasma pharmacokinetics can be established.
To support clinical pharmacokinetic assessment in patients with FOP, a bioanalytical method for the quantification of INCB000928 in human saliva is warranted for initial investigation of pharmacokinetics and for examination of the correlation between saliva and plasma concentrations in healthy adult volunteers. There are a handful of reports on small-molecule bioanalytical method development and/or validations in saliva using platforms based on LC–MS/MS [Citation11–17]. The aim of the present study is to share with the bioanalytical community the issues and challenges encountered, lessons learned and knowledge gained during method development, validation and in-study conduct for quantification of INCB000928 in human saliva, an alternative specimen to plasma for therapeutic drug monitoring and pharmacokinetics. To the best of our knowledge, this is the first report on: comparison of nonspecific binding (NSB) between human whole saliva (HWS) and human centrifuged saliva (HCS) for small-molecule bioanalytical method validation; incurred sample reanalysis (ISR) failure caused by tube position-dependent concentration variations; and solutions to ensure accurate and reproducible INCB000928 concentration determination in human saliva.
The observation of position-dependent INCB000928 concentration variation in saliva sample tubes was intriguing. To explore whether the position-dependent concentration variation is compound-specific, two other compounds, INCB018424 and INCB050465, were chosen for evaluation, and the results are also presented in this paper.
Materials & methods
Chemicals & reagents
Reference materials INCB000928 and internal standard D6-INCB000928, INCB018424 (ruxolitinib) and internal standard 13C4-INCB018424, and INCB050465 (parsaclisib) and corresponding analog internal standard INCB050904 were from Incyte Corporation (DE, USA). LC–MS grade acetonitrile (ACN), water and methanol were purchased from EMD Millipore Corporation (MA, USA), and LC–MS grade formic acid was purchased from Thermo Fisher Scientific (MA, USA). HPLC-grade ACN, methanol, water and DMSO were purchased from EMD Millipore Corporation, and American Chemical Society-grade methyl-tert butyl ether (MTBE) was purchased from VWR International (PA, USA). HPLC-grade ammonium acetate and ammonium formate were purchased from Honeywell (NC, USA). Sodium bicarbonate was purchased from VWR International. Pooled human saliva including HWS and HCS were purchased from BioIVT (NY, USA).
Preparation of stocks, calibration standards & quality control solutions
Stock solutions of INCB000928 and internal standard D6-INCB000928 were prepared separately in DMSO:methanol, 50:50 (v/v) to obtain a concentration of 5 mM. Working solutions of INCB000928 were prepared by diluting appropriate amounts of stock or higher working solutions with ACN:water, 50:50 (v/v). Different solvents were used for the preparation of stock solutions and working solutions, and this was to ensure complete solubilization of the analyte at a stock concentration of 5 mM. Duplicates of the INCB000928 stock solutions were prepared and verified to be equivalent (difference ≤5%) prior to use. A working solution of D6-INCB000928 (75 nM) was prepared by first diluting the 5-mM internal standard stock to a 50-μM intermediate solution and then diluting the intermediate solution with ACN 100%. The stock solutions and internal standard working solutions were stored at 4°C for further use.
Eight working calibration solutions for INCB000928 were prepared in human saliva by spiking appropriate working solutions to obtain concentrations of 5, 12, 50, 120, 500, 1200, 2500 and 3000 nM. Working quality control (QC) INCB000928 solutions at low, middle and high concentrations of 15, 180 and 2400 nM were prepared in the same manner. Calibration standards and QCs were freshly prepared on the day of analysis, or calibration standards and QCs stored frozen at -70°C were used provided that sufficient stability had been established.
Stock solutions of INCB018424 and internal standard 13C4-INCB018424 were prepared separately in ACN:water, 50:50 (v/v) to obtain a concentration of 5 mM. Working solutions of INCB018424 were prepared by diluting an appropriate volume of stock or higher working solutions with ACN:water, 50:50 (v/v). An internal standard working solution (100 nM) was prepared by first diluting the 5-mM internal standard stock to a 1000-μM intermediate solution and then diluting the intermediate solution with ACN:water, 50:50 (v/v). The low QC (3 nM) solution was freshly prepared on the day of analysis by spiking appropriate working solution into saliva.
Stock solutions of INCB050465 and its analog internal standard INCB050904 were prepared separately in ACN:water, 50:50 (v/v) to obtain a concentration of 5 mM. Working solutions of INCB050465 were prepared by diluting an appropriate volume of stock or higher working solutions with ACN:water, 50:50 (v/v). An internal standard working solution (250 nM) was prepared by first diluting the 5-mM internal standard stock to a 1000-μM intermediate solution and then diluting the intermediate solution with ACN:water, 50:50 (v/v). The low QC (15 nM) solution was freshly prepared on the day of analysis by spiking appropriate working solution into saliva.
Sample preparation
Pooled saliva (HWS and/or HCS) was used as a blank matrix for preparation of saliva calibration standards and QC samples and was stored at -20°C before use.
For INCB000928 sample extraction in the validated method, 50 μl of the saliva sample was placed in tubes in a 96-well rack. The saliva proteins in the sample aliquots were precipitated by the addition of 200 μl of ACN containing internal standard (75 nM D6-INCB000928) and the capped plate was vortex-mixed. After centrifugation, 100 μl of the supernatant was transferred to a clean 96-well tube plate containing 200 μl of water. The plate was covered and vortexed for approximately 1 min, then it was placed in the autosampler tray and an aliquot of the sample was injected into an LC–MS/MS system for analysis.
For INCB018424 QC sample extraction for exploratory purposes, 50 μl of the saliva QC sample was placed in tubes in a 96-well rack. After an aliquot of 50 μl of internal standard (100 nM 13C4-INCB018424, dissolved in ACN:water, 50:50 [v/v]) was added, an aliquot of 100 μl of 0.1 M NaHCO3 was added, then 800 μl of MTBE was added and the samples were covered and vortexed. After centrifugation, 700 μl of the MTBE layer was transferred to a clean 96-well tube plate. The samples were then dried under nitrogen. An aliquot of 250 μl of reconstitution solution (ACN:water, 50:50 [v/v]) was then added to each sample. The plate was capped, vortexed for approximately 1 min and placed in the autosampler tray and injected into an LC–MS/MS system for analysis. Sample injection volumes of 0.5, 1.0 and 2.0 μl were evaluated, and 0.5 μl was determined to be sufficient for sensitivity and preferred for linearity.
For INCB050465 QC sample extraction for exploratory purposes, 50 μl of the saliva QC sample was placed in tubes in a 96-well rack. After an aliquot of 50 μl of internal standard (50 nM INCB050904 dissolved in 50:50 ACN:water) was added, an aliquot of 100 μl of 0.1 M NaHCO3 was added, then 800 μl of MTBE was added and the samples were covered and vortexed. After centrifugation, 150 μl of the MTBE layer was transferred to a clean 96-well tube plate. The samples were then dried under nitrogen. An aliquot of 250 μl of reconstitution solution (ACN:water, 50:50 [v/v]) was then added to each sample. The plate was capped, vortexed for approximately 1 min and placed in the autosampler tray and injected into an LC–MS/MS system for analysis.
LC–MS/MS instrumentation & conditions
LC–MS/MS analysis for INCB000928, INCB018424 and INCB050465 was carried out with an Applied Biosystems SCIEX Triple Quad 6500+ or an AB SCIEX QTRAP 6500 MS (Applied Biosystems, MA, USA) coupled with Shimadzu Nexera X2 binary UHPLC pumps, a degasser, an autosampler and a column oven (Shimadzu, MD, USA).
The chromatographic separation for INCB000928 was achieved on a Thermo Hypersil Gold C4 HPLC column (50 × 2.1 mm, 3 μm; Thermo Fisher Scientific), with isocratic elution at 29% mobile phase B for a 2.1-min LC program at a flow rate of 0.5 ml/min. The mobile phase A was 20 mM ammonium acetate (pH ~6, unadjusted) and mobile phase B was ACN, 100%. The column temperature was maintained at 40°C and the autosampler was set to 15°C during the LC–MS/MS analysis. The mass spectrometer was operated in positive ESI mode, and the resolution setting used was ‘unit’ for both Q1 and Q3. The multiple reaction monitoring (MRM) transition was m/z 503.2 → 462.2 for INCB000928, and the MRM transition was m/z 509.3 → 468.2 for the internal standard, D6-INCB000928. The optimized parameters of the mass spectrometer were curtain gas, 45 psig; ion spray voltage, 5500 V; source temperature, 600°C; nebulizer gas, 60 psig; turbo gas, 60 psig; and collision-activated dissociation gas, 8 psig. The optimized collision energy for both INCB000928 and D6-INCB000928 was 39 V.
The chromatographic separation for INCB018424 was achieved on a Phenomenex Synergi Polar-RP 80 Å HPLC column (30 × 2 mm, 4 μm; Phenomenex, CA, USA), with isocratic elution at 55% mobile phase B for a 2.25-min LC program at a flow rate of 0.3 ml/min. The chromatographic separation for INCB050465 was achieved on a Phenomenex Synergi Polar-RP 80 Å HPLC column (30 × 2 mm, 4 μm), with isocratic elution at 42% mobile phase B for a 1.51-min LC program at a flow rate of 0.35 ml/min. For both INCB018424 and INCB050465, the mobile phase A was 2 mM ammonium acetate and mobile phase B was ACN, 100%. The column temperature was ambient and the autosampler was set to 15°C during the LC–MS/MS analysis. The mass spectrometer was operated in positive ESI mode, and the resolution setting used was ‘unit’ for both Q1 and Q3. The MRM transition was m/z 307.3 → 186.2 for INCB018424, and the MRM transition was m/z 311.3 → 190.2 for the internal standard, 13C4-INCB018424. The MRM transition was m/z 433.2 → 150.2 for INCB050465, and the MRM transition was m/z 440.3 → 150.2 for the internal standard, NCB050904. The optimized parameters of the mass spectrometer were curtain gas, 45 psig; ion spray voltage, 5500 V; source temperature, 600°C; nebulizer gas, 60 psig; turbo gas, 60 psig; and collision-activated dissociation gas, 9 psig.
NSB tests
To test NSB, 1 ml of the low QC samples were prepared in pooled human saliva in 2-ml Eppendorf polypropylene tubes. After mixing, an aliquot (800 μl) of each initial solution (transfer 0, denoted as T0) was transferred to a second tube (transfer 1, denoted as T1). After mixing, 600 μl was then transferred to a third tube (transfer 2, denoted as T2), followed by mixing and two more sequential transfers of 400 and 200 μl, respectively (transfers 3 and 4, denoted as T3 and T4). Each transfer tube (T0–T4) was analyzed in duplicate to evaluate NSB.
Calibration & data evaluation
Concentrations were calculated using eight concentration levels for calibration curves ranging from 5 to 3000 nM, with 1/x2 weighted linear regression for INCB000928. No calibration was performed for INCB018424 and INCB050465, in which only peak area ratio was used for the assessment of the QC samples. Peak area integrations were performed using Analyst software (v1.6.3 or v1.7.2; Applied Biosystems), and regressions were carried out in Watson Bioanalytical LIMS (v7.4.1 or v7.6.2) from Thermo Fisher Scientific, Inc. Where Watson Bioanalytical LIMS could not perform a calculation, Excel 2016 or higher (Microsoft Corp., WA, USA) was used.
Saliva sample collection & analysis
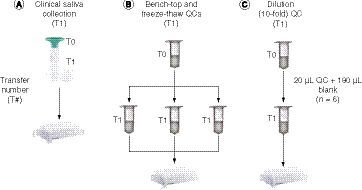
Clinical study INCB00928-102 was a phase 1, double-blind, randomized, placebo-controlled, multiple-dose, dose-escalation study to assess the safety, tolerability and pharmacokinetics of INCB000928 when administered orally to healthy adult participants. The study was conducted in accordance with the ICH Guidelines for Good Clinical Practice, including the archiving of essential documents, the principles of the Declaration of Helsinki and other applicable local ethical and legal requirements. Informed consent was obtained from each participant before protocol-specific screening assessments were performed. The Advarra institutional review board approval was obtained for this study (reference number Pro00045716). For saliva collection, 1–3 ml of saliva was collected to a 5-ml collection tube via a saliva collection funnel obtained from Norgen Biotek Corp. (Thorold, Canada). At the end of each collection, the collection funnel was discarded and the saliva tube was tightly capped and placed on crushed ice or ice bath. Within 45 min of the collection, the saliva samples were stored in a -80°C freezer until shipment. Overall, 468 saliva samples from three cohorts were received. In each cohort, nine participants received INCB000928 and three participants received placebo. In this study, placebo samples were not analyzed and, as a result, 117 samples from each cohort for a sum of 351 saliva samples were analyzed, and 10% of the total samples (i.e., 36 samples) were reanalyzed to assess ISR. ISR was considered acceptable if two-thirds (67%) of the ISR samples showed repeat values within ±20% of the mean from the initial concentrations.
Results & discussion
Comparison of INCB000928 NSB between HWS & HCS
HWS contains cell debris, food debris and some high-molecular-weight proteins, which are removed by centrifugation to generate the HCS. Compared with HWS, HCS is substantially easier to handle and less frequently blocks pipette tips, which greatly facilitates accurate and consistent volume transfer and minimizes the effect of cellular components and food debris. NSB is a common and serious issue in bioanalytical assays in which the matrix lacks proteins and lipids to which analytes can bind [Citation18,Citation19]. The NSB of INCB000928 in saliva was investigated with a low QC (15 nM) sample prepared in HWS and HCS by using a sequential transfer approach [Citation18]. The low QC sample prepared in both matrices showed increasing loss over each sequential transfer; however, the loss was greatly reduced in HWS compared with HCS (). Specifically, after four sequential tube transfers, a bias of -36.2% was observed for the low QC prepared in HCS, whereas it was reduced to -18.7% in HWS; a single-digit bias was observed for the low QC samples prepared in HCS for up to two sequential tube transfers and in HWS for up to three sequential tube transfers (). Considering the aforementioned primary differences between HCS and HWS, it is hypothesized that high-molecular-weight proteins, cell debris and food debris in HWS help in reducing the NSB of INCB000928 to plastic containers by either preferentially blocking the container walls or favorably binding to the analyte. However, further investigations of the exact mechanisms of HWS in decreasing the NSB of INCB000928 relative to HCS have not yet been performed.
In the multiple ascending-dose healthy volunteer study, saliva was collected into a collection tube via a saliva collection funnel, and the clinical collection scheme is shown in A. If saliva spitting through the collection funnel was considered one passive tube transfer, then the clinically collected saliva sample experienced one single-step tube transfer (T1), and therefore the NSB had negligible impact on the quantification of INCB000928. In analogy to the clinically collected saliva, B & C show the QC samples undergoing one-step tube transfer during the method validation process including bench-top QC, freeze–thaw QC and dilution QC. Bench-top and freeze–thaw QC samples were transferred to three individual tubes in duplicate for six values to account for potential tube variations for stability assessments, and the above ULOQ QC was independently diluted to six replicates for dilution integrity evaluation. The accuracies of the one-step tube transfer QCs were compared between respective preparations in HWS and HCS (). For the QC samples prepared in HCS, the accuracy of the high QCs for bench-top (26 h) and freeze–thaw (three cycles) stability assessment showed within but close to -15% bias, whereas that of the low QCs for the same matrix stability tests as well as the tenfold dilution integrity test resulted in exceeding -15% bias, supporting the conventional notion that lower analyte concentrations are more severely impacted by NSB. In contrast, the tenfold dilution QC and the low QCs prepared in HWS for bench-top (47 h) and freeze–thaw (five cycles) stability assessment improved the accuracy to less than -15% bias, and the high QCs prepared in HWS for bench-top (47 h) and freeze–thaw (five cycles) stability assessment further increased the accuracy to within single-digit biases of ±3% ().
It has been reported that HCS can be used as a substitute for HWS for many in vitro studies, and there is no significant difference in lubricating properties between HCS and HWS [Citation20]. Our data indicated that HWS greatly mitigated the NSB of INCB000928 for a more accurate and reliable concentration determination, despite HCS offering the many aforementioned advantages in sample handling; therefore, HWS was a more desirable matrix for INCB000928 bioanalytical method validation and in-study conduct.
Method validation
An LC–MS/MS-based method was fully validated with respect to selectivity, specificity, precision, accuracy, carryover, recovery, matrix effect, dilution integrity and stability, according to the US FDA and European Medicines Agency guidelines [Citation21,Citation22]. Typical blank saliva and LLOQ sample chromatograms with an injection volume of 0.5 μl are presented in . INCB000928 showed a linear response over the concentration range of 5–3000 nM, with correlation coefficients invariably ≥0.9938. The assay performance results are summarized in . The elements of the calibration curve included a blank sample (no analyte, no internal standard), a zero sample (blank plus internal standard) and eight non-zero calibrators (5, 12, 50, 120, 500, 1200, 2500 and 3000 nM). The acceptance criteria for the calibration curve were that the non-zero calibrators should be ±15% of nominal concentrations except at LLOQ, where it should be ±20% of the nominal concentration, and at least 75% and a minimum of six non-zero calibrators should meet the aforementioned criteria. For all the back-calculated non-zero calibration standards obtained during the validation study at the time of manuscript preparation, the inter-assay accuracy (% bias) ranged from -2.5 to 4.4% and the inter-assay precision (% CV) was ≤3.6%. For accuracy and precision, intra-assay accuracy (% bias) ranged from -8.7 to 5.6% and precision (% CV) ≤3.9%, and inter-assay accuracy (% bias) ranged from -3.9 to 0.4% and precision (% CV) ≤4.8%. The extraction recovery of INCB000928 was high and consistent, between 91.9 and 97.3%, with % CV ranging from 1.2 to 3.0% for the three concentrations at low (15 nM), middle (180 nM) and high (2400 nM) QC. The matrix factor for INCB000928 evaluated with six lots of blank saliva was between 0.951 and 0.965, and the internal standard-normalized matrix factor was very close to 1.0 with % CV ≤2.0%, indicating negligible matrix effect. The selectivity and specificity were demonstrated with six lots of blank saliva, in which the response was between 0.1 and 0.2% of the LLOQ for INCB000928 and 0.0% for the internal standard D6-INCB000928. In addition, INCB000928 was found to be stable in human saliva after 47.5 h at ambient temperature (benchtop stability), through five freeze–thaw cycles. The long-term frozen saliva sample storage stability was verified to be at least 175 days after the samples were stored frozen at nominal -70°C and at least 62 days after the samples were stored frozen at nominal -20°C. It was also verified that INCB000928 in the extracts was stable for at least 102 h when kept in the autosampler set to 15°C (processed sample stability) and upon reinjection of extracts after 139 h in the autosampler kept at 15°C (reinjection reproducibility).
Failure of ISR in a clinical study
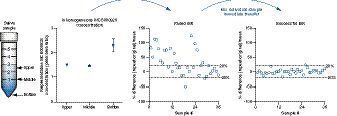
A bioanalytical method for the quantification of INCB000928 was fully and successfully validated, and the validated method was applied to analyze saliva study samples from a multiple ascending-dose healthy volunteer study. The performance of the calibration standards and QCs from all four runs met the acceptance criteria: the % bias ranged from -5.0 to 4.6% and % CV ranged from 1.3 to 6.1% (). ISR was conducted to verify the reliability of the method used to determine the study sample INCB000928 concentrations. A total of 36 samples representing 10% of the study samples from three dose-escalation cohorts (i.e., 12 samples per cohort) were selected for ISR. Surprisingly, only 15 of the 36 repeats, representing 41.7% of the ISR samples, showed repeat values within ±20% of the mean from the initial concentrations (), far below the acceptance criteria of at least 67% of the repeats showing concentrations within ±20% of the mean from the initial values. Furthermore, the majority of the repeated samples resulted in >50% difference from the mean of the ISR and the original concentrations. The ISR failure triggered a thorough investigation.
Investigation of ISR failure revealed tube position-dependent concentration variations & corrective measures
ISR is a necessary component of bioanalytical method validation and is conducted to critically support the precision and accuracy measurements established with the QCs during method validation [Citation21,Citation22]. It was puzzling that the method for the quantification of INCB000928 was successfully validated, whereas the ISR in a clinical study failed. When the clinical saliva samples were directly compared with the validation samples, there were noticeable differences in tube sizes and sample volumes. For validation samples, 2-ml plastic tubes were used with ≤1-ml sample volumes, while 5-ml plastic tubes were used with 1- to 3-ml sample volumes for clinical saliva study samples. Additionally, for validation samples, owing to the small number of standards and QC samples, the samples were individually vortexed and immediately transferred to the extraction tubes, whereas the large number of saliva study samples were batch-vortexed and then an individual sample was manually transferred to the extraction tube. It was suspected that the saliva study samples had settled down in the collection tubes when they were transferred to the corresponding extraction tubes. Furthermore, the positions where the saliva were taken out of the 1- to 3-ml collection tubes were arbitrary during initial and ISR sample analyses. It was plausible that the analyte concentrations were not homogeneous at different depths of the tube.
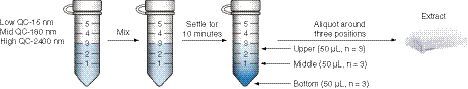
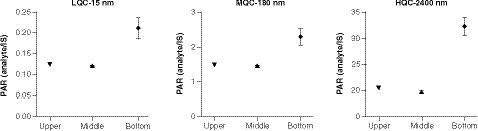
To test the hypothesis of inhomogeneous concentration in the saliva sample collection tubes, low, medium and high QCs were prepared by using 5-ml plastic tubes in the volume of 3 ml to mimic the study samples. The experimental design is depicted in . After preparation of the QC samples, the tubes were vortexed and allowed to settle for 10 min. Triplicate saliva samples were then taken out of the tubes at three positions including upper (>2-ml mark), middle (~1-ml mark) and bottom (where the saliva appeared cloudy) for extraction. The data at the three tube positions for the QC concentration levels are shown in . For all three QC levels, the concentration denoted in peak area ratio was similar between the upper position and the middle position; however, it was significantly higher at the bottom of the tube, at approximately 1.5- to twofold relative to the upper and middle positions (). The data confirmed the hypothesis of inhomogeneous INCB000928 concentration across the sample tube depths and explained the >50% discrepancies observed between the original and the ISR results. Comparing the saliva at the bottom versus that at the upper and middle positions, it is fairly equivalent to the comparison between HWS and HCS. Specifically, the saliva at the upper and middle positions after settling for 10 min in the experiment highly resembled HCS and appeared clearer than the saliva at the bottom, which was comparable with HWS in which debris and some high-molecular-weight proteins can be present and appeared cloudy. Therefore one possible explanation for the drastically higher analyte concentration at the bottom relative to the upper and middle positions was that INCB000928 preferentially bound to some high-molecular-weight proteins, cell and food debris.
With the new knowledge of tube position-dependent INCB000928 concentration variation (i.e., inhomogeneous concentration) in the saliva matrix, the corrective measure to obtain accurate and reliable concentrations for saliva study sample was to individually vortex each sample tube followed by immediate aliquot transfer to the extraction tube. With appropriate justifications and approval from the management and clinical pharmacokineticist, the study samples were reassayed with revised sample process procedures. ISR was repeated by selecting the identical 36 samples from three cohorts analyzed in the previous ISR run. As expected, the new revised sampling procedure corrected the initial ISR failure, with 97.2% of samples (35/36) showing repeated concentrations within ±20% of the mean from the reassayed values, adequately passing the ISR acceptance criteria of >67% of the repeats ().
Tube position-dependent substantial analyte concentration variation is compound-specific
The observation of position-dependent substantial INCB000928 concentration variation in saliva sample tubes was intriguing. To the best of our knowledge, similar observations have not been reported for other compounds in this laboratory or in the literature. It was interesting to explore whether the position-dependent substantial concentration variation was compound-specific. To answer this question, two other compounds, INCB018424 and INCB050465, were chosen for evaluation, with the understanding that the clinical relevance of their presence in saliva was unknown at the time of manuscript preparation. Using the same experimental design depicted in , the concentration denoted in peak area ratio of the low QC sample in HWS was determined at the upper, middle and bottom positions in the tube for INCB018424 and INCB050465. Similar to what was observed for INCB000928, the concentrations were close between the upper and middle positions for both INCB018424 and INCB050465. Different from INCB000928, both INCB018424 and INCB050465 showed only slightly higher concentrations at the bottom of the tube compared with the upper and middle positions (A & B). Meanwhile, the NSB properties were investigated for INCB018424 and INCB050465 in HWS using the same sequential transfer approach as for INCB000928. Interestingly, both INCB018424 and INCB050465 showed negligible NSB over each sequential tube transfer, with approximately 10% loss after four sequential transfers (C & D). It was conceivable that the mildly elevated concentrations at the bottom were associated with the insignificant NSB of INCB018424 and INCB050465 in HWS. The correlation between scales of tube positional concentration variations and severity of NSB in HWS is worth further investigation and will be reported in the future.
Conclusion
This study demonstrated that HWS reduced the NSB of INCB000928 to polypropylene sample storage containers for a more accurate and reproducible concentration determination and was a preferred matrix for INCB000928 bioanalytical method validation and sample analysis. It was determined that the substantial tube position-dependent concentration variation and the batch-mixing practice led to initial ISR failure in a multiple ascending-dose healthy volunteer study. Individual mixing of each saliva tube followed by immediate sample transfer corrected the ISR failure. The extent of position-dependent analyte concentration variation was compound-specific. The experience and knowledge gained during the method development, validation and sample analysis for a healthy volunteer study ensures the reliability of the method for successful pharmacokinetic support in patients with FOP and are useful for future method validation and sample analyses. This work demonstrated significant tube position-dependent INCB000928 concentration variation in human saliva and proposed a unique sample process procedure to ensure accurate and reproducible concentration determinations in small-molecule bioanalysis in saliva matrix.
Future perspective
Saliva is an attractive and alternative specimen to plasma and is gaining interest in therapeutic drug monitoring and pharmacokinetics. The experience and knowledge acquired in comparing HWS and HCS for appropriate matrix selection for bioanalytical method validation and in investigating and solving the ISR failure are useful for the establishment of robust saliva bioanalytical methods and successful in-study conduct in the future.
Table 1. Sequential tube transfer results from INCB000928 in human centrifuged saliva and human whole saliva.
Table 2. Performance of INCB000928 quality control samples in human centrifuged saliva and human whole saliva.
Table 3. Summary of validation results.
Table 4. Back-calculated INCB000928 concentrations of calibration standards and performance of quality control samples in a clinical study.
Table 5. Initial incurred sample reanalysis results.
Table 6. Repeated incurred sample reanalysis results.
Human whole saliva reduced INCB000928 nonspecific binding versus centrifuged saliva.
Human whole saliva is a preferred matrix for INCB000928 bioanalytical method validation.
Incurred sample reanalysis (ISR) failed in a healthy volunteer study using a successfully validated method.
ISR failure was due to inhomogeneous INCB000928 concentration in saliva sample tubes.
Individual mixing of each sample tube followed by immediate sample transfer corrected the inhomogeneity and ISR failure.
This is the first report on comparison of human whole saliva and human centrifuged saliva for small molecule bioanalysis.
This is the first report on ISR failure caused by inhomogeneous concentration distribution across saliva sample tube depths.
Experience and knowledge gained in the study are useful for the establishment of robust saliva bioanalytical methods and successful in-study conduct in the future.
Acknowledgments
The authors are thankful to site personnel and all volunteers who participated in the clinical trial and contributed samples for analysis. The authors are thankful to K Rockich for being responsible for authoring the protocol and providing clinical pharmacology support for clinical study INCB 00928-102.
Financial & competing interests disclosure
All the authors are employees and shareholders of Incyte Corporation. The authors have no other relevant affiliations or financial involvement with any organization or entity with a financial interest in or financial conflict with the subject matter or materials discussed in the manuscript apart from those disclosed.
Editorial assistance was provided by Envision Pharma Group (PA, USA) and funded by Incyte Corp. (DE, USA).
Data sharing statement
No individual participant data that underlies the results reported in the article will be available, and nor will information regarding the study protocol or statistical analysis, beyond what is reported in the text.
Ethical conduct of research
The authors state that they have obtained appropriate institutional review board approval or have followed the principles outlined in the Declaration of Helsinki for all human or animal experimental investigations. In addition, for investigations involving human subjects, informed consent has been obtained from the participants involved.
References
- De Brasi D , OrlandoF, GaetaVet al. Fibrodysplasia ossificans progressiva: a challenging diagnosis. Genes12(8), 1187 (2021).
- Pignolo RJ , HsiaoEC, BaujatG, LapidusD, ShermanA, KaplanFS. Prevalence of fibrodysplasia ossificans progressiva (FOP) in the United States: estimate from three treatment centers and a patient organization. Orphanet. J. Rare Dis.16(1), 350 (2021).
- Kaplan FS , XuM, SeemannPet al. Classic and atypical fibrodysplasia ossificans progressiva (FOP) phenotypes are caused by mutations in the bone morphogenetic protein (BMP) type I receptor ACVR1. Hum. Mutat.30(3), 379–390 (2009).
- Shi F , GaoJ, ZouJ, YingY, LinH. Targeting heterotopic ossification by inhibiting activin receptor-like kinase 2 function (review). Mol. Med. Rep.20(4), 2979–2989 (2019).
- Yamamoto H , SakaiN, OhteSet al. Novel bicyclic pyrazoles as potent ALK2 (R206H) inhibitors for the treatment of fibrodysplasia ossificans progressiva. Bioorg. Med. Chem. Lett.38, 127858 (2021).
- Rooney L , JonesC. Recent advances in ALK2 inhibitors. ACS Omega6(32), 20729–20734 (2021).
- Oh ST , GotlibJ, MohanSet al. A phase 1/2 study of INCB000928 as monotherapy or in combination with ruxolitinib in patients with anemia due to myelofibrosis (INCB 00928-104) (abstract CT216). Blood136(Suppl. 1), 3 (2020).
- Hsiao EC , DiRocco M, CaliAet al. Special considerations for clinical trials in fibrodysplasia ossificans progressiva (FOP). Br. J. Clin. Pharmacol.85(6), 1199–1207 (2018).
- Pignolo RJ , ShoreEM, KaplanFS. FOP – diagnosis management and therapeutic horizons. Pediatr. Endocrinol. Rev.10(Suppl. 2), 437–448 (2013).
- Kaplan FS , ChakkalakalSA, ShoreEM. Fibrodysplasia ossificans progressiva: mechanisms and models of skeletal metamorphosis. Dis. Model Mech.5(6), 756–762 (2012).
- Amara A , PenchalaSD, ElseLet al. The development and validation of a novel LC–MS/MS method for the simultaneous quantification of molnupiravir and its metabolite ß-d-N4-hydroxycytidine in human plasma and saliva. J. Pharm. Biomed. Anal.206, 114356 (2021).
- Veltkamp F , PistoriusMCM, BoutsAHM, MathôtRAA. Development and validation of LC–MS-MS to determine levamisole in plasma and saliva. Ther. Drug Monit.43(2), 279–285 (2021).
- Dziurkowska E , Jiménez-MorigosaC, López-RivadullaM, WesolowskiM. Development and validation of solid-phase extraction coupled with a liquid chromatography–tandem mass spectrometry method for quantitation of olanzapine in saliva. J. Chromatogr. B. Analyt. Technol. Biomed. Life Sci.1136, 121896 (2020).
- Hösli R , KönigS, MühlebachSF. Development and validation of an LC–MS/MS and comparison with GC–MS method to measure phenytoin in human brain dialysate, blood, and saliva. J. Anal. Methods Chem.2018, 8274131 (2018).
- Lood Y , AardalE, AhlnerJet al. Determination of testosterone in serum and saliva by liquid chromatography–tandem mass spectrometry: an accurate and sensitive method applied on clinical and forensic samples. J. Pharm. Biomed. Anal.195, 113823 (2021).
- Jin Y , PanY, JinB, JinD, ZhangC. (S)-1-(5-(4-Methylpiperazin-1-yl)-2,4-dinitrophenyl)pyrrolidine-2-carboxylic acid as a derivatization reagent for ultrasensitive detection of amine enantiomers by HPLC–MS/MS and its application to the chiral metabolite analysis of (R)-1-aminoindan in saliva. J. Pharm. Biomed. Anal.194, 113815 (2021).
- Calvo AM , SantosGM, DionísioTJet al. Quantification of piroxicam and 5′-hydroxypiroxicam in human plasma and saliva using liquid chromatography–tandem mass spectrometry following oral administration. J. Pharm. Biomed. Anal.120, 212–220 (2016).
- Ji AJ , JiangZ, LivsonY, DavisJA, ChuJX, WengN. Challenges in urine bioanalytical assays overcoming nonspecific binding. Bioanalysis2(9), 1573–1586 (2010).
- Nguyen JM , GilarM, KoshelBet al. Assessing the impact of NSB on oligonucleotide bioanalysis. Bioanalysis13(16), 1233–1244 (2021).
- Zhang YF , ZhengJ, ZhengL, ZhouZR. Influence of centrifugation treatment on the lubricating properties of human whole saliva. Biosurf. Biotribol.2(3), 95–101 (2016).
- European Medicines Agency. Guideline on bioanalytical method validation (2011). https://www.ema.europa.eu/en/bioanalytical-method-validation
- US Food and Drug Administration. Bioanalytical method validation guidance for industry (2018). https://www.fda.gov/regulatory-information/search-fda-guidance-documents/bioanalytical-method-validation-guidance-industry