
 ?Mathematical formulae have been encoded as MathML and are displayed in this HTML version using MathJax in order to improve their display. Uncheck the box to turn MathJax off. This feature requires Javascript. Click on a formula to zoom.
Abstarct
Selection of the appropriate matrix for standard curve is critical for an accurate and sensitive biomarker method. Slope of a standard curve is the key factor for parallelism assessment between tested matrix and authentic matrix for LC-MS/MS assays. Here the authors have established slope criteria using a generic equation and endogenous level criteria for achieving assay sensitivity. The slope difference criterion is from -13.0 to +17.6% for LC-MS assays with ± 15% bias criteria. When the ratio of endogenous concentration in the tested matrix to the lower limit of quantitation is <4.0, the lower limit of quantitation is achievable. If these criteria are met, the tested matrix can be used for assays. The utility of the two criteria has been illustrated with case studies.
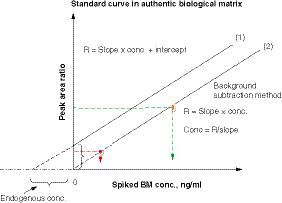
Using a series of analyte standards spiked to an authentic matrix containing the endogenous analyte, a standard curve equation can be expressed as R = slope × conc. + intercept, where R is the ratio of analyte BM peak area to its internal standard peak area and conc. is concentration. When the endogenous analyte level in the matrix is greater than zero, there is a positive intercept in the standard curve (1). When the endogenous analyte concentration is subtracted from each spiked standard, the intercept is near zero in the standard curve (2). The standard curve (2) can be used for concentration calculation for all unknown samples in the same analytical run.
BM: Biomarker; conc.: Concentration.
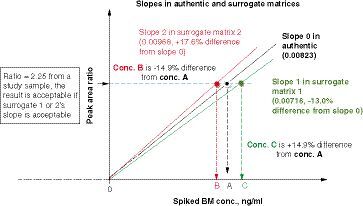
A peak area ratio of 2.25 (analyte to internal standard) from an authentic sample can be calculated with one of the three standard curve slopes. If the interpreted concentration is within ± 15% bias of the true concentration (using authentic matrix slope), that is, % slope difference from the authentic matrix slope (0.00823) ranges from -13.0 to +17.6%, then the standard curve in the surrogate matrix is considered to be parallel to the standard curve in the authentic matrix.
BM: Biomarker; conc.: Concentration.
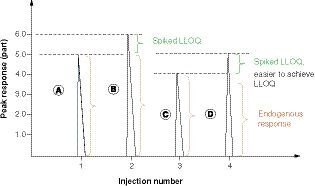
(A) A high endogenous analyte concentration in the matrix of the standard curve will prevent achieving assay sensitivity (LLOQ). The peak response of matrix A contains the endogenous analyte concentration, 5 parts on the vertical axis. (B) The peak response of spiked LLOQ (only 20% of an endogenous level) onto matrix A. When the ratio of endogenous response (A = 5.0 parts) to net LLOQ response (B-A = LLOQ, 1.0 part) = or >5.0, the desired LLOQ is hard to achieve, as the variability of LLOQ (20%) is the same as the % increase of endogenous concentration in peak B. (C) Matrix C response containing a lower level of endogenous analyte concentration than Matrix A. (D) Spiked LLOQ on matrix C. The endogenous analyte is about 20% lower in matrix C than in matrix A. It will be easy to see enough response difference between peak D and peak C, which is C/(D - C) ≤4.0. Multiple biomarker assay experiments verified that the ratio of endogenous analyte peak response in the matrix to the net LLOQ response must be <4.0, then the desired LLOQ can be achieved or achievable with its precision and accuracy criteria of 20% bias. It can be concluded that assay LLOQ is dependent on the endogenous level of the matrix blank for its standard curve. The higher the endogenous level, the more difficult it is to achieve the desired LLOQ.
LLOQ: Lower limit of quantitation.
Quantification of compounds with endogenous levels in the matrix can be challenging because of interference from the matrix and the endogenous analyte. When endogenous analytes are present (e.g., biomarker assays and hormonal therapeutic pharmacokinetic assays), the background subtraction method (or standard addition method) and surrogate matrix method are commonly used [Citation1]. In the background subtraction method, the calibration curve is prepared by spiking a series of analyte concentrations into a representative matrix sample that contains some level of endogenous analyte, resulting in a positive value for the y-intercept (). If the positive intercept (the endogenous level from the matrix) is subtracted from the standard curve, the intercept of the standard curve is near zero, and the concentrations of study samples can be calculated by peak ratio responses divided by the slope of the standard curve from the same batch. Although this strategy is straightforward to set up, the assay sensitivity will be limited by the amount of endogenous analyte present in the representative matrix.
As an alternative way of eliminating interference from high endogenous levels, it is commonly used a surrogate matrix with very low or no endogenous analyte to prepare the standard curve, so it results in a standard curve with zero or near zero intercepts. When a surrogate matrix is used, demonstration of parallelism between standard curves prepared in the authentic matrix and in the surrogate matrix is a key experiment to indicate that the selected matrix is appropriate for the assay. Although multiple articles have reported on the concept of parallelism for ligand-binding assays with nonlinear response patterns for dilution recovery [Citation2–4], the use of parallelism for LC-MS methods with a linear relationship between instrument response and analyte concentration has not been defined well. As for US FDA and ICH regulatory guidelines [Citation1,Citation5], there is only a general statement that parallelism should be evaluated for endogenous compound assays and no details for LC-MS-based biomarker assays. A recent study compared three methods of assessing the parallelism of urine creatinine quantitation by LC-MS/MS [Citation6]. The researchers indicated that the spiking recovery and dilution recovery methods had a significant variation in % bias than the background subtraction method. However, there was not a criterion for slopes to assess parallelism of the surrogate matrix.
Here the authors propose two criteria that can be used for the selection of the appropriate matrix for a standard curve. One is the slope acceptance criterion to assess parallelism and the other is an endogenous level criterion for achieving desired lower limit of quantitation (LLOQ). The corresponding author in this article first presented the slope criterion for the selection of surrogate matrix at the 15th Workshop on Recent Issues in Bioanalysis (WRIB) in 2020 and then she presented the endogenous level criterion at the 16th WRIB in 2021. The WRIB 2020 and 2021 white papers appeared in recent issues of Bioanalysis and briefly summarized the respective presentations [Citation7,Citation8]. Although there was good feedback from the WRIB audience, there was no consensus regarding the use of the slope criteria as regulatory guidance; however, more feedback from bioanalytical liaisons in the field is expected to be received after their use.
Mathematical derivation of slope acceptance criteria
Slope is an important parameter for the calculation of analyte concentrations when an analyte concentration is linearly proportional to its instrument response. Different matrices may result in a shift in the standard curve slope that could impact interpolated concentrations for unknowns. To ensure that a selected matrix for standard curve preparation results in an overall acceptable level of bias compared with the authentic matrix, the authors have derived the following equations to determine the allowable % slope difference based on the linear standard curve equation:
Intercept = 0 when using the background subtraction method OR surrogate matrix without endogenous analyte
(Equation 1)
where Rau = peak area ratio of analyte to internal standard in study samples with authentic matrix, Sau = slope from authentic matrix standard curve, and Cau = concentration in the authentic matrix (true value). If concentration limits are allowed for +15% bias [Citation5], using the slope of surrogate matrix standards, we will express the following equation:
(Equation 2)
where
Rau = peak area ratio of analyte to internal standard in study samples with authentic matrix;
Ssur = slope in the surrogate matrix;
1.15 × Cau = measured concentration if using a surrogate standard curve.
The slope from authentic matrix Sau based on EquationEquation 1(Equation 1)
(Equation 3)
The slope from surrogate matrix Ssur based on EquationEquation 2(Equation 2)
(Equation 4)
To test the difference between two slopes, EquationEquation 3(Equation 3) & EquationEquation 4
(Equation 4) are placed in the below formula:
(Equation 5)
(Equation 6)
(Equation 7)
(Equation 8)
In summary, based on EquationEquation 8(Equation 8) , we have a generic formula related to bias of concentration accuracy
(Equation 9) where B is the allowable accuracy % bias criterion and is set as +15 or -15% for most LC-MS/MS assays or criteria ± B % bias in Table 1 for different purposes such as reagent qualification of new standards in which comparison of two standard curve lots using different matrix lots but the same species has smaller bias% criteria between the two lots of standards.
The upper % bias limit corresponds to the lower slope difference and vice versa. Therefore, the % slope difference is calculated as -13.0% when using +15% bias, whereas the % slope difference is +17.6% when using -15% bias. It can be concluded that the slope difference between the surrogate matrix and an authentic matrix is -13.0 to +17.6% when the allowable accuracy bias criterion is set from +15 to -15%. Since a slope has a reciprocal relationship with its concentration, the slope criterion range is an asymmetric range corresponding to the symmetric % bias accuracy of the concentration. Using a similar mathematical derivation, the authors have established a generic formula in EquationEquation 9(Equation 9) in which a % slope difference criterion corresponds to allowable concentration bias criteria, B. The % bias acceptance criteria (5–30%) versus the corresponding % slope difference range criteria using this generic equation are listed in . Although the % bias criterion of 15% is typically used for LC-MS/MS assays, a smaller % bias, such as 5, 7, or 10%, may be used for control of long-term performance shifts when new matrix lots are qualified for the same LC-MS/MS method. Ultimately, acceptance criteria for % slope difference versus accuracy % bias should be based on the context of use.
Explanation of slope acceptance criterion
Two standard curves are plotted in . One is prepared in an authentic matrix and the other is prepared in a surrogate matrix. In the authentic matrix standard curve, there is a positive intercept due to the presence of the endogenous analyte in the biological matrix, whereas there is a near zero intercept in the surrogate standard curve. For concentration of study samples, the ratios of peak response (area or height) of analyte to internal standard in the authentic matrix are ‘true’ concentrations, and the peak area ratios (analyte to internal standard) of tested samples can be regressed by either the slope of authentic matrix standard curve (using background subtraction method) or the slope of surrogate matrix standard curve. demonstrates that as the slope increases, the concentration of the study sample will be lower than the true values from the surrogate matrix standard curve.
Because of a relatively large variation in slopes with the same matrix in standard curves using the same bioanalytical method in different batches [Citation2], it is strongly recommended that at least two analytical runs of parallelism experiments are conducted so that the slope criteria can be established instead of saying no slope criteria in FDA guidance [Citation9]. Using the proposed EquationEquation 9(Equation 9) , a scientist can ensure that a selected surrogate matrix will result in an acceptable level of bias compared with the authentic matrix. The authors also recommend using authentic matrix quality controls for long-term stability tests and relative matrix effect tests during method validation. In some cases, an authentic matrix with appropriate concentration levels is difficult to obtain. The surrogate matrix quality controls may be used for sample analysis if the validation study has shown equivalence of quality controls in both surrogate and authentic matrices. The generic slope criterion (EquationEquation 9
(Equation 9) ) can be used for any assays with a linear relationship between analyte concentration and peak ratio (or instrument signal), as it follows the same principle as a sample dilution recovery test using the surrogate matrix as its diluent; however, the slope criterion is much simpler and more accurate.
Verification of correctness of slope acceptance criteria
Demonstration of parallelism indicates that the selected surrogate matrix is appropriate for the bioanalytical assay. A parallelism assessment is usually leveraged early in method development to select an appropriate surrogate matrix. Parallelism is also applied to reagent qualification when selecting a new matrix lot for the preparation of the new standard curve. When the slope acceptance criterion is met in method development, the relative matrix effect for multiple authentic matrix lots should be tested. As reported in the 2018 white paper on recent issues in bioanalysis, six authentic matrix lots without spiking analyte (endogenous analyte only) and with spiking analyte are extracted in the same analytical run along with a surrogate matrix standard curve [Citation10]. For biomarker assays, reference materials are often obtained from external vendors in various forms (e.g., heterogenetic, recombinant proteins, fusion proteins, animal lipid tissues) or animal tissue, even human tissues for lipid compounds that may be different from the endogenous analytes in the disease population. In the relative matrix effect test, by spiking a reference material on top of the authentic matrix containing the endogenous analyte, we can verify whether the spiked reference standard and the endogenous level in the authentic matrix can be correctly summed up with acceptable precision and accuracy, even the endogenous biomarker and spiked reference material may not always behave in an additive manner [Citation11].
shows that a suitable surrogate matrix standard curve can regress six endogenous lots of plasma sample concentrations and the spiked analyte into each individual lot. The precision (n = 3) and accuracy within each lot were within 15% coefficient of variation and ± 15% bias. Among six lots of detected spiked concentrations, only 2.5% variation (<15%) was observed; thus, the surrogate matrix met all relative matrix effect acceptance criteria. The authors set the relative matrix criteria such that at least five of six authentic lots must meet precision and accuracy acceptance criteria when using a surrogate matrix standard curve. The acceptance criteria for precision and accuracy in concentration also depend on the context of use.
Four case studies are shown in , and these data verified that the recommended slope criteria in are correct for parallelism assessment and suitable surrogate matrix selection. The matrices in all four case studies have led to successful assay validations in the authors' laboratory.
In case study 1 (), the aim was to develop a high-sensitivity glucosylceramide plasma assay with an LLOQ of 0.10 μg/ml for monitoring levels of this biomarker in Gaucher disease type 1 patients. The assay procedures have been reported in a previous study by the authors' laboratory [Citation11]. Because of the relatively high levels of glucosylceramide in normal healthy human plasma (range: 1.95–5.04 μg/ml, n = 120 healthy donors), a surrogate matrix without endogenous analyte is needed to reach sufficient sensitivity. To search for a suitable surrogate matrix, artificial plasma, 0.3% human serum albumin in phosphate buffer solution, and several lots of delipidized plasma were tested. The slopes of standard curves with their linear coefficient r-values in different matrices are listed in . The matrix of 0.3% human serum albumin in phosphate buffer solution or artificial human plasma did not meet the standard curve % bias criteria (75% of standards in the curve need to be within ±15% bias from their nominal values [Citation5]) or the linear coefficient criterion (r < 0.990), then both surrogate matrices were rejected. Several delipidized plasma lots were tested, and the delipidized plasma lot 2 had a % slope difference of 19.2%, which did not meet the slope acceptance criterion range (-13.0 to +17.6%); therefore, this lot was rejected for the surrogate matrix used for glucosylceramide plasma standards. The rest of the delipidized plasma lots (lot 1, pooled delipidized plasma lot, lot 3 and lot 4) met the slope criterion range, which indicated that they can be appropriate surrogate matrices for glucosylceramide standard curve preparation. The plasma glucosylceramide assay was validated with LLOQ at 0.1 μg/ml using delipidized plasma as the surrogate matrix for its standard curve. The assay was validated using delipidized plasma.
Case study 2 () was a parallelism assessment for a human cerebrospinal fluid (CSF) biomarker 2 (BM2) assay. Because of the high cost of CSF blank matrix from healthy subjects and limited CSF lots containing low endogenous BM2 levels, artificial CSF was evaluated as a surrogate matrix for the CSF assay, and its parallelism against two authentic human CSF lots from two different vendors (BioIVT, NY, USA and Golden West Biologicals, Inc., CA, USA) was assessed. The results showed that the slope differences between the artificial CSF matrix and two individual authentic human CSF were -1.1% and +0.6% in the same run, which met the slope acceptance criterion range of -13.0 to +17.6%. Six human CSF lots were evaluated for relative matrix effect and passed well. Therefore, the artificial CSF lot can be used instead of authentic human CSF for the preparation of the standard curve. The CSF biomarker 2 assay was successfully validated using artificial CSF.
Endogenous level acceptance criterion for desired LLOQ
The slope criterion for the surrogate matrix standard curve determines whether the surrogate matrix is appropriately parallel to the authentic matrix standard curve. However, when an endogenous analyte exists in the surrogate matrix or a selected matrix, the parallel matrix does not guarantee that the method will meet the desired sensitivity. Slope parallelism and assay sensitivity are two independent factors for a surrogate matrix or a new authentic matrix lot. For this reason, the endogenous criterion was discussed at the 15th WRIB and published in a 2021 white paper on recent issues in bioanalysis [Citation8]. In the standard background subtraction method, a series of standard solutions are spiked into each aliquot of the same biological matrix blank lot containing the endogenous analyte. However, it is challenging to distinguish between the spiked LLOQ level and the endogenous level in the biological blank matrix if the difference is within the allowed variability of the signal. Theoretically, if a spiked LLOQ concentration is 20% of the endogenous level (i.e., the total response is 120% of the endogenous analyte response), then the ratio of endogenous concentration without a spike to the net LLOQ concentration (i.e., total spiked LLOQ response in the matrix minus the endogenous level of the blank matrix without the spike) is 5.0. However, a ratio of 5.0 does not always work for valid LLOQ of biomarker assays in the authors' laboratory.
illustrates that if the endogenous level at peak A is too high and a low LLOQ is spiked at peak B, they may not show enough difference; therefore, LLOQ cannot be achieved to meet accuracy and precision criteria (i.e., < ±20% for bias and <20% coefficient of variation, %CV). The authors' experimental observations showed that the ratio of endogenous peak response to net LLOQ response must be <4.0 so that assay sensitivity can be achieved. When establishing a new method using the authentic matrix or a surrogate matrix containing endogenous analyte concentration, it is hard to know what assay LLOQ level will work for the available matrix lots. Therefore, the authors recommend screening 15–20 lots of normal matrix samples for estimation of the endogenous range using a surrogate matrix standard curve before parallelism evaluation is tested. The ratio of endogenous level to the desired LLOQ must be <4.0; the lower the ratio, the easier it is to achieve the desired LLOQ. When the endogenous criterion is not met, we can either lower the endogenous level in the matrix or raise the LLOQ concentration to make the ratio <4.0.
The ratio cutoff of 4.0 is based on the typical accuracy criteria for LC-MS/MS at LLOQ of ± 20% bias [Citation1,Citation5] and experimental observations for multiple biomarker assays. Case studies 3 and 4 demonstrated that a ratio <4.0 reached suitable method sensitivity.
In case study 3 (), endogenous BM3 (biomarker 3) levels in human CSF were about 20–50 ng/ml after screening 15–20 human CSF lots using an artificial CSF standard curve regardless of whether the surrogate matrix was suitable at the initial development stage. However, to effectively monitor treatment-related changes, the desired LLOQ is 5 ng/ml. To achieve a ratio <4.0 (endogenous BM3 level divided by desired LLOQ of 5.0 ng/ml), the normal human CSF lots cannot be used (the ratio of 6.9 does not meet the <4.0 criterion). Parallelism assessment was conducted of an artificial CSF lot against authentic human CSF lot 1 and against human authentic CSF lot 2, respectively. The artificial CSF lot showed that % slope differences were 18.6% and 17.7%, respectively, which were outside of the slope criterion range (-13.0% to 17.6%), so the artificial CSF matrix was not suitable for the standard preparation for this assay.
In the plot of artificial CSF BM 3 (biomarker 3) standard curve and human CSF BM3 standard curve, the authors found that the two standard curves were not parallel, but rather crossed each other. As an alternative, two mixed matrices, one consisting of 50% artificial CSF and 50% human CSF lot 1 in volume and the other matrix consisting of 50% artificial CSF and 50% human CSF lot 2 in volume were evaluated. The slopes of the 50% artificial CSF/50% human CSF matrix were similar to the two human CSF lots individually, and the endogenous BM3 level was significantly lower after the two authentic CSF lots were diluted with artificial CSF. The mixed matrix lots containing only 50% artificial CSF and 50% human CSF met the % slope difference criteria (8.7 and 1.9%, respectively, within the range of -13.0 to +17.6%) and endogenous level ratio criteria (<4.0). The ratios of endogenous level to LLOQ (5 ng/ml) were 3.9 and 2.3, respectively. Overall, data demonstrated that 50% artificial CSF/50% human CSF matrix could be used to replace authentic CSF for CSF BM3 standard curve matrix. Using the mixed CSF surrogate matrix led to successful method validation.
With regard to case study 4 (), because of a change in the context of use, LLOQ for an old plasma BM1 (biomarker 1) method needed to be lowered from 200 to 100 μg/ml. Without knowing the assay development history, it was simpler to determine which matrix could meet the slope difference and endogenous ratio criteria. Standard curves were prepared using three different matrices: pooled human plasma, pooled delipidized plasma, and 50% delipidized human plasma/50% human plasma. The two surrogate matrices (pooled delipidized plasma lot and 50% delipidized plasma/50% human plasma lot) showed % slope differences of 6.2 and -2.7%, respectively, from the authentic human plasma. Both surrogate matrices met the slope difference criterion range (-13.0 to +17.6%). The authors concluded that all three matrices met the endogenous level criterion (ratio <4.0), with a ratio of endogenous BM1 concentration to desired assay LLOQ (5 ng/ml) of 2.67 for human plasma, 0.172 for delipidized plasma, and 1.79 for 50% delipidized plasma/50% human plasma. In summary, any one of the three matrices can be used for the revised plasma BM1 method to achieve LLOQ at 100 μg/ml. The method was successfully revalidated using the authentic matrix (human plasma).
Conclusion
Evaluation of slopes for standard curves prepared in authentic and surrogate matrices is a key parameter for assessing parallelism in LC-MS/MS biomarker and pharmacokinetic assays with a linear relationship between instrument response and analyte concentration. The two slopes of the standard curves in the authentic matrix and in the surrogate matrix should be evaluated in the same analytical run for at least two runs during assay validation. The % slope difference criterion range can be calculated with a generic formula related to the assay accuracy acceptance criterion of ± % bias (B): % slope difference = {[1/(1 + B)] - 1} × 100. If the concentration accuracy criterion is set as ± 15% bias, then the % slope difference criterion will be set in the range of -13.0 to +17.6%. The slope has a reciprocal relationship with concentration; therefore, the % slope difference criterion range is an asymmetric range in percent. In addition to the slope criterion, if a surrogate or new authentic matrix lot contains the endogenous analyte, the ratio of endogenous analyte concentration in the tested matrix lot to assay LLOQ concentration must be <4.0 for the desired LLOQ to be achievable. The slope criterion and endogenous level criterion are independent of each other. When both are met, the tested matrix can be used for standard curve preparation.
Table 1. The % slope difference criteria corresponding to % bias of analyte concentration acceptance criteria.
Table 2. Example of relative matrix effect test design.
Table 3. Selection of surrogate matrix using slope criteria and endogenous criteria in LC-MS/MS assays.
Summary points
The slope acceptance criterion for LC-MS/MS assays is derived from mathematical equations, and its correctness is verified when assay standard curves are linear.
The generic formula % slope difference = {[1/(1 + B)] - 1} × 100 can be used to calculate % slope difference criterion range based on the positive and the negative bias% accuracy acceptance criterion (B in the formula).
If assay accuracy criteria are ± 15% bias, the slope difference can be calculated to be in the range of -13.0% to +17.6%. The slope criterion is very useful for the selection of an appropriate matrix to replace the authentic matrix.
To reach the desired lower limit of quantitation in the selected matrix, the ratio of endogenous analyte concentration in the matrix to desired lower limit of quantitation concentration needs to be <4.0. The smaller the ratio, the easier it is to achieve the lower limit of quantitation.
Slope parallelism and endogenous level criteria are independent of each other.
If both the slope criterion and the endogenous level criterion are met, the tested matrix can be used to replace the authentic matrix in the assay for its standard curve preparation.
Acknowledgments
The authors would like to thank past group members K Zheng and LL Chung for their plasma glucosylceramide method development work in 2014 (shown in case study 1 of this article).
Financial & competing interests disclosure
The authors have no relevant affiliations or financial involvement with any organization or entity with a financial interest in or financial conflict with the subject matter or materials discussed in the manuscript. This includes employment, consultancies, honoraria, stock ownership or options, expert testimony, grants or patents received or pending or royalties.
No writing assistance was utilized in the production of this manuscript.
References
- ICH . ICH Humanized Guideline, Bioanalytical Method Validation, M10. Draft version (2019). https://www.wrib.org/PDFs/ICH_M10_BMV_Draft_Guideline-190227.pdf
- Jones BR , SchultzGA, EcksteinJA, AckermannBL. Surrogate matrix and surrogate analyte approaches for definitive quantitation of endogenous biomolecules. Bioanalysis4(19), 2343–2356 (2012).
- Tu J , BennettP. Parallelism experiments to evaluate matrix effects, selectivity, and sensitivity in ligand-binding assay method development: pros and cons. Bioanalysis9(14), 1107–1122 (2017).
- Mehta D , PurushithamaS, StevensonL. Parallelism: the foundation of biomarker assay development and validation. Bioanalysis10(12), 897–899 (2018).
- US Department of Health and Human Services . Bioanalytical method validation: guidance for industry (2018). www.fda.gov/files/drugs/published/Bioanalytical-Method-Validation-Guidance-for-Industry.pdf
- Qiu X , SavarynPJ, RuterboriesJK, JiCQ, JenkinsG. Comparison of three parallelism assessment methods of biomarker quantification by LC-MS/MS: a case study of the bioanalysis of creatinine in human urine samples. Bioanalysis14(5), 279–287 (2022).
- Neubert H , AlleySC, LeeAet al. 2020 white paper on recent issues in bioanalysis: BMV of hybrid assays, acoustic MS, HRMS, data integrity, endogenous compounds, microsampling and microbiome (part 1 – recommendations on industry/regulators consensus on BMV of biotherapeutics by LCMS, advanced application in hybrid assays, regulatory challenges in mass spec, innovation in small molecules, peptides and oligos). Bioanalysis13(4), 203–238 (2021).
- Kaur S , AlleySC, SzapacsMet al. 2021 white paper on recent issues in bioanalysis: mass spec of proteins, extracellular vesicles, CRISPR, chiral assays, oligos; nanomedicines bioanalysis; ICH M10 section 7.1; non-liquid and rare matrices; regulatory inputs (part 1A – recommendations on endogenous compounds, small molecules, complex methods, regulated mass spec of large molecules, small molecule, PoC and part 1B – regulatory agencies' inputs on bioanalysis, biomarkers, immunogenicity, gene and cell therapy and vaccine). Bioanalysis14(9), 505–580 (2022).
- Wakamatsu A , OchiaiS, SuzukiEet al. Proposed selection strategy of surrogate matrix to quantify endogenous substances by Japan Bioanalysis Forum DG2015-15. Bioanalysis10(17), 1349–1360 (2018).
- Welink J , XuY, YangEet al. 2018 white paper on recent issues in bioanalysis: ‘a global bioanalytical community perspective on last decade of incurred samples reanalysis (ISR)’ (part 1 – small molecule regulated bioanalysis, small molecule biomarkers, peptides and oligonucleotide bioanalysis). Bioanalysis10(22), 1781–1801 (2018).
- Zheng K , JiAJ, ChungLLet al. Enhancement of human plasma glucosylceramide assay sensitivity using delipidized plasma. Mol. Genet. Metab. Rep.8, 77–79 (2016).