
Abstract
Background: Enalapril (EPL) is an angiotensin-converting enzyme inhibitor for the treatment of hypertension and chronic heart failure. Enalaprilat (EPLT) is an active metabolite that contributes to the overall activity of EPL. Aim: To quantitate EPL along with its metabolite EPLT using LC–MS/MS, a bioanalytical method was developed and validated with tolbutamide in human plasma using a protein precipitation technique. Results: The sensitive and selective method has an LLOQ of 1 ng/ml with a linearity range of 1–500 ng/ml for both EPL and EPLT using 300 µl of plasma without any matrix effect. Conclusion: Linearity, specificity, accuracy, precision and stability, as well as its application to the analysis of plasma samples after oral administration of 20 mg of EPL maleate in healthy volunteers demonstrate applicability to bioavailability/bioequivalence studies.
Lay abstract The present study describes a sensitive, selective, simple, accurate and reproducible LC–MS/MS method for the simultaneous determination of both enalapril (EPL) and enalaprilat (EPLT) in human plasma. The results obtained indicate the high sensitivity of the described method for analysis of EPL and EPLT, which render this method particularly useful for pharmacokinetic or bioequivalence studies. The proposed method has been applied for the analysis of EPL and EPLT in the plasma of healthy volunteers in a single-dose pharmacokinetic study.
Figure 1. MS/MS fragmentation pattern of (A) enalapril (EPL, (B) enalaprilat (EPLT) and (C) tolbutamide (TBM).
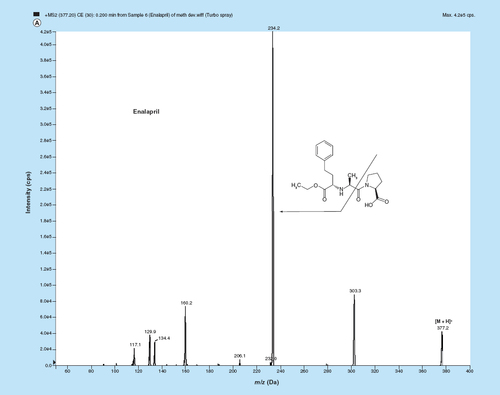
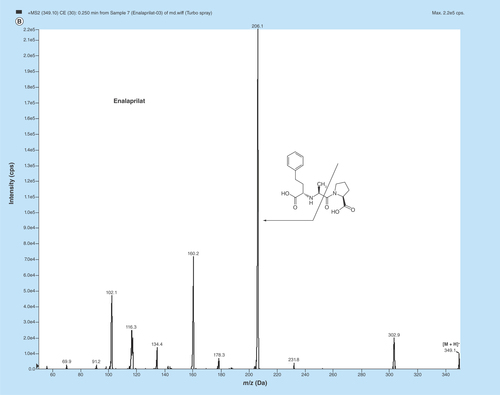
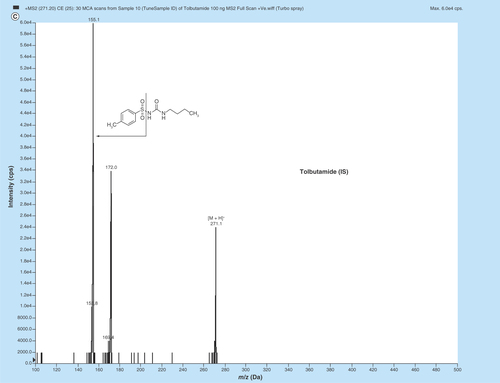
Figure 2. Typical MRM chromatograms of EPL, EPLT and TBM (IS) in (A) human double blank plasma, (B) human blank plasma with IS and (C) human blank plasma spiked with EPL and EPLT at LLOQ (1 ng/ml) with IS.
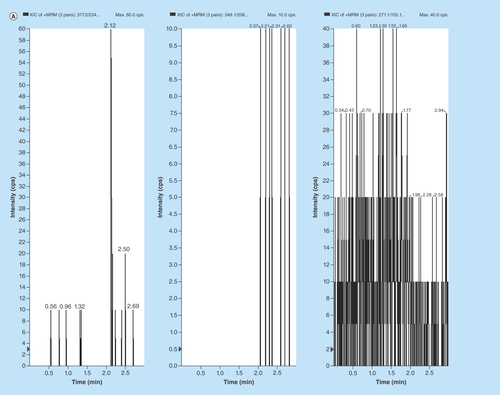
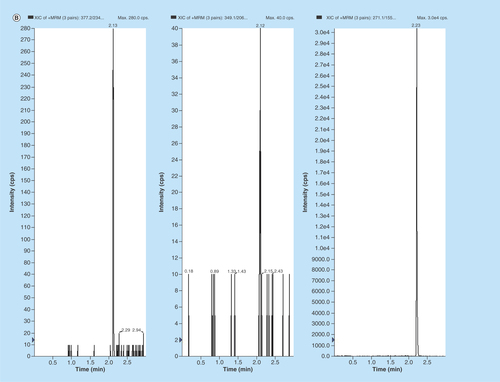
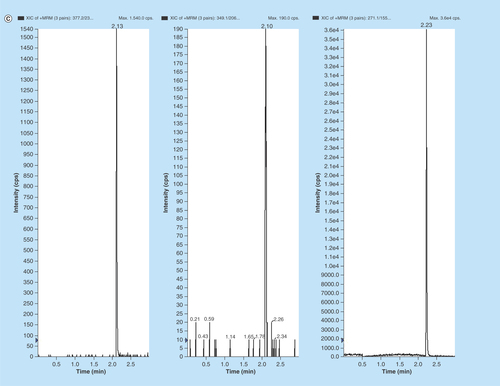
Figure 3. Representative MRM chromatograms of volunteer plasma samples of (A) EPL, (B) EPLT and (C) TBM (IS) spiked in human volunteer plasma at 100 ng/ml.
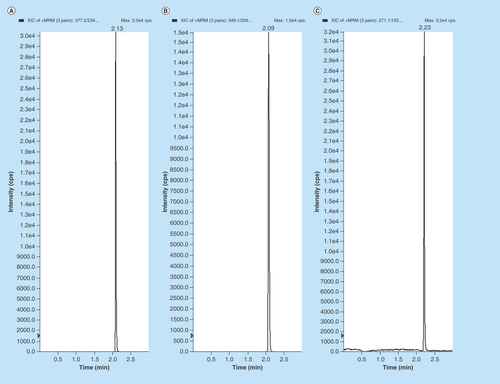
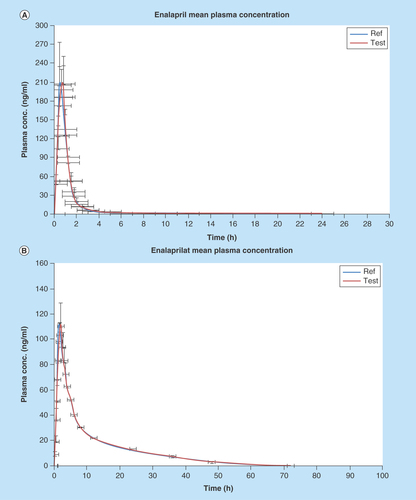
Figure 4. Graphical representation of mean plasma concentration versus time of (A) EPL and (B) EPLT following 20 mg single oral dose of test and reference preparation to 30 healthy human volunteers.
Hypertension and cardiovascular disease are a major cause of morbidity in India and abroad. Antihypertensives are a class of drugs that are used to treat hypertension (high blood pressure) [Citation1,Citation2] and cardiovascular disease [Citation3,Citation4]. Enalapril maleate [(S)-1-(N-(1-(ethoxycarbonyl)-3-phenylpropyl)-l-alanyl)-l-proline, (Z)-2-butenedioate salt] is a salt of both enalapril (EPL) and maleic acid [Citation1,Citation5–7]. EPL is a potent antihypertensive drug, a vasodialator and also an angiotensin-converting enzyme (ACE) inhibitor [Citation5,Citation8–13] which is widely used for the treatment of hypertension and congestive heart failure [Citation1,Citation4,Citation14–17]. In the kidneys, rennin is synthesized and after release into the circulation it acts on a plasma precursor for the production angiotensin I. ACE is a peptidyl dipeptidase which catalyzes the conversion of angiotensin I to angiotensin II, a potent vasoconstrictor substance that stimulates the release of aldosterone from the adrenal cortex and also increases endogenous bradykinin concentrations [Citation16]. Thus, there is an increase in blood pressure and cardiac failure. ACE inhibitors such as EPL inhibit the conversion of angiotensin I to angiotensin II decreasing blood pressure and aldosterone secretion, slightly increasing serum potassium levels, and causing sodium and fluid loss. Also, increased prostaglandin synthesis is involved in the antihypertensive action [Citation6–7,Citation13,Citation18–19].
After absorbtion from the gastrointestinal tract, EPL is hydrolyzed of its ethyl ester, in other words, it is de-esterified in vivo to its active metabolite enalaprilat (EPLT) by hepatic metabolism in the liver. EPLT is the only metabolite of EPL [Citation1,Citation16,Citation18,Citation20–21]. It is a more potent and effective ACE inhibitor than EPL and is also effectively used in the treatment of hypertension and congestive heart failure through dilation of peripheral vascular resistance without causing any significant changes in heart rate or cardiac output [Citation14,Citation18,Citation22]. After oral administration of EPL, maximum plasma concentration is reached within about 1 h [Citation14,Citation18,Citation22–23]. In healthy subjects EPL is rapidly absorbed from the GI tract and bioavailability is about 60–70%. The terminal half-life of EPL is approximately 2 h [Citation11,Citation14,Citation18,Citation22–23]. The absorption of EPL after oral administration is not influenced by the presence of food in the GI tract [Citation11,Citation18]. However, after 4 h it is not detected above 10 ng/ml [Citation14,Citation22]. EPLT is detectable for upto 72 h and maximum plasma concentration is observed at approximately 3–4 h after administration with a half-life of approximately 30–35 h [Citation14,Citation18,Citation22–23]. When administered orally, EPLT is poorly absorbed. Primarily, the excretion of EPL is renal. In the urine and feces, approximately 94% of the dose is recovered as EPL or EPLT. Also, in urine EPLT is the major components which accounting for about 40% of the dose [Citation18].
From literature review we have found several bioanalytical methods of both HPLC and MS for the simultaneous quantification of EPL and EPLT in human plasma [Citation7,Citation14,Citation16–18,Citation20,Citation22–25]. These methods describe the pharmacokinetics or bioequivalence studies of both EPL and EPLT after administration of the drug enalapril maleate in the human body. An LC–MS method by Yoon et al. reported that after oral intake the mean value of Cmax is 102 ± 39 ng/ml and Tmax is 0.96 ± 0.36 h [Citation7]. A GC–MS method demonstrated that after single oral administration of 20 mg of EPL to 24 healthy adult subjects pharmacokinetic parameters (mean ± SD) are 72.9 ± 41.6 ng/ml (Cmax), 4.0 ± 1.4 h (Tmax), 4.2 ± 1.6 h (T1/2) etc. After a single oral administration of 20 mg EPL maleate to 12 healthy volunteers Cmax are 152.1 ng/ml (EPL) and 88.5 ng/ml (EPLT), respectively [Citation20]. Another LC–MS/MS method reported that the maximum plasma concentration (Cmax) are 90.5 ± 28.4 and 47.5 ± 12.4 ng/ml, Tmax are 0.860 ± 0.310 and 4.20 ± 1.06 h, AUC0–t are 136 ± 36 and 401 ± 89 ng/ml h, AUC0–∞ are 138 ± 36 and 420 ± 91 ng/ml h and T1/2 1.35 ± 0.61 and 6.71 ± 2.22 h for EPL and EPLT, respectively [Citation24].
So, therefore a new LC–MS/MS method is required for development, validation and simultaneous quantification of EPL along with its active metabolite EPLT in human plasma through a pharmacokinetics or a bioequivalence study. This is owing to the fact that the active metabolite EPLT has low exposure to the central compartment in therapeutic human dose and is detectable in pictogram (LODs are 0.25 and 0.80 ng/ml for EPL and EPLT, respectively), and quantified in nanogram, levels in human plasma. Due to exposure to plasma in therapeutic dose in very low strength (20 mg), it is very difficult to use HPLC only. Hence, to perform pharmacokinetics or bioequivalence studies of this active drug metabolite, in other words, EPLT along with its pro-drug EPL in human plasma, a highly sensitive new LC–MS/MS method is needed. In the present investigation we have developed and validated such a bioanalytical method, which is very simple, fast, rapid and sensitive (LLOQ 1 ng/ml) in human plasma. In addition, this method has been implemented in 30 healthy male, adult, human volunteers under fasting conditions to establish the bioequivalence study for both EPL and EPLT.
Experimental
Chemicals, reagents & solvents
The active pharmaceutical ingredient of EPL (99.45%), EPLT (99.95%) and tolbutamide (TBM) (IS, internal standard) were purchased from Clearsynth Labs Pvt. Ltd., (Mumbai, India). HPLC grade methanol and acetonitrile were obtained from Merck Specialties Pvt. Ltd., (Mumbai, India) and guaranteed analytical reagent grade formic acid, chloroform, isopropyl alcohol were also obtained from Merck Specialties Pvt. Ltd, (Mumbai, India). Water used in the entire analysis was prepared from Milli-Q water purification system procured from Millipore (Elix, Milli-Q A10 Academic, MA, USA) until a resistively of 18.2 MΩ was achieved. The blank human plasma with EDTA-K3 anticoagulant was collected from clinical pharmacological unit of Bioequivalence Study Centre, Jadavpur University (Kolkata, India) and was stored at -20°C until use.
Instrumentation & chromatographic conditions
The LC system (Shimadzu, prominence) equipped with binary pump (LC-20AD), an autosampler set at 15°C (SIL-20A), an online solvent degasser (DGU-20A3) and column oven (CTO-10AS) were used to inject 10 µl aliquots of the processed samples on a C18 analytical column (50 mm × 3 mm, 5 µm, Phenomenex Kinetex). Separation and elution were achieved by gradient system using 0.1% formic acid in methanol and 0.1% formic acid in Milli Q water as the mobile phase, at a flow rate of 0.5 ml/min. The total LC run time was 3 min. Mass spectrometric detection was performed using tandem mass spectrometer API 2000 model (MDS Sciex, Toronto, Canada). LC–MS/MS detector analysis was performed with TurboIonSpray source interface in positive ionization mode. Direct infusion of 100 ng/ml of each analyte in methanol was made by syringe pump to optimize parameters to detect the most vivid signals of transitions from precursor to product ions. Quantification was performed using multiple reaction monitoring mode, based on protonated precursor → product ion transitions for EPL (m/z 377.2 → 234.2), EPLT (m/z 349.1 → 206.1) and TBM (IS) (m/z 271.1 → 155.0). Q1 and Q3 were maintained at unit resolution and dwell time was set at 200 ms. Source-dependent and compound-specific parameters were optimized by monitoring the m/z of precursor/product ions ( & ). Analyst software version 1.5 was used for instrument control, data acquisition and data processing. The optimized mass parameters are elaborated in & .
Stock solutions & working standards
Stock solutions of EPL and EPLT and TBM (IS) were prepared by dissolving accurately weighed samples in the methanol to obtain concentrations of 1 mg/ml. The stock solutions were then gradually diluted with diluent, in other words, methanol: water: 50:50 (v/v) to obtain standard working solutions for calibration at 10, 50, 100, 250, 500, 1000, 2500 and 5000 ng/ml for both EPL and EPLT. For preparation of calibration standards and quality control (QC) samples, appropriate aliquots of the stock solution or working solutions were added to drug-free pooled human plasma. The final concentrations were 1, 5, 10, 25, 50, 100, 250 and 500 ng/ml for the calibration standards and 1 ng/ml (LLOQ), 3 ng/ml (low), 200 ng/ml (medium) and 400 ng/ml (high) for QC samples. The working IS solution (TBM 500 ng/ml) was prepared in diluting solvent stated above. All stock solutions (1.0 mg/ml) and QC solutions were stored at -20°C and working standard solutions were stored at 4°C.
Sample preparation & extraction
Sample preparation was performed by simple protein precipitation method. Working stocks of EPL and EPLT were prepared in 50: 50 (v/v) mixture of methanol-water and spiked in blank plasma to get calibration standard samples. After thorough vortexing 300 µl plasma from each calibration standard sample and QC samples were crashed with 900 µl ice cold MeCN (acetonitrile) containing 1 µg/ml TBM (IS) followed by vortex mixing for 10 min and centrifugation at 10,000 rpm for 15 min. Supernatant was separated and loaded into autosampler vials for LC–MS/MS run. Volunteer samples were crashed and processed following the same procedure.
Method validation
The method validation was conducted in accordance with the guidelines US FDA or EMA for selectivity, sensitivity, linearity, precision, accuracy, recovery and stability [Citation26–32].
Selectivity & LLOQ
Selectivity is the ability of an analytical method to differentiate and quantify the analyte in the presence of other components in the sample. The specificity was defined as noninterference of EPL and EPLT at retention times from the endogenous plasma components and lack of cross-interference between analytes and IS using the suggested extraction procedure and LC–MS/MS conditions. The specificity of the method was tested by analyzing six different batches of blank human plasma containing anticoagulant comparing chromatograms of blank plasma with the corresponding spiked plasma samples. LOD was defined as three-times of the S/N and the LLOQ was the lowest standard on the calibration curve at which the response of analytes should be at least five-times the response compared with blank response and back-calculated analytes concentration should have precision not ≤20% of the CV and accuracy within 20% of the nominal concentration. As the method is intended to quantify more than one analyte, each analyte was tested for interference and selectivity was ensured at the LLOQ of the analytes.
Accuracy & precision
The accuracy of an analytical method represents the closeness of average test results incurred by the method to the actual concentration of the analytes. The precision of the analytical method describes the closeness of repeated individual measures of analytes. The deviation of the mean from the nominal value serves as the measure of accuracy. Mean value should be within 15% of the nominal value except at LLOQ, where it should not deviate by more than 20%. The precision determined at each concentration level should not exceed 15% of the CV except for the LLOQ, where it should not exceed 20% of the CV [Citation26–27,Citation29–32]. The ‘within-run’ precision and accuracy (assessment of precision and accuracy during a single analytical run) was estimated by analyzing five replicates of EPL and EPLT at three different QC levels-low, middle and high (LQC, MQC and HQC) in human plasma.
The ‘between-run’ precision and accuracy (assessment of precision and accuracy over time) was determined by analyzing the three level QC samples on three consecutive days. A total of six replicates of each QC concentration were assayed on day 1, day 2 and day 3. Precision is expressed as the percent CV (% CV), while accuracy is measured as the percent nominal (% nominal).
Recovery & matrix effect
The recovery of analytes in a particular assay represents the ratio of detector response obtained from the extracted analytes from the biological matrix to the detector response obtained from unextracted analytes. The percentage recoveries were determined by measuring the peak areas of the drug from the prepared plasma at six replicate of LQC, MQC and HQC samples. The peak areas of these QC Samples were compared with the absolute peak area of the unextracted standards containing the same concentrations of the EPL and EPLT.
The matrix effect was determined according to the procedures demonstrated by Matuszewski et al. [Citation33] and Ghosh et al. [Citation34]. Analytes were spiked in post extraction matrix from six different plasma donors at three QC concentrations. Then matrix effect was calculated as the ratio of peak response obtained from post extraction matrix samples to samples with those of the pure QC standards [Citation35]. Matrix effect of the internal standard was also calculated from the six different lots of plasma at a concentration of 50 ng/ml. Specificity of the method was ensured by using six different sources of plasma sample and comparing chromatograms of blank plasma with the corresponding spiked plasma samples.
Calibration curves & calculation procedures
On spiking the drug-free plasma samples with eight nonzero calibration working solutions covering the total range of quantitation (1–500 ng/ml conc. in plasma for both EPL and EPLT) along with a blank sample (spiked without drug and IS) and a zero sample (spiked with IS), the calibration curves were generated by plotting the ratios of AUC of analyte versus AUC of IS in y-axis against the calibration concentration ratios of drug to IS in plasma in x-axis by least-squares linear regression method following the equation, y = mx + c, where y represents the peak area ratio of analyte to IS, and x represents the plasma concentration of analyte respectively. The linearity of the method was evaluated using six different calibration curves. The LLOQ was defined as the lowest concentration yielding a S/N of at least 5 with a CV < 20% and accuracy of 80–120%. The acceptance criterion for other standard concentrations was within 15% deviation from the nominal values [Citation26–27,Citation29–32].
Stability
Stability studies of EPL and EPLT in human plasma were performed with three different concentrations of QC sample (3, 200 and 400 ng/ml) of the analytes each in six replicates. The bench-top stability was performed for each analyte in plasma was determined by three QC levels in six replicates for 8 h at ambient temperature (24 ± 2°C). The autosampler stability of EPL and EPLT were determined periodically by injecting replicate and processed plasma samples after the sample loading up to 24 h at 4°C. For determination of freeze–thaw stability of the analytes, the spiked plasma samples were frozen for 24 h at -20°C and thawed unassisted at room temperature. When completely thawed, the samples were refrozen for 12–24 h at -20°C. On repeating the freeze−thaw cycle for 2 days, bioanalysis was done on the third day. For short-term stability, frozen plasma samples (-20°C) were kept at room temperature for 4 h before sample processing. Long-term stability was evaluated after storing the frozen plasma samples at -20°C for the whole duration of the study which was almost 30 days. The stability of the prepared plasma samples was tested after keeping the processed samples in the autosampler at 4°C for 24 h.
Application to a bioequivalence study
The developed and validated LC−ESI−MS/MS assay method was applied to compare the bioavailability of two formulations of EPL by conducting the single oral dose, open label, randomized, two period, two sequence, crossover study [Citation27] of 30 healthy Indian volunteers (male) with a mean age of 27.53 years (range 21–34 years), mean body weight of 60.23 kg (range 54–66 kg) and mean body height of 168.30 cm (range 162–174 cm) under fasting condition. After an overnight fasting period (10 h), each volunteer was administered either single dose of test preparation of EPL 20 mg Tablet (containing EPL maleate 20 mg, manufactured by JV LLC ‘Pharmland,’ The Republic of Belarus) or reference preparation Renitec 20 mg Tablet (containing EPL maleate 20 mg, manufactured by Merck Sharp & Dohme B.V., The Netherlands) with 240 ml of water, in the sequence determined by randomization. A wash out period of 21 days had been followed between two consecutive dosing sessions. The protocol (Protocol No. 03/15/296) of the study was accepted by the Drugs Controller General of India, New Delhi, India and approved by the registered Institutional Independent Ethics Committee (Reg. No. ECR/103/Indt/WB/2013), Kolkata, India. Before participation in the study, a written informed consent form was given to all participants. Total 23 blood samples were collected from each volunteer from anticubital vein at 0 h (before drug administration), 0.17, 0.33, 0.5, 0.75, 1.0, 1.42, 1.5, 2.0, 2.5, 3.0, 3.5, 4.0, 4.5, 5.0, 6.0, 8.0, 10.0, 12.0, 24.0, 36.0, 48.0 and 72 h (after drug administration) in coded centrifuge tubes containing EDTA. Blood samples were centrifuged immediately and the plasma was separated into duplicate polypropylene tubes and stored the samples at -20°C until analysis. All the physical and medical examinations of all the volunteers were performed throughout the study period starting from the screening of the volunteers. The following pharmacokinetic parameters were considered for evaluation of the bioequivalence study between test and reference products – major parameters (according to FDA), Cmax – observed maximum plasma concentration; AUClast – area under plasma concentration/time plot until the last quantifiable value; auxiliary parameters, Tmax – sampling time of the maximum plasma concentration; t-half – terminal elimination half life time; AUCtotal – area under plasma concentration/time plot extrapolated to infinity. All the pharmacokinetic parameters were determined by WinNonlin software (version 6.3) from Pharsight, USA. The analysis of variance was performed on the pharmacokinetic parameters. Finally, the 90% CIs of the pharmacokinetic parameters characterizing the tested/reference products were determined.
Results & discussion
Method development
To develop and validate a selective and rapid assay method for simultaneous quantification of both EPL and EPLT in human plasma, it is important to optimize chromatographic conditions, mass spectrometric parameters and the extraction technique.
Mass spectrometry
MS parameters having electrospray as the ionization source were optimized by injecting standard analyte solution of 100 ng/ml into the LC–MS/MS and operating in the multiple reaction monitoring mode. MS parameters were tuned in both positive and negative ionization modes for EPL, EPLT and TBM (IS). Positive ionization mode has shown much higher signal intensities than those in negative ionization mode, since the analytes and IS have the ability to accept protons. EPL, EPLT and TBM (IS) showed the formation of predominant protonated [M+H]+precursor ions at m/z 377.2, 349.1 and 271.1, respectively, in Q1 MS full scan spectra. The most copious ions found in the product ion mass spectrum were m/z 234.2, 206.1 and 155.0 for EPL, EPLT and TBM (IS), respectively (). Observing maximum response of the product ion the source-dependent and compound-dependent parameters ( & ) were determined. ESI was selected compared with the atmospheric chemical ionization as the ionization source as it gave high spectral response for both the analytes and the regression curves obtained were linear. The ESI source provided reliable data on method development, validation and for quantitation of samples from human volunteers.
Liquid chromatography
Since EPL and EPLT have almost similar structure and physicochemical properties, it was not difficult to optimize chromatographic conditions including mobile phase selection, flow rate, column type and injection volume that result sharp peak shape and adequate response. EPL and EPLT have less structural variations with pK a (strongest acidic) of 3.0 and 2.97, polar surface area of 95.9 and 106.9, respectively [Citation36]. Solvents such as acetonirtile, methanol in different ratio with buffers such as ammonium acetate, ammonium formate as well as acid additives such as formic acid and acetic acid as an enhancer in varying strength were tried. After several trials it was observed that gradient system using 0.1% formic acid in methanol at pump B and 0.1% formic acid in Milli Q water at pump A as the mobile phase was most appropriate to give best sensitivity, efficiency and peak shape. Formic acid helped to improve the peak shape and spectral response. Different kinds of columns or stationary phases such as C18 of PhenomenexKinetex, C18 and CN of Agilent were tried for checking better selectivity and sensitivity during method development. The use of a short chromatographic column (PhenomenexKinetex C18, 100A 50 × 3 mm, 5 µm particle size) and optimized flow rate (0.50 ml/min.) helped in the separation and elution of all the analytes of interest in a very short time with good peak shape and response, whereas the use of Agilent C18 and CN resulted in poor peak shape and in response also. So finally this Phenomenex Kinetex C18 column was selected for our analysis. The total chromatographic run time was 3.0 min for each run.
Selection of internal standard
In the initial phase, several compounds, such as metformin, TBM, losartan etc. were investigated and finally TBM was concluded as a best choice of internal standard (IS). It has shown no interference with the performance of the developed method and the intensity of molecular ion peak in mass spectrometric analysis remained unaffected as compared with others ( & ). The flow rate 0.5 ml/min was optimized on basis of the retention time of analytes and gradient elution provides faster separation with the chromatographic conditions as described above.
Method validation
Selectivity & LLOQ
Representative chromatograms of the double blank and blank plasma samples spiked with IS are shown in . Also, blank plasma spiked with 1 ng/ml of EPL and EPLT at their LLOQs together with 100 ng/ml of the TBM (IS) are shown in . The retention time for EPL, EPLT and TBM (IS) were found 2.13, 2.09 and 2.23 min (), respectively. Inspection of chromatograms reveled that no significant interference from the plasma matrix was observed at the retention times of analytes or IS indicate the selectivity or specificity of the method. In the present assay, LOD were 0.25 and 0.80 ng/ml in plasma and LLOQ was found 1 ng/ml in plasma for both EPL and EPLT respectively, with an injection volume of 10 µl.
Accuracy & precision
Summary of accuracies and precisions for intra- and inter-day runs for all analytes were shown in . Mean accuracies of the intraday QC samples ranged from 103 to 113% and 93–103%, respectively, for EPL and EPLT while that of interday samples ranged from 100 to 106% and 96 to 99%, respectively, for EPL and EPLT. The CV for all intraday QC samples ranged from 3.4 to 11.8% and 3.1–10.3% for EPL and EPLT, respectively. The CV for interday ranged from 7.7 to 10.9% for EPL and 6.7 to 13.7% for EPLT. These data ensure that the present method has a satisfactory accuracy, precision and reproducibility for the quantification of both EPL and EPLT in human plasma. In general the method is accurate and precise as per the requirements of the FDA and EMA guidelines [Citation26,Citation32].
Recovery & matrix effect
The recovery study of protein precipitation method was performed on three QCs concentrations levels as shown in that ranges from 96.5 to 99.3% and 94.2 to 98.8%, respectively, for EPL and EPLT. The recovery of both analytes is sufficiently high and data indicated good sensitivity, precision and accuracy.
No significant matrix effect was found by comparing the AUC ratios of the extracted QCs and IS with the AUC of unextracted QCs and IS obtained from the injecting raw solution prepared at similar concentration levels elaborated in .
Linearity of the assay
The assay result demonstrated a good linear response over the range 1–500 ng/ml for both EPL and EPLT in human plasma. The regression equations (n = 8) were y = 0.02697x +0.007590 (r = 0.99743) for EPL and y = 0.00524x +0.0014317 (r = 0.99727) for EPLT, where y is the peak area ratio of analyte to IS and x is the nominal plasma concentration. At calibration curve concentrations, the % CV and accuracy values ranged from 0.51 to 9.99% and 93.38 to 105.53% for EPL and from 2.67 to 28.39% and 96.49 to 109.80% for EPLT.
Stability
At the various QC concentrations, values of percent accuracy and coefficient of variation for bench-top, autosampler, freeze–thaw and long-term stability evaluation were deviated within the accepted range as summered in & for both EPL and EPLT, respectively. The autosampler stability was found stable for at least 24 h at 24°C temperature. Both analytes in control human plasma at room temperature were found stable at least for 8 h (bench top stability), stable in autosampler for 24 h and for minimum of three freeze and thaw cycles. Spiked plasma samples, stored at -20°C for long-term stability experiment, were found stable for minimum of 30 days. In general, the analytes were found stable under the different testing conditions with acceptable percent accuracy and CVs.
Application of LC–MS/MS method in bioequivalence study
The method was applied to evaluate plasma samples from 30 healthy volunteers after an oral administration of EPL 20 mg tablet. The mean plasma concentration time profile of EPL and EPLT in human volunteers is depicted in and the mean estimated pharmacokinetic parameters derived from the plasma concentration profiles are summarized in . No statistically significant differences were found in any parameter between the two formulations. The mean log transformed ratios of the parameters and the 90% CI values were all within the required ranges confirming the bioequivalence of the test and reference products.
Comparison to other methods
This bio-analytical method has several advantages over the previously reported methods [Citation9,Citation14,Citation16–17,Citation20,Citation25,Citation37]. Sample preparation is simpler and the chromatographic column and IS used are commercially available. The procedure for sample preparation and extraction are rapid and inexpensive due to use simple protein precipitation technique by acetonitrile. The method is very sensitive (LLOQ is very low) and selective and also, the extraction recoveries of both EPL and EPLT are better (more than 90%) compared with other published methods. The method prevented phospholipid-based matrix effect on the analytes of interest. So, the results of matrix effect showed that ion suppression or enhancement from the plasma matrix components was abolished. Another advantage of this method is the use of a gradient mobile phase of simple composition with reduction in run time of analysis (3.0 min), which allows determination of the analytes more precisely. The stability studies have been carried out extensively. Finally, the validated method was applied to pharmacokinetic and bioequivalence study of both EPL and EPLT in Indian volunteers.
Conclusion
The main objective of this work was to develop a simple, specific, rapid, highly sensitive, rugged and high-throughput bio-analytical method for simultaneous determination of an active metabolite EPLT with its prodrug EPL in human plasma. The advantage of using a simple protein precipitation technique in the present work is due to high extraction recovery, minimization of the sample extraction time, present method has been used only 300 µl of human plasma and hence to reduce the amount of blood withdrawn from volunteers during study, proposed method is applicable in any strength of the drug for bioequivalence studies, it gives cleaner and consistent extraction without any significant matrix effect, because of rapid sample preparation technology and short chromatographic run time (3.0 min), large numbers of pharmacokinetic samples can be analyzed.
Therefore, the bio-analytical method discussed above is precise, accurate, reproducible, stable and robust enough to enable pharmacokinetic, bioavailability or bioequivalence studies on a long-term basis. Also, this bio-analytical method is simple, selective, rapid, specific, highly sensitive and fully validated by FDA and EMA guidelines and the resulting pharmacokinetic parameters would be helpful to provide some guidance to clinical application and investigation.
Future perspective
In 5–10 years’ time, we believe that this method will be used to evaluate compartmental pharmacokinetic study under the framework of long-term therapeutic effect. This will also help to establish the therapeutic efficacy of the drug EPL. Pharmacokinetics or quantitative study of active metabolites in plasma is a very crucial part of drug development studies as sometimes it shows that the active metabolites are more pharmacologically active substances than the prodrug after entering the systemic circulation. In India, the in vivo pharmacokinetics study of active metabolites is limited. Thus, in the near future, this kind of approach will enrich the potentiality of pharmacokinetics or quantitative study of the active metabolites in plasma.
Table 1. Optimized mass parameters for analytes and internal standard.
Table 2. Optimized source-dependent parameters.
Table 3. Intra- and inter-day precision and accuracy data for enalapril and enalaprilat in human plasma (n = 6).
Table 4. Absolute recovery of enalapril and enalaprilat from plasma (n = 6).
Table 5. Matrix effect of enalapril and enalaprilat calculated from six different source of human plasma.
Table 6. Stability of enalapril under different storage conditions (n = 6).
Table 7. Stability of enalaprilat under different storage conditions (n = 6).
Table 8. Pharmacokinetic parameters of healthy human volunteers with the test and reference preparation (n = 30).
A simple, selective, rapid, specific, highly sensitive and high-throughput tandem mass spectroscopic method has been developed and validated for simultaneous determination of enalapril (EPL) and its active metabolite enalaprilat (EPLT) in human plasma.
The LLOQ obtained indicates the high sensitivity of the described method of analysis, which is useful for pharmacokinetic or bioequivalence studies.
Sample extraction procedure was performed by a simple protein precipitation technique.
The results of matrix effect showed that ion suppression or enhancement from the plasma matrix components was abolished.
The stability studies have been carried out extensively and the results were deemed acceptable.
The method was applied to compare the bioavailability of two formulations of EPL by conducting the single oral dose, open label, randomized, two period, two sequence, crossover study of 30 healthy Indian male volunteers.
Ethical conduct of research
The authors state that they have obtained appropriate institutional review board approval or have followed the principles outlined in the Declaration of Helsinki for all human or animal experimental investigations. In addition, for investigations involving human subjects, informed consent has been obtained from the participants involved.
Acknowledgements
The authors acknowledge the support and the necessary instrumental facilities received from Bioequivalence Study Center, Jadavpur University, India. The authors sincerely acknowledge the editors and the referees for their constructive feedback for improving the quality and raising the clarity of the paper.
Financial & competing interests disclosure
The authors also acknowledges Pharmland JV Leninskaja STR, Nesviz Belarus for providing the necessary gift samples of enalapril maleate. The authors, D Halder and S Dan, are grateful to University Grants Commission (UGC), New Delhi, India for providing the fellowship. The authors have no other relevant affiliations or financial involvement with any organization or entity with a financial interest in or financial conflict with the subject matter or materials discussed in the manuscript apart from those disclosed.
No writing assistance was utilized in the production of this manuscript.
Additional information
Funding
References
- Desai D, Jain R, Pathak A, Ruikar DB, Rajput S. Determination of felodipine and enalapril in binary mixture using second derivative spectrophotometric, first derivative of the ratio-spectra UV methods and high-performance liquid chromatography method. Contemp. Investig. Obs. Pharm. 1, 31–39 (2012).
- Fishel M, U.S. National Library of Medicine. MedlinePlus: Enalapril (2010). www.nlm.nih.gov/medlineplus/druginfo/meds/a686022.html
- Law M, Wald N, Morris J. Lowering blood pressure to prevent myocardial infarction and stroke: a new preventive strategy. Health Technol. Assess. 7, 1–6 (2003).
- Rahman N, Haque SM. Optimized and validated spectrophotometric methods for the determination of enalapril maleate in commercial dosage forms. Anal. Chem. Insights 3, 31–43 (2008).
- Chaudhari BG. Development and validation of RP-HPLC method for simultaneous estimation of enalapril maleate and amlodipine besylate in combined dosage form. J. Appl. Pharm. Sci. 2, 54–57 (2012).
- Foda NH, Naeem O, ELbary AA, ELbary GA. Simultaneous HPLC determination of enalapril and hydrochlorothiazide in human plasma and its pharmacokinetic application. J. Pharm. Sci. Res. 2, 786–794 (2010).
- Yoon KH, Kim W, Park J, Kim HJ. Determination of enalapril in human plasma by high performance liquid chromatography-electrospray ionization mass spectrometry. Bull. Korean Chem. Soc. 25, 878–880 (2004).
- Loftsson T, Thorisdo´ttir S, Fridriksdo´ttir H, Stefa´nsson E. Enalaprilat and enalapril maleate eyedrops lower intraocular pressure in rabbits. Acta Ophthalmol. 88, 337–341 (2010).
- Makwana K, Dhamecha R, Pandya N. Bioanalytical method validation for the determination of enalapril in human serum by LC/MS/MS detection. Indian J. Res. 2, 296–298 (2013).
- Mohan M, Haider SJ, Anand AK, Srivastva AK. Validation of stability indicating HPLC method for the determination of enalapril maleate in p < t formulations. Int. J. Pharm. Pharm. Sci. 3, 180–183 (2011).
- Nagarajan G, Govardhan B, Ramana BV et al. Development and validation of a RP-HPLC method for simultaneous estimation of enalapril maleate and ramipril in bulk and p < t dosage form. Der Pharmacia Lettre 5, 69–76 (2013).
- Pawar PY, Joshi RS, Jangale KN, Wagh SK, Sandhan VP. Development and validation of a reversed phase HPLC method for simultaneous estimation of enalapril maleate, hydrochlorothiazide and paracetamol in pure and its pharmaceutical dosage form. Der Pharmacia Sinica 2, 121–127 (2011).
- Saeed MA, Naveed S, Sultana N. A validated reverse phase liquid chromatographic method for simultaneous analysis of enalapril maleate, hydrochlorothiazide and furosemide in active pharmaceutical ingredients, pharmaceutical dosage forms and human serum. Pharm. Anal. Acta 4, 1–5 (2013).
- Gu Q, Chen X, Zhong D, Wang Y. Simultaneous determination of enalapril and enalaprilat in human plasma by liquid chromatography-tandem mass spectrometry. J. Chromatogr. B 813, 337–342 (2004).
- Rao BV, Vidyadhara S, Tejaswi K, Rani AL. Analytical method development and validation for simultaneous estimation of Enalapril Maleate and hydrochlorothiazide by RP-HPLC. Der Pharma Chemica 6, 217–223 (2014).
- Spanakis M, Niopas I. GC-MS simultaneous determination of enalapril and enalaprilat in human plasma: application to a clinical pharmacokinetic study. Chromatography 72, 957–962 (2010).
- Wang P, Liang YZ, Chen BM et al. Simultaneous determination of enalapril and enalaprilat in human plasma by LC–MS: application to a bioequivalence study. Chromatography 65, 209–215 (2007).
- Ghosh C, Jain I, Shinde CP, Chakraborty BS. Rapid and sensitive liquid chromatography/tandem mass spectrometry method for simultaneous determination of enalapril and its major metabolite enalaprilat, in human plasma: Application to a bioequivalence study. Drug Test. Anal. 4, 94–103 (2012).
- Sultana N, Naveed S, Arayne MS. Direct determination of four ACE-inhibitors lisinopril, enalapril, captopril and fosinopril in pharmaceuticals and serum by HPLC. J. Chromat. Separation Techniq. 4, 1–5 (2013).
- Lee J, Son J, Lee M, Lee KT, Kim DH. Simultaneous quantitation of enalapril and enalaprilat in human plasma by 96-well solid-phase extraction and liquid chromatography/tandem mass spectrometry. Rapid Commun. Mass Spectrom. 17, 1157–1162 (2003).
- Tamboli AM, Khan NI, Bathe RS, Ansari AM. HPTLC method for simultaneous determination of amlodipine besylate and enalapril maleate in pharmaceutical formulation. Int. J. Biomed. Adv. Res. 5, 237–241 (2014).
- Kang CN, Kim HJ, Park YS et al. A Simple and rapid LC–MS/MS method for the determination of enalapril in human plasma for pharmacokinetic andbioequivalence studies in Korean healthy volunteers under fasting conditions. J. Anal. Chem. 69, 467–473 (2014).
- Pisarev VV, Moskaleva NE, Zverkov YB, Smirnova LB, Belolipetskaya VG, Sukhanov YV. HPLC/MS determination of enalapril and enalaprilat in the blood plasma. Pharm. Chem. J. 39, 104–107 (2005).
- Lu S, Jiang K, Qin F, Lu X, Li F. Simultaneous quantification of enalapril and enalaprilat in human plasma by high-performance liquid chromatography-tandem mass spectrometry and its application in a pharmacokinetic study. J. Pharm. Biomed. Anal. 49, 163–167(2009).
- Ramusovic S, Thielking G, Läer S. Determination of enalapril and enalaprilat in small human serum quantities for pediatric trials by HPLC-tandem mass spectrometry. Biomed. Chromatogr. 26, 697–702 (2012).
- Food and Drug Administration of the United States Guidance for industry – bioanalytical method validation. US Department of Health and Human Services, Center for Drug Evaluation and Research, Center for Veterinary Medicine. (2001). www.fda.gov/cder/guidance/index.html
- Halder D, Dan S, Biswas E, Sarkar P, Halder UC, Pal TK. A rapid LC-ESI-MS/MS method for the quantitation of salicylic acid, an active metabolite of acetylsalicylic acid: application to in vivo pharmacokinetic and bioequivalence study in Indian healthy male volunteers. Appl. Clin. Res. Clin. Trials Regul. Aff. 2, 90–102 (2015).
- Makwana K, Dhamecha R, Pandya N. Bioanalytical method validation for the determination of enalapril, enalaprilat and hydrochlorothiazide in human serum by LC/MS/MS detection. Pharma. Sci. Monit. 2, 110–121 (2011).
- Nandi U, Dan S, Pal TK. Development and validation of a liquid chromatography-mass spectrometry method for simultaneous determination of metoprolol and telmisartan in rat plasma and its application to pharmacokinetic study. J. Pharm. Investig. 45, 329–340 (2015).
- Sarkar AK, Ghosh D, Haldar D et al. Biopharmaceutical evaluation of active metabolite of fenofibrate and atorvastatin in human plasma by LC-ESI-MS/MS method. J. Pharm. Res. 5, 2347–2351 (2012).
- Sarkar AK, Ghosh D, Haldar D et al. A rapid LC-ESI-MS/MS method for the quantitation of choline, an active metabolite of citicoline: application to in vivo pharmacokinetic and bioequivalence study in Indian healthy male volunteers. J. Pharm. Biomed. Anal. 71, 144–147 (2012).
- European Medicines Agency. Guidance on bioanalytical method validation. (2012). www.ema.europa.eu/docs/en_GB/document_library
- Matuszewski BK, Constanzer ML, Chavez-Eng CM. Strategies for the assessment of matrix effect in quantitative bioanalytical methods based on HPLC–MS/MS. Anal. Chem. 75, 3019–3030 (2003).
- Ghosh C, Jain I, Shinde CP, Chakraborty BS. Ionization polarity as a cause of matrix effects, its removal and estimation in ESI-LC–MS/MS bio-analysis. J. Anal. Bioanal. Tech. 1, 1–7 (2010).
- Cheregia M, Albua F, Udrescua S, Raducanu N, Medvedovici A. Greener bioanalytical approach for LC/MS-MS assay of enalapril and enalaprilat in human plasma with total replacement of acetonitrile throughout all analytical stages. J. Chromatogr. B 927, 124–132 (2013).
- Remko M. Acidity, lipophilicity, solubility, absorption, and polar surface area of some ACE inhibitors. Chem. Pap. 61, 133–141 (2007).
- Jones J, Phipps K, Meadows K. Thermo Fisher Scientific (2012). www.thermoscientific.com/chromatography