
Abstract
Aim: We sought to determine the sensitivity of electrical impedance myography (EIM) to myofiber hypertrophy induced by treatment with various doses of ActRIIB-mFc, an inhibitor of myostatin signaling. Methods: Wild-type C57BL/6 J mice (n = 40, male) were treated with three different doses of ActRIIB-mFc (i.e., RAP-031) or vehicle twice weekly for 5 weeks. End point assessments included gastrocnemius EIM, force measurements, muscle mass and myofiber size quantification. Results: ActRIIB-mFc increased body mass, muscle mass and myofiber size across all doses. Alterations in EIM 50 kHz phase and center frequency (fc) were also present, with trends in a dose-dependent fashion. Significant correlations between EIM parameters and myofiber/functional data were identified. Conclusion: EIM outcomes can serve as effective biomarkers of myostatin signaling inhibition, demonstrating a dose sensitivity and correlation to standard assessments.
Lay abstract
We were interested in studying the sensitivity of a technique, called electrical impedance myography (EIM), to noninvasively assess the size of muscle fibers. In this technique a minute electrical current is used to probe the tissue. To do so, we gave a drug (ActRIIB-mFc) to mice that enlarges muscle fibers at three different doses. We were able to show that the EIM technique was able to detect this differential effect and functional changes induced by the drug correlated to the EIM data. This work suggests that EIM will be useful as a noninvasive marker muscle health.
Better biomarkers to assess drug effect in neuromuscular disease clinical trials are needed. Although standard clinical outcome measures, such as functional testing, handheld dynamometry [Citation1] and the 6-min walk test [Citation2], are valuable, they also have a variety of drawbacks. These include most importantly requiring the cooperation and understanding of the patient undergoing testing and a skilled physical therapist or evaluator performing the measurements. Yet, these outcomes can still be affected by the emotional state of the patient and can be fatiguing and time consuming to perform. The use of such measures often translates into large sample size requirements and long study periods in order to identify treatment effects for many of these disorders [Citation3].
For this reason, there has been a strong effort to establish pharmacodynamic biomarkers for the assessment of neuromuscular disease; that is, markers that are sensitive to drug efficacy. Electrical impedance myography (EIM) is an impedance-based technique that has been receiving increasing attention as a tool that could serve such a role in clinical trials [Citation4]. Multiple studies have demonstrated its sensitivity to disease progression, including in amyotrophic lateral sclerosis [Citation5], Duchenne muscular dystrophy [Citation6], spinal muscular atrophy [Citation7] and even potentially in sarcopenia [Citation8,Citation9]. However, there has been relatively little work to date assessing its potential sensitivity to drug effect and there has been no study to our knowledge assessing its ability to detect a dose–response relationship.
In this study, we sought to assess that final point by performing a basic assessment of EIM's sensitivity to dose by measuring a group of wild-type mice treated with three different doses of ActRIIB-mFc, and its relationship to myofiber size and function. ActRIIB-mFc (also termed RAP-031, Acceleron Pharma, MA, USA) is a protein comprised of a form of the extracellular domain of ActRIIB fused to a mouse Fc that acts as a ligand trap to inhibit myostatin signaling [Citation10,Citation11]. Previously, only one other study evaluated EIM's response to ActRIIB-mFc, and that was only at a single full dose [Citation12]. Administration of either ActRIIB-mFc or ActRIIB-hFc has been shown to result in a substantial muscle mass increase in normal mice [Citation11–18], and thus in this study we sought to evaluate EIM's sensitivity to dose, helping to further establish its potential value as biomarker of muscle status.
Materials & methods
Animals
All animal procedures were carried out in strict accordance with the recommendations in the Guide for the Care and Use of Laboratory Animals of the NIH and approved by the Institutional Animal Care and Use Committee at Beth Israel Deaconess Medical Center (Protocol #087–2016). Forty male wild-type mice (C57BL6J, 8 weeks of age) were obtained from the Jackson Laboratories (ME, USA). Mice were given ad libitum access to food (Formulab Diet 5008, LabDiet, MO, USA) and water. Animals were allowed to acclimate at least 72 h prior to testing. At the conclusion of all studies, the animals were euthanized with carbon dioxide.
Treatment with the myostatin ligand trap ActRIIB-mFc
Starting at 9 weeks of age, mice were divided randomly into four groups of 10 mice per group. Mice were treated twice weekly for 5 weeks with subcutaneous (sc.) injections of either phosphate-buffered saline (PBS) or ActRIIB-mFc at doses of 3.3, 6.6 or 9.9 mg/kg. These doses were based on previous literature [Citation10–12]. Animals were weighed weekly with an analytical balance to ensure correct dosing throughout the course of the study. All subsequent procedures, described below, were performed after 5 weeks of treatment with ActRIIB-mFc.
Grip strength assessment
Fore limb and hind limb grip strength were measured by a grip strength meter with standard pull bar (CAT #1027CSM, Columbus Instruments, OH, USA). The mouse was first allowed to grip the pull bar and then the investigator, grasping the lower back of the animal, pulled the animal away from the bar until it lost its grip. The maximum force out of five trials was recorded. This test was performed separately on the fore and hind limbs.
Animal preparation for EIM & in situ force measurements
EIM and in situ force experiments were performed under 1–2% inhaled isoflurane anesthesia delivered by nose cone with body and muscle temperature being maintained by a heating pad (37 °C). Both hind limbs were taped to the measuring surface at an approximately 45° angle extending out from the body in preparation for measurements.
Electrical impedance myography
After shaving the left hind limb, a depilatory agent was then applied to remove residual fur, and the skin was cleaned with 0.9% saline solution. A fixed rigid four-electrode impedance-measuring array was applied over the left gastrocnemius muscle. EIM measurements were performed with the mView EIM System (Myolex, Inc., CA, USA), obtaining impedance data at 41 frequencies from 1 kHz to 10 MHz as previously described [Citation19]. The device was connected to the electrode array via a ‘cradle’ adapter available from the company. The two major outcomes of interest in this study were the 50 kHz phase, extracted from the multifrequency data and the ‘center frequency’ (fc), a multifrequency measure thought to represent the relative size of cells [Citation20].
In situ muscle force measurements
In situ muscle force measurements were performed, as previously described [Citation12]. Briefly, a nonsurvival surgery was performed to expose the left gastrocnemius muscle and calcaneal tendon, the latter of which was cut and attached via silk suture to the force lever arm and the leg stabilized by inserting a disposable monopolar needle (902-DMF37-S, Natus Neurology, WI, USA) through the knee joint. Twitch and tetanic force were recorded following stimulation of the sciatic nerve with 200 ms square pulses via insulated monopolar needles (F-E2M-48, Grass Technologies, RI, USA). A high-speed servo motor-based apparatus (Model 305C, Aurora Scientific, ON, Canada) was used to measure force output. Stimulation current and resting tension were adjusted to maximize twitch force produced by a single stimulus pulse. All subsequent isometric tetanic force data were collected at this stimulation current and resting tension. Isometric force frequency relationship was recorded after stimulation by a train of square wave stimuli and maximum isometric tetanic force was recorded. Animals were then euthanized.
Muscle histology
After euthanasia, the left gastrocnemius was harvested and the wet mass of the excised muscle was determined using a standard analytical balance. Normalized muscle mass was calculated by taking this wet muscle mass and dividing by the mass of the mouse prior to muscle excision. Muscle tissue was placed in 10% buffered formalin and fixed for at least 48 h. Samples were then embedded in paraffin blocks, sectioned into 10 mm slices and stained with anticollagen VI antibody (Abcam ab6588). Sections were subsequently imaged at 20× with a Zeiss Axio Imager M1 epifluorescence microscope and fiber area was measured using Volocity® software (PerkinElmer, Akron, OH, USA).
Data analysis
The EIM resistance (R) and reactance (X) were extracted at 50 kHz and phase (θ) was calculated via the equation θ = arctan (X/R). Multifrequency resistance and reactance data were then used to extract the Cole parameters, a series of parameters that offer potential information on tissue histology: these include α (a measure of cell size variation), R0/Rinf (a measure of cell density) and fc (a myofiber size) [Citation12,Citation20,Citation21]. Statistical analysis on the physiological data, the raw impedance values and the Cole parameters was then performed using GraphPad Prism (GraphPad Software, Inc., CA, USA). All mass, grip strength, force and 50 kHz EIM data are reported as mean ± standard error of the mean. Multiple group comparisons were performed by ordinary one-way analysis of variance (ANOVA) with post-hoc t-tests using Tukey's multiple comparisons test. For correlation analyses, the Pearson correlation coefficient was calculated. Findings were considered significant with p < 0.05, two tailed.
Results
Basic data
shows the most interesting standard outcomes after 5 weeks of treatment on the standard metrics of body mass, muscle mass, fore limb grip strength, mean fiber area, maximum tetanic force and maximum twitch force. The complete dataset and associated statistics are also provided in . Trends are apparent in almost all parameters with increasing/improving parameters paralleling increasing ActRIIB-mFc dose. Significant ANOVA were observed with body mass, muscle mass, fore limb grip strength, mean fiber area and maximum twitch force with post-hoc tests confirming a difference only with PBS compared with each of the doses (and not between the different doses). This finding suggests that our choice of dosing may have been less than ideal, since there appeared to be, in general, relatively minor difference between effects of 3.3, 6.6 and 9.9 mg/kg.
Figure 1. Summary of basic physiological parameters and force data across all three doses of ActRIIB-mFc.
(A) Body mass; (B) muscle mass; (C) fore limb grip strength; (D) mean fiber area; (E) gastrocnemius in situ tetanic force; (F) gastrocnemius in situ twitch force.
†p < 0.05; ‡p < 0.01; §p < 0.001; ¶p < 0.0001.
Post-hoc p-values are reported for the comparison between each individual ActRIIB-mFc dose versus the phosphate-buffered saline control. Post-hoc p-values for the comparison between the various ActRIIB-mFc doses were not significant.
ns: Not significant.
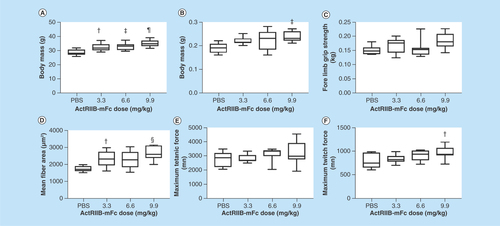
Table 1. Body mass, muscle mass, grip strength, muscle force and myofiber size.
EIM & Cole parameters
Both the EIM transverse 50 kHz phase and the Cole fc parameter were highly significantly different in all three ActRIIB-mFc-treated groups as compared with the animals treated with PBS ( & ); the data in the longitudinal direction were not significantly different from that found in PBS-treated animals for mice treated with any of the ActRIIB-mFc doses.
Figure 2. Longitudinal and transverse electrical impedance myography and Cole parameters for the left gastrocnemius muscle.
(A) Longitudinal 50 kHz phase; (B) longitudinal fc; (C) transverse 50 kHz phase; (D) transverse fc.
†p < 0.05; ‡p < 0.01.
Post-hoc p-values are reported for the comparison between each individual ActRIIB-mFc dose versus the phosphate-buffered saline control. Post-hoc p-values for the comparison between the various ActRIIB-mFc doses were not significant.
fc: center frequency; ns: Not significant.
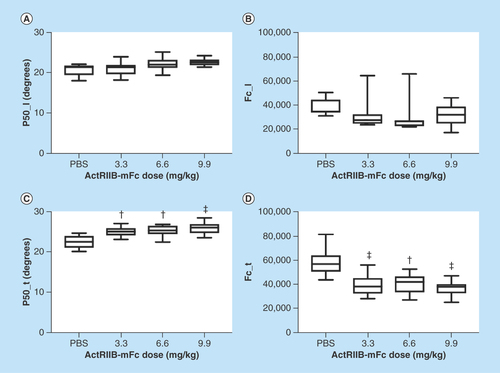
Table 2. Longitudinal and transverse 50 kHz electrical impedance myography and Cole parameters of the left gastrocnemius.
Correlation to myofiber size & impedance parameters
shows the correlation between two impedance parameters (i.e., p50_t and fc_t) with muscle mass, myofiber size and maximum twitch force across all the animals at all doses demonstrating significant relationships across all groups, except for the p50_t versus twitch force. The full dataset is provided in .
Figure 3. Correlations between transverse electrical impedance myography and Cole parameters, and muscle mass, mean fiber area and maximum twitch force.
(A) Transverse 50 kHz phase versus muscle mass; (B) transverse 50 kHz phase versus mean fiber area; (C) transverse 50 kHz phase versus maximum twitch force; (D) transverse fc versus muscle mass; (E) transverse fc versus mean fiber area; (F) transverse fc versus maximum twitch force.
fc: Center frequency.

Table 3. Correlations between 50 kHz electrical impedance myography parameters, grip strength, muscle mass, twitch force, tetanic force & mean cross-sectional area.
Discussion
Taken together, these results confirm the capability of EIM to detect a relationship to myofiber size and other outcomes with varying doses of ActRIIB-mFc, a potent inducer of myofiber hypertrophy. The greatest limitation of our study design was our choice of doses to test; whereas we anticipated a linear impact on myofiber size with escalating dose, in fact, no significant difference could be identified for any outcome assessment across the three doses, except for animal body mass and mean fiber area. Nevertheless, the trends across the three doses were apparent on histology, functional measures and the EIM data itself.
Other studies evaluating EIM's sensitivity to actual drug effect have been limited. There has been one previous study evaluating EIM previously detecting the impact of myostatin inhibition of ActRIIB-mFc (also termed RAP-031) [Citation12]. But this study looked at relatively few animals, performed measurements in only a single direction (longitudinal), and studied only one dose. In addition, one human study identified the impact of corticosteroids on EIM in patients with Duchenne muscular dystrophy [Citation6]. Perhaps the closest study that attempted to show a differential effect of medication on the EIM parameters was in spinal muscular atrophy mice, in which mice with a severe form of the disease (the SMNΔ7 mouse) were treated with identical doses of antisense oligonucleotides at different ages shortly after birth [Citation22]; animals that were treated later had a more severe phenotype; those treated earlier had a milder phenotype. EIM was able to detect these differences.
In this study, we were mainly interested in a relatively restricted set of impedance parameters, namely the 50 kHz phase values and the Cole-modeled impedance parameter, fc, obtained both in the longitudinal and transverse directions. The main reason for not focusing on the raw 50 kHz resistance and reactance values in this situation is that the changes in these values more likely reflect changes in muscle mass rather than changes due to the inherent structure of the myofibers themselves. While there are several Cole parameters, fc is most closely tied to myofiber size and thus we anticipated the greatest changes in this one parameter.
The difference in transverse versus longitudinal data is also of interest. In transverse measurements, the electrical current is passed perpendicular to the fiber direction (i.e., current is passed in the medial–lateral direction and the voltage measured in that same direction); in longitudinal measurements, the current is passed parallel to the myofibers (i.e., proximal to distal). In the transverse direction, current is forced across myofibers and would thus be more likely to detect changes in their size than might be the case in the longitudinal direction; longitudinal changes would be anticipated in being more sensitive to changes in the interstitium.
There are several limitations to this study that need to be highlighted. The first, as already stated, was that the doses of ActRIIB-mFc we chose were too similar, all three inducing similar degrees of change in muscle fiber size. Perhaps, if we had still larger sample sizes, we may have been able to detect a significance difference between these doses, as trends do appear. Nevertheless, it would have been preferable to use a different and perhaps wider range of doses (e.g., 1, 2 and 5 mg/kg and possibly doses >10 mg/kg). Of note, a previous dose–response study indicated that the maximal efficacy on lean tissue mass was observed with the bi-weekly administration of ActRIIB-mFc at a dose 10 mg/kg in mice [Citation17]. In addition, in this study we only evaluated wild-type animals, since our main goal was simply in demonstrating EIM's potential applicability as a biomarker of drug effect. A similar study in a disease in which we anticipate drug efficacy would be an important next step to pursue. Nevertheless, by studying the effect in wild-type animals, we provide the ‘cleanest’ example of EIM's potential capability of detecting a differential drug effect. A final more minor limitation is that we used formalin fixation in lieu of frozen, which may produce some degree of shrinkage in the tissue. However, such shrinkage is likely minor and would have affected all specimens similarly and thus not impact the overall results of the study. In addition, our untreated mouse myofiber size was well within the expected range for adult mice.
Conclusion
The value of this study is that it demonstrates EIM's capability to offer data that are well correlated to standard measures that are more challenging to obtain. We show here that EIM parameters of 50 kHz phase and the fc show a moderate correlation to multiple features of the drug treatment, including the myofiber cross-sectional area, muscle mass and twitch/isometric force. Thus, it is conceivable that this technology may ultimately be able to serve as a biomarker or potentially as a surrogate outcome in future clinical trials. Given its ease of use, both in animals and in humans, it could serve as a simple measure of drug effect that provides direct correlation to histological and force-generating aspects of the muscle, without the need for invasive biopsy or extended functional measurements.
Future perspective
We anticipate the broader neuromuscular disease field will gradually incorporate additional tools such as EIM to evaluate muscle condition in a variety of diseases rather than some of the standard functional outcome measures currently in use. The initial purpose will be to help speed clinical trials and therapeutic testing in general. In addition, it is likely that such approaches will begin to reach mainstream clinical care, especially as some of these tools can be used at home to provide a more detailed picture of therapeutic trends over time.
ActRIIB-mFc, a potent inducer of myofiber hypertrophy, increased body mass, muscle mass and myofiber size across all doses tested.
Dose-dependent trends were observed in two electrical impedance myography (EIM) parameters: the 50 kHz phase and fc, the center frequency.
Significant correlations were identified between EIM parameters and myofiber cross-sectional area.
Significant correlations were identified between EIM parameters and muscle mass.
Significant correlations were identified between EIM parameters and functional measures.
EIM outcomes can serve as effective biomarkers of myofiber hypertrophy.
EIM obviates the need for invasive biopsy or extended functional measurements and can function as a pharmacodynamic biomarker for the assessment of drug efficacy in neuromuscular disease.
Authors’ contributions
JA Nagy performed experiments, analysis, assisted with manuscript preparation; K Kapur assisted with statistical analysis and manuscript preparation; RS Taylor performed experiments, analysis, assisted with manuscript preparation; B Sanchez performed analysis and assisted with manuscript preparation; and SB Rutkove conceived of study, experiments, analysis and assisted with manuscript preparation.
Ethical conduct of research
This study was carried out in strict accordance with the recommendations in the Guide for the Care and Use of Laboratory Animals of the NIH and was approved by the Beth Israel Deaconess Medical Center Institutional Animal Care and Use Committee (IACUC). All efforts were made to minimize any animal suffering.
Acknowledgements
The authors thank Acceleron Pharma, Inc. (MA, USA) for providing the ligand trap ActRIIb-mFc (also termed RAP-031) used in this study.
Financial & competing interests disclosure
Funding for this study was provided via NIH grants R01 NS091159. S B Rutkove has equity in, and serves a consultant and scientific advisor to, Myolex, Inc., a company that designs impedance devices for clinical and research use; he is also a member of the company's Board of Directors. The company also has an option to license patented impedance technology of which S B Rutkove is named as an inventor. The authors have no other relevant affiliations or financial involvement with any organization or entity with a financial interest in or financial conflict with the subject matter or materials discussed in the manuscript apart from those disclosed.
No writing assistance was utilized in the production of this manuscript.
Additional information
Funding
References
- Goonetilleke A, Modarres-Sadeghi H, Guiloff RJ. Accuracy, reproducibility, and variability of hand-held dynamometry in motor neuron disease. J. Neurol. Neurosurg. Psychiatry 57(3), 326–332 (1994).
- McDonald CM, Henricson EK, Han JJ et al. The 6-min walk test as a new outcome measure in Duchenne muscular dystrophy. Muscle Nerve 41(4), 500–510 (2010).
- Scotton C, Passarelli C, Neri M, Ferlini A. Biomarkers in rare neuromuscular diseases. Exp. Cell Res. 325(1), 44–49 (2014).
- Sanchez B, Rutkove SB. Present uses future applications, and technical underpinnings of electrical impedance myography. Curr. Neurol. Neurosci. Rep. 17(11), 86 (2017).
- Rutkove SB, Caress JB, Cartwright MS et al. Electrical impedance myography as a biomarker to assess ALS progression. Amyotroph. Lateral Scler. 13, 439–445 (2012).
- Rutkove SB, Kapur K, Zaidman CM et al. Electrical impedance myography for assessment of Duchenne muscular dystrophy. Ann. Neurol. 81(5), 622–632 (2017).
- Rutkove SB, Gregas MC, Darras BT. Electrical impedance myography in spinal muscular atrophy: a longitudinal study. Muscle Nerve 45(5), 642–647 (2012).
- Kortman HG, Wilder SC, Geisbush TR, Narayanaswami P, Rutkove SB. Age- and gender-associated differences in electrical impedance values of skeletal muscle. Physiol. Meas. 34(12), 1611–1622 (2013).
- Aaron R, Esper GJ, Shiffman CA, Bradonjic K, Lee KS, Rutkove SB. Effects of age on muscle as measured by electrical impedance myography. Physiol. Meas. 27(10), 953–959 (2006).
- Carlson CG, Bruemmer K, Sesti J et al. Soluble activin receptor type IIB increases forward pulling tension in the mdx mouse. Muscle Nerve 43(5), 694–699 (2011).
- Morrison BM, Lachey JL, Warsing LC et al. A soluble activin type IIB receptor improves function in a mouse model of amyotrophic lateral sclerosis. Exp. Neurol. 217(2), 258–268 (2009).
- Sanchez B, Li J, Yim S, Pacheck A, Widrick JJ, Rutkove SB. Evaluation of electrical impedance as a biomarker of myostatin inhibition in wild type and muscular dystrophy mice. PLoS ONE 10(10), e0140521 (2015).
- Cadena SM, Tomkinson KN, Monnell TE et al. Administration of a soluble activin type IIB receptor promotes skeletal muscle growth independent of fiber type. J. Appl. Physiol. 109(3), 635–642 (2010).
- Tinklenberg J, Meng H, Yang L et al. Treatment with ActRIIB-mFc produces myofiber growth and improves lifespan in the Acta1 H40Y murine model of nemaline myopathy. Am. J. Pathol. 186(6), 1568–1581 (2016).
- Lawlor MW, Read BP, Edelstein R et al. Inhibition of activin receptor type IIB increases strength and lifespan in myotubularin-deficient mice. Am. J. Pathol. 178(2), 784–793 (2011).
- Lawlor MW, Viola MG, Meng H et al. Differential muscle hypertrophy is associated with satellite cell numbers and Akt pathway activation following activin type IIB receptor inhibition in Mtm1 p.R69C mice. Am. J. Pathol. 184(6), 1831–1842 (2014).
- Koncarevic A, Cornwall-Brady M, Pullen A et al. A soluble activin receptor type IIB prevents the effects of androgen deprivation on body composition and bone health. Endocrinology 151(9), 4289–4300 (2010).
- Koncarevic A, Kajimura S, Cornwall-Brady M et al. A novel therapeutic approach to treating obesity through modulation of TGFβ signaling. Endocrinology 153(7), 3133–3146 (2012).
- Li J, Staats WL, Spieker A, Sung M, Rutkove SB. A technique for performing electrical impedance myography in the mouse hind limb: data in normal and ALS SOD1 G93A animals. PLoS ONE 7(9), e45004 (2012).
- Grimnes S, Martinsen OG. Bioimpedance and Bioelectricity Basics (3rd Edition). Academic Press, MA, USA (2014).
- Li J, Pacheck A, Sanchez B, Rutkove SB. Single and modeled multifrequency electrical impedance myography parameters and their relationship to force production in the ALS SOD1G93A mouse. Amyotroph. Lateral Scler. Frontotemporal Degener. 8421, 1–7 (2016).
- Arnold WD, McGovern VL, Sanchez B et al. The neuromuscular impact of symptomatic SMN restoration in a mouse model of spinal muscular atrophy. Neurobiol. Dis. 87, 116–123 (2016).