
Abstract
Aim: This guide aims to broaden the uptake of MALDI-MSI biomedical research by removing the initial ‘lag phase’ associated with empirical determination in sample preparation and data analysis. Methods: Samples from several tissue types were prepared for lipid, protein and peptide MSI analysis. Broadly, samples were cryo sectioned, mounted onto conductive MALDI slides and sublimed with an analyte specific matrix, recrystallised and analyzed in a Bruker UltrafleXtreme MALDI TOF/TOF. Results/conclusion: Here we present a general guide that serves as the first comprehensive, explanatory index for curation and verification of both sample preparation and data generation during the MALDI-MSI process.
Lay abstract
The field of mass spectrometry tissue imaging is a complex field that is designed to provide a map of the molecules on the surface of tissue sections. It often requires a significant investment of time and resources before useful data can be generated; therefore, this paper provides a visual troubleshooting guide that will act as a reference point for a range of sample preparation mistakes and explanations for unusual or suboptimal data. Elimination of the lag phase associated with the development of new techniques will help to expedite the growth and application of this technology.
Matrix-assisted laser desorption/ionization-mass spectrometry imaging (MALDI-MSI or MSI) is a technique that has been established for a number of years with demonstrated application to a range of biological molecules from proteins [Citation1], peptides [Citation2], lipids [Citation3] and N-glycans [Citation4], to synthetic molecules such as drugs [Citation5]. The data generated from MSI takes the form of a spatial map that shows the relative intensity and location of a given molecular mass across the surface of predefined space, usually a tissue section [Citation6] but also in bacterial colonies [Citation6], plant structures [Citation7–9] and fingerprints [Citation10,Citation11] to name a few. The untargeted nature of MSI makes discovery-driven experimentation an attractive application [Citation12]; however, for the most part, MSI is used to look for biomarkers [Citation13,Citation14]. In simple terms, MSI can tell the user the range of molecular species that exist within a sample and their relative abundance across that sample [Citation15]. However, our own investigations into MSI-based workflows and the standardization of methodologies have led us to conclude that validation in MSI and the introduction of controls is necessary if MSI is to become more widely utilized in biomedical research and as a standard diagnostic procedure [Citation16].
The idea of visualizing the physical location of a biomarker within a tissue section is not a new concept, and it is a routine procedure in histopathological staining and immunohistochemistry (IHC) [Citation17]; although largely limited to proteins and peptides, with different lipid classes often being detected together [Citation18]. The IHC is a technique that is dependent on the specific interactions of individual antibodies and the marker of interest [Citation19]. The inherent reliability of IHC is always internally validated by providing a negative and positive control sample alongside the treated sample, in other words, serial sections are required and subjected to the same preparation process, except only one is treated with the antibody [Citation20], and subsequent staining techniques [Citation21]. These paired samples can then be visualized alongside each other via light or fluorescence microscopy and directly compared [Citation22]. These controls mean that errors inherent to sample preparation are not misinterpreted as features of biological significance.
Unlike IHC, there are no such controls in MSI [Citation16] due to the ‘one hit’ nature of the analytical process; it is not possible to have ‘treated’ and ‘untreated’ replicates in an MSI experiment because in order to generate ions for the mass spectrometer to detect, all samples must be put through the same preparation procedures. That is, the generation of tryptic peptides (except in the case of intact protein or lipid maps) followed by the coating with matrix and ensuring that the analyte and matrix mix together and cocrystallize without delocalization [Citation23]. Each step is explicitly necessary, but all have the potential to impact the location of the targeted molecules. For example, a phenomena that can occur with MSI samples is where severely delocalized samples can generate high intensity spectra with high resolution peaks. In other words, areas of delocalized and aggregated sample and analyte can be easily mistaken for biologically relevant features because the mass spectrometric data are of a high quality.
More generally, it is necessary to exercise quality control over all stages of sample preparation by visually identifying when a preparation step has been performed incorrectly. Otherwise, it is entirely possible to prepare samples over an extensive, 3-day process that results in very poor images with no indication as to why. It is for these reasons that MSI based research is often performed empirically; a time-consuming process that often discourages novel development and application in favor of pre-established pipelines [Citation15] and automated sample preparation for ‘common’ sample types; a subject that is covered in depth in the review by Chughtai and Heeren (2010) [Citation24].
In 2015, we published our initial work on reproducibility in MSI [Citation1]. The data was produced exclusively through empirical determination allowing us to characterize and define the ideal conditions necessary for reproducible and robust images. A unique benefit of this process was the creation and curation of a library of visual and spectral data that corresponded with changes and variations in the way in which the samples were prepared. Concurrently, we gained extensive understanding of the mechanisms controlling effective sample preparation and the generation of robust data.
This manuscript serves as a review of all the methodological avenues that we have explored in an extensive period of development in MSI for the most commonly analyzed sample types utilizing sublimation as the primary preparation method. Our motivation for this manuscript is to provide a quick reference for other research teams that intend on performing their own MSI-based research and to begin to introduce standardization into data interpretation.
For each of the different evaluations, all samples were prepared using the same general workflow (see evaluated methods). We have reported method variations alongside the applicable figure in the results section.
Evaluated methods
The methodologies we chose to evaluate were centered on the most common forms of tissues that are used at the time of writing. A range of animal tissues including formalin-fixed frozen (FFF), formalin-fixed paraffin-embedded (FFPE) and fresh frozen (FF), and some human samples were donated from various locations with relevant ethics approvals. Preparation was varied according to the unique requirements of each tissue type and the intended molecule chosen for analyses:
Fresh frozen proteins
The MSI of intact proteins needs to be performed on fresh frozen tissue since formalin fixation indiscriminately crosslinks proteins to each other, preventing their ionisation in MALDI [Citation25]. Intact protein MSI generally has less utility than other forms of analysis due to the relatively low mass resolution of TOF/TOF style instruments in linear mode. However, new generation instrumentation solves this issue, enabling high mass accuracy protein MSI [Citation26]. Our broad sample preparations involved the following steps: fresh tissue was washed in PBS to remove blood and cell debris, frozen in isopentane, cooled with dry ice, sectioned at 12 μm and mounted onto nitrocellulose-coated indium tin oxide microscope slides [Citation1]. Once mounted, the sections were washed in an organic solvent series [Citation27] to remove contaminants, sublimated with sinapinic acid matrix and recrystallized for 1 h at 37°C with organic solvent [Citation1].
Formalin-fixed paraffin-embedded peptides
The FFPE tissue is by far the most ubiquitous sample when performing imaging [Citation5,Citation23,Citation28–30]. The vast collections of archival tissue of rare pathologies that exist around the world make this type of analysis a particular priority. However, with formaldehyde comes a series of difficulties in analysis and sample preparation. While in addition, the embedding process makes it only possible to reliably image peptides. We have covered these issues comprehensively in a recent review [Citation25].
Our investigation of methods of peptide analysis were performed in the following way: FFPE tissue was sectioned at 5 μm, water float-mounted to specially prepared nitrocellulose coated ITO glass slides, deparaffinized with fresh xylene and then washed in a graded alcohol series to remove any residual contaminants [Citation2]. Methylene hydrolysis was then performed at 120°C under pressure, in 20 mmol Tris-HCl (pH 8.8) to remove formaldehyde cross-links, and the sample was then coated with 1 mg/ml trypsin and digested O/N at 37°C. The digested samples were then sublimated with α-cyano-4-hydroxycinnamic acid (CHCA) matrix to a final coverage of 0.2 mg/cm2 and then recrystallized for 1 h at 37°C with 50:50 acetonitrile with 0.1% (v:v) trifluoroacetic acid (ACN 0.1% TFA). This method is extensively explained in our earlier publication [Citation2].
Formalin-fixed frozen peptides & lipids
The FFF samples have similar caveats to that of FFPE; however, without embedding it is possible to image lipids as well as peptides [Citation31]. Our method of analysis was: FFF samples were prepared in the same way as FFPE; however, sectioning was performed on a cryomicrotome at 12 μm. The six-stage washing procedure for FFPE samples was performed to remove any lipid contaminants or residual salts followed by methylene hydrolysis, tryptic digestion, CHCA matrix deposition and recystallization as described above.
For lipid analyses, the digestion and wash steps were not performed and the freshly mounted sample was instead coasted with matrix and recrystallized prior to analyses in the mass spectrometer.
General matrix coating conditions
All samples were coated with the appropriate matrix for the analyte of choice: typically 2,5-dihydroxybenzoic acid (DHB), CHCA and sinapinic acid for lipids, peptides and proteins respectively. The sample coatings were all performed via sublimation as described previously [Citation1,Citation32] with the optimal coating thickness of approximately 0.2 mg/cm2 achieved through pre and postsublimation weighing. Recystallization was then performed in a humid vapor chamber at 37°C for 1 h with ‘recrystallization solvent’ consisting of a 50:50 v/v mix of 0.1% TFA in water and 100% acetonitrile. Variations to these conditions are explained further in the results/discussion section.
Instrumentation
The majority of samples were imaged with a 5800 MALDI TOF/TOF (Sciex, MA, USA); however, we provide a comparison sample that was imaged with the UltrafleXtreme (Bruker Daltonics, Bremen, Germany). The 5800 uses a 355 nm Nd:YAG laser, and analyses were performed via the TOF/TOF Imaging software suite (Sciex) in either linear mode (intact proteins at a mass range of 3000–20,000 m/z) or reflectron TOF mode (peptides within the mass range of 750–1500 m/z) with the following settings: laser power at 5100, digitizer vertical scale set to 0.05 and bandwidth at 20 MHz. Lateral resolution was set to 60 μm and laser shots were set to 200 per spot. The instrument currently has a laser diameter of 100 μm which results in a 40% oversample.
Some of the presented data was obtained using a Bruker UltrafleXtreme equipped with a Nd YAG hybrid Smartbeam 2 laser and used in reflector positive mode with a mass range of 750–1100 m/z for lipids and 650–3000 m/z for peptides with the following settings: detector gain at 60X, digitizer at 2.50. Laser beam diameter set to ‘small’, and frequency at 1000 Hz with 1000 laser shots per spot. Images were all generated at a lateral resolution of 50 μm.
Finally, the datasets were analyzed in either the Tissue View software platform (Sciex) or SCiLS lab 2014b (Scils, Germany). No baseline correction or peak normalization was used in Tissue View or Scils lab. Images were generated from the raw spectral data.
To make this guide instrument neutral (or as neutral as possible), we focused on visual analysis of raw data. Postprocessing can be applied if required; however, in our own experience, it can mask some artefacts and errors that would otherwise indicate that samples were not prepared correctly and can lead to erroneous results.
Results
The aim of this work is to report the different methodological avenues that we investigated for performing a nondelocalizing sample preparation methodology that concurrently enables the highest ionization efficiency of the targeted molecules [Citation1,Citation2]. To effectively evaluate each sample preparation method, images were generated in order to observe the effect of changing each condition. The following images were generated using a range of different physical and chemical conditions, which are all described below. Further analyses were also performed utilizing a different instrumentation platform and different analyte targets to see if protocols were instrument or sample specific; however, these same effects were observed irrespective of the instrument used or analyte of interest.
The figure at the end of this section () is a positive control that was correctly prepared and processed taking all due care to avoid delocalization and ensuring that no artefacts were introduced. Further figures can be found in the Supplemental Data.
Figure 1. Mouse lymph node: correctly prepared.
Green outlines indicate the borders of actual tissue sections relative to their position on the slide. Blue boxes show the area that was actually imaged.
Human spinal cord
Sample type: FFPE human spinal cord ().
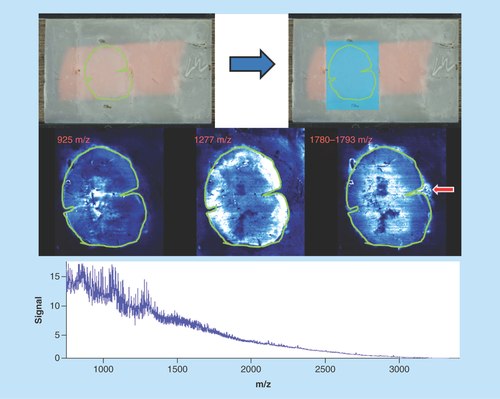
Figure 2. Human spinal cord.
Green outlines indicate the borders of actual tissue sections relative to their position on the slide. Blue boxes show the area that was actually imaged.
Target analyte: Peptides.
Preparation method: Deparaffinized, methylene cross-links hydrolyzed, CHCA matrix sublimated at 0.22 mg/cm2, and recrystallization performed with 500 μl of recrystallization solvent.
Slide appearance: Samples appear to be uniformly coated with matrix with no signs of delocalization or aggregation of matrix. Sample is strongly adhered to the surface of the slide and shows no signs of flaking or peeling.
Image quality: Images show good differential display, however, some delocalization has occurred. There are also analytes in image 1780–1793 (red arrow) that have moved off the tissue and aggregated on the slide.
Spectral quality: The global spectrum is relatively poor with low signal to noise ratio for many individual peaks as well as very large peak widths for the selectable masses, in other words, the image 1780–1793 is a composite of all data within that mass range.
Concluding remarks: Delocalization of this sample has occurred at the digestion stage. The likely cause of this is excessive solvent in the sealed vapor chamber during the overnight sample digestion. This effect is not visible on the sample slide as the matrix coating and recrystallization were performed correctly.
Despite the generation of several apparently clear images, the low abundance of peptides in the global spectrum and wide peaks indicate that not enough solvent was used in the vapor chamber during matrix recrystallization, thereby affecting ionization efficiency.
Lamb liver
Sample type: Fresh frozen lamb’s liver ().
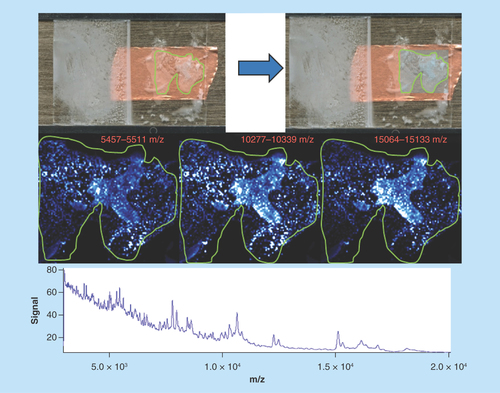
Figure 3. Lamb liver.
Green outlines indicate the borders of actual tissue sections relative to their position on the slide. Blue boxes show the area that was actually imaged.
Target analyte: Protein.
Preparation method: Sublimated with sinapinic acid at 0.22 mg/cm2 and crystallized with 250 μl of solvent for 5 min at 85°C.
Slide appearance: There is a significant amount of delocalized matrix, creating a ‘washed’ appearance.
Image quality: The individual images are decidedly similar, irrespective of the molecular species being viewed. All spatial information has been lost due to matrix and analyte delocalization.
Spectral quality: Spectral quality is noisy but distinct peaks can be seen across the mass range allowing easy selection for display. Peaks are, however, also very wide-making definitive mass accuracy difficult.
Concluding remarks: This sample has been heavily delocalized during the matrix recrystallization stage. The use of an 85°C oven for recrystallization caused the solvent to volatilize very quickly, which has resulted in the formation of large solvent droplets on the tissue surface. As this has dried, the matrix and any solubilized analyte has aggregated to specific areas of the tissue causing small areas of high signal intensity and thereby destroying all spatial information. This aggregative effect has also concentrated available analytes producing the clear, but biologically irrelevant, protein spectra.
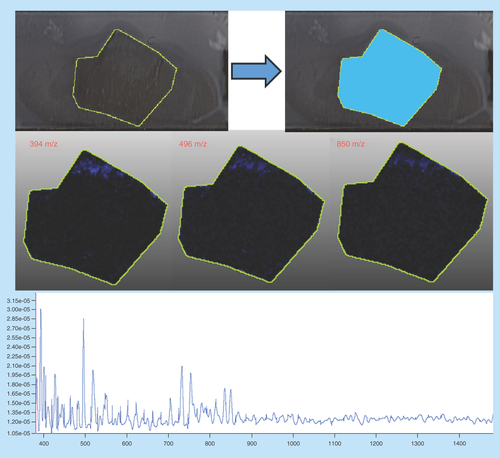
PK15 cell line monolayer
Sample type: Porcine lung (PK15 cell line monolayer; ).
Figure 4. PK15 cell line monolayer.
Green outlines indicate the borders of actual tissue sections relative to their position on the slide. Blue boxes show the area that was actually imaged.
Target analyte: Proteins.
Preparation method: Cells were grown to a confluent monolayer, fixed with methanol, sublimated with sinapinic acid at 0.22 mg/cm2 and recrystallized with 600 μl of solvent for 1 h at 37°C.
Slide appearance: The slide has a very even and homogeneous covering of matrix with no signs of delocalization or aggregation.
Image quality: Images are not as homogeneous as expected with differing intensity of different molecules at different parts of the slide. This is due to uneven growth of the cell monolayer and the presence and absence of enough biological material to generate a strong signal.
Spectral quality: The spectra are clean with little to no noise; however, the diversity of molecules is very small. Again, this is due to the lack of enough sample to generate measurable peaks.
Concluding remarks: This particular sample is only approximately 1 μm thick as opposed to the traditional approximately 12 μm used for tissue imaging. While the spectra are very clean with high quality peaks, the simple lack of sample results in only the eight most abundant molecules being detected. It is also apparent that the monolayer has not grown evenly as there should be no gross morphology. Ideally, this sample should be a homogeneous tissue layer of the same cells that appears as a uniform layer of analytes. The uneven cell growth was confirmed with light microscopy (data not shown).
Mouse heart 1
Sample type: Fresh frozen mouse heart ().
Figure 5. Mouse heart 1.
Green outlines indicate the borders of actual tissue sections relative to their position on the slide. Blue boxes show the area that was actually imaged.
Target analyte: Proteins.
Preparation method: Sublimated with sinapinic acid at 1.8 mg/cm2 and recrystallized with 250 μl of solvent for 90 min.
Slide appearance: The slide appears to be uniformly coated with no obvious signs of delocalization or matrix aggregation.
Image quality: The images are uneven showing very little structure within the tissue borders; however, regions beyond the tissue are showing saturation (indicated by white out of those areas) at each of the molecular weights.
Spectral quality: The spectra are of acceptable quality, but there are fewer peaks than would normally be expected [Citation27]. The intensity for each peak is also very low with a range of only 0.2–1 units.
Concluding remarks: The phenomena seen in these samples, with extreme signal intensity outside the tissue borders, is the result of ‘noise’ in the bordering pixels becoming amplified alongside the masses of interest by the processing software. This is a necessary step in order to visualize the very low counts of the actual molecules of interest. Although this is suggesting that the analytes have moved, it is in fact an artefact of the data processing and not representative of the actual biology of the sample.
An additional mouse heart sample can be seen in Supplementary Data (Supplementary Figure 1).
Mouse kidney
Sample type: Fresh frozen mouse kidney ().
Figure 6. Mouse kidney.
Green outlines indicate the borders of actual tissue sections relative to their position on the slide. Blue boxes show the area that was actually imaged.
Target analyte: Proteins.
Preparation method: Sublimated with sinapinic acid at approximately 0.22 mg/cm2 and recrystallized with 700 μl of standard solvent for 1 h – the application of recrystallization solvent by manual pipetting was uneven.
Slide appearance: The slide shows some level of delocalization of surface matrix resulting in areas of aggregation.
Image quality: The image has a ‘pitted’ appearance throughout indicating delocalization of the matrix. Differential images are visible (panel 1 and 3 from left to right); however, they are of limited use as there is pooling over large regions of the section due to the movement of matrix.
Spectral quality: The spectra are dominated by several large high mass peaks with other low intensity molecules lost. There is a reasonable spread of molecules across the mass range; however, abundance of species is below expectations for a complex tissue such as kidney.
Concluding remarks: This image has been delocalized to a moderate level resulting from the addition of too much solvent as well as the uneven pipetting on the paper of the vapor chamber, when the sample was recrystallized. The matrix has aggregated in discrete locations diluting the usually clear demarcation between the cortex and medulla of the kidney.
Mouse liver 1
Sample type: Fresh frozen mouse liver ().
Figure 7. Mouse liver 1.
Green outlines indicate the borders of actual tissue sections relative to their position on the slide. Blue boxes show the area that was actually imaged.
Target analyte: Proteins.
Preparation method: Sublimated with sinapinic acid at approximately 0.22 mg/cm2 and recrystallized with 100 μl of standard solvent for 90 min.
Slide appearance: The slide appears to be perfectly recrystallized with even and homogeneous matrix and no signs of delocalization.
Image quality: The images are patchy with the silhouette of the tissue section containing very little visual information. This is due to significant delocalization of the surface analytes.
Spectral quality: The spectra are noisy and of very low intensity with short peaks that do not resolve to baseline.
Concluding remarks: This image demonstrates a common artefact of digital image processing. The enhanced signal that is seen outside the silhouette is not actually delocalization of the analyte, but the result of the analyte signal being so low that it is in the same intensity level as noise. The use of 100 μl of solvent for recrystallization here was insufficient to extract any surface molecules or dissolve enough of the matrix to create cocrystallization. This is also indicated in the spectra where peaks emerge from a high level of background noise.
There are additional mouse liver samples in supplementary data that demonstrate additional variations in recrystallization solvent volumes and recrystallization times (Supplementary Figure 2–5).
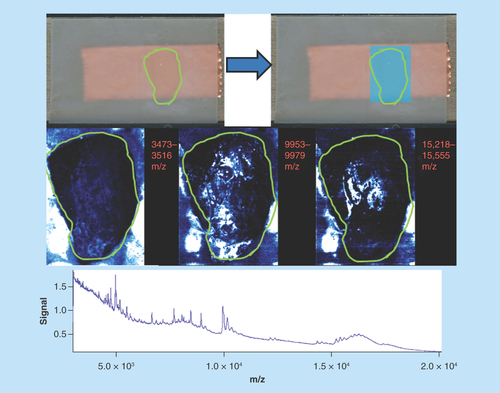
Mouse spinal cord
Sample type: Formalin-fixed mouse spinal cord ().
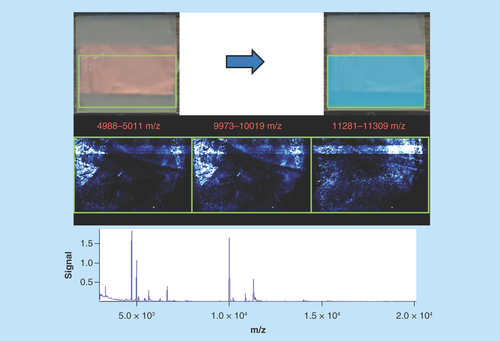
Figure 8. Mouse spinal cord.
Green outlines indicate the borders of actual tissue sections relative to their position on the slide. Blue boxes show the area that was actually imaged.
Target analyte: Peptides.
Preparation method: The sample was digested according to the standard protocol described above, sublimated with CHCA at approximately 0.22 mg/cm2 and recrystallized with 600 μl of standard solvent for 60 min. Methylene hydrolysis was not performed.
Slide appearance: The slide appears uniformly recrystallized and white in appearance, indicating that recrystallization has been performed correctly.
Image quality: The images are very poor quality, showing faint outlines of the two tissue sections. There are also visible artefacts in the first two panels resulting from the peptide masses being the same intensity as background noise.
Spectral quality: The spectra are very poor and with only four defined peaks across the mass range. The peak widths are uncharacteristically large for peptides.
Concluding remarks: The images from this sample are a perfect example of an incomplete digestion. In this case, the addition of the enzyme trypsin was performed correctly; however, the methylene hydrolysis step to remove formaldehyde cross-linking was not performed, reducing enzyme efficacy and severely limiting peptide generation.
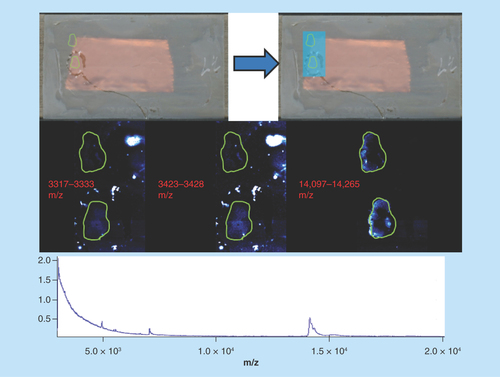
Human brain
Sample type: Formalin-fixed frozen human cerebral cortex ().
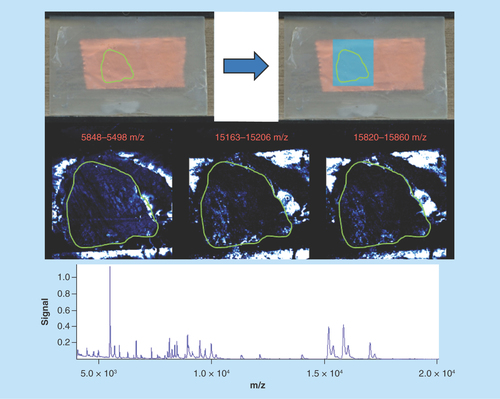
Figure 9. Human brain.
Green outlines indicate the borders of actual tissue sections relative to their position on the slide. Blue boxes show the area that was actually imaged.
Target analyte: Lipids.
Preparation method: Sublimated with DHB at approximately 0.22 mg/cm2 and recrystallized with 600 μl of standard solvent for 1 h at 37°C.
Slide appearance: This slide shows significant level of delocalization of surface matrix resulting in areas of aggregation bordering the center of the tissue.
Image quality: The images are very faint, with a region toward the upper tissue border showing the same image irrespective of the molecule being visualized. There is no signal detected in the center of the tissue section. This sample has also been confined to the tissue area only, potentially masking other features of incorrect sample preparation.
Spectral quality: The spectra are of low abundance and very low intensity showing only a few peaks of sufficient signal to generate an image.
Concluding remarks: This image has been significantly delocalized by the addition of too much solvent. The matrix has been mostly washed away from the surface of the sample leaving a ring of matrix around the borders of the tissue. The reason for this is due to the solubility of DBH in water and its tendency to recrystallize in a circular shape [Citation9]. This solubility means that the addition of the standard recrystallization solvent, which contains both organic solvent and water, has the effect of doubling the volume that is actually used. The matrix therefore dissolved and moved from to the center of the tissue to the edges, where it reached nucleation and recrystallized at the border of the glass slide.
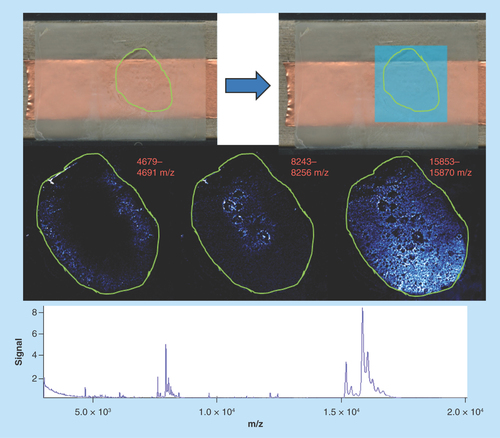
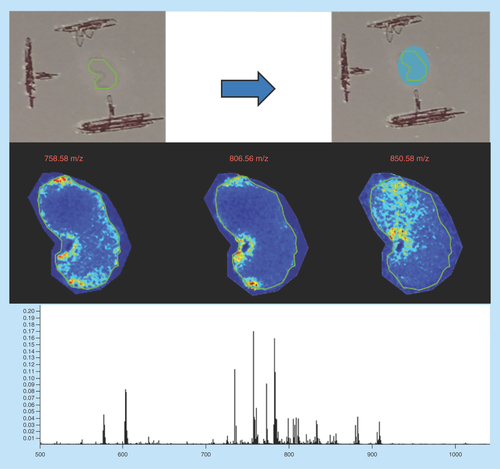
Mouse lymph node: correctly prepared
Sample type: Fresh frozen mouse lymph node ().
Target analyte: Lipids.
Preparation method: Sublimated with DHB at approximately 0.22 mg/cm2 , not recrystallized.
Slide appearance: The slide shows a homogeneous and even coating of matrix with no gaps or areas of increased or decreased coverage. This indicates that sublimation was performed correctly.
Image quality: The images show that the detected analytes are confined to the borders of the tissue and do not stray outside. Clear differentiation can be seen between each different panel with no common features that can be attributed to an artefact.
Spectral quality: The spectrum shows a high abundance of molecules across the mass range with peak resolution to two decimal places, demonstration that peak width was narrow leading to accurate mass determinations. Note: the mass range was truncated since no lipids were discovered above this range.
Concluding remarks: The combination of a high intensity mass spectrum together with a clear images and an evenly coated slide can all be used to determine that this sample was prepared correctly. This can be further confirmed with the narrow peak widths allowing for mass accuracy to two decimal places and no ‘range’ as seen in other images.
Conclusion
This visual index is the first of its kind and provides a comprehensive guide for interpreting MSI data and understanding why images fail even though they appear to have been processed correctly.
Our principle motivation for presenting this data review was to help in dispelling the unintentional ‘red herring’ interpretation of MSI images and prevent lengthy investigations and false conclusions arising from improperly prepared samples. We trust this review doubles as a valuable tool for MSI sample preparation and troubleshooting that assists a new generation of researchers to take advantage of the flexibility of MSI.
Future perspective
The progression of MALDI MSI is still at the stage of technical development; new innovations and sample types are dominating the current published literature. The true direction for this field is the widespread application to the elucidation of biologically relevant information. In particular, the fields of cancer diagnostics and biomarker screening show great promise since MSI is able to detect molecular signatures that are invisible to microscopy and traditional histology. There is also a significant ROM for development with complementary techniques and more advanced instrumentation that would allow for real-time MS/MS of molecules during image generation, thereby providing sequence level identification of detected biopolymers. It is our opinion that as instrumentation improves MSI will become reinvestigated as a future diagnostic platform.
Mass spectrometry imaging (MSI) is a technique that is often hard to develop requiring significant time and cost investments.
The lack of rapid progress in MSI is often attributable to the slow trial and error nature of developing reliable protocols.
We have extensive experience in the field with a comprehensive knowledge of sample preparation and data analysis.
It is from our experience that we have created this guide for curation and quality control of sample preparation.
The inherent issue with analyzing MSI data is that samples that produce excellent spectral data can have poor images and vice versa.
Our guide will serve as a comprehensive troubleshooting reference for a range of sample preparation conditions with extensive explanation as to which conditions are responsible for producing artefacts, delocalization and insufficient ionization.
Author contributions
MO Rourke collected the majority of data, performed the majority of analysis and wrote the majority of the manuscript. C Smith collected lipid human brain samples and provided analyses and methods for said. B Tse provided thepositive control figure and subsequent analysis. G Sutherland supervised lipid MSI analysis work and incepted brain lipid imaging project and proofread the manuscript. B Crossett provided instrumentation for all lipid imaging and proofread the manuscript. M Padula supervised all imaging performed by MO Rourke, provided instrumentation for said and incepted MSI projects for peptide and protein imaging.
Ethical conduct of research
The authors state that they have obtained appropriate institutional review board approval or have followed the principles outlined in the Declaration of Helsinki for all human or animal experimental investigations. In addition, for investigations involving human subjects, informed consent has been obtained from the participants involved.
supplementary data.docx
Download MS Word (5.1 MB)suppl_file.docx
Download MS Word (5.1 MB)Acknowledgments
The authors would also like to acknowledge Prof Stuart Cordwell for his expert advice and guidance on the presentation of this manuscript.
Supplementary data
To view the supplementary data that accompanythis paper please visit the journal website at: www.tandfonline.com/doi/full/10.4155/fsoa-2018-0095
Financial & competing interests disclosure
Tissues were received from the New South Wales Tissue Resource Centre at the University of Sydney and the Sydney Brain Bank, which is supported by the National Health and Medical Research Council of Australia, The University of New South Wales, Neuroscience Research Australia, Schizophrenia Research Institute and the National Institute of Alcohol Abuse and Alcoholism (grant number R24AA012725). The authors have no relevant affiliations or financial involvement with any organization or entity with a financial interest in or financial conflict with the subject matter or materials discussed in the manuscript. This includes employment, consultancies, honoraria, stock ownership or options, expert testimony, grants or patents received or pending, or royalties.
No writing assistance was utilized in the production of this manuscript.
Additional information
Funding
References
- O’Rourke MB, Raymond BB, Djordjevic SP, Padula MP. A versatile cost-effective method for the analysis of fresh frozen tissue sections via matrix-assisted laser desorption/ionisation imaging mass spectrometry. Rapid Commun. Mass. Spectrom. 29(7), 637–644 (2015).
- O’Rourke MB, Djordjevic SP, Padula MP. A non-instrument-based method for the analysis of formalin-fixed paraffin-embedded human spinal cord via matrix-assisted laser desorption/ionisation imaging mass spectrometry. Rapid Commun. Mass Spectrom. 29(19), 1836–1840 (2015).
- Jackson SN, Barbacci D, Egan T, Lewis EK, Schultz JA, Woods AS. MALDI-ion mobility mass spectrometry of lipids in negative ion mode. Anal. Methods 6(14), 5001–5007 (2014).
- Powers TW, Neely BA, Shao Y et al. MALDI imaging mass spectrometry profiling of N-glycans in formalin-fixed paraffin embedded clinical tissue blocks and tissue microarrays. PLoS ONE 9(9), e106255 (2014).
- Nimesh S, Mohottalage S, Vincent R, Kumarathasan P. Current status and future perspectives of mass spectrometry imaging. Int. J. Mol. Sci. 14(6), 11277–11301 (2013).
- Dunham SJ, Ellis JF, Li B, Sweedler JV. Mass spectrometry imaging of complex microbial communities. Acc. Chem. Res. 50(1), 96–104 (2017).
- Li B, Bhandari DR, Rompp A, Spengler B. High-resolution MALDI mass spectrometry imaging of gallotannins and monoterpene glucosides in the root of Paeonia lactiflora . . Sci. Rep. 6, 36074 (2016).
- Bhandari DR, Wang Q, Friedt W, Spengler B, Gottwald S, Rompp A. High resolution mass spectrometry imaging of plant tissues: towards a plant metabolite atlas. Analyst 140(22), 7696–7709 (2015).
- Ye H, Gemperline E, Venkateshwaran M et al. MALDI mass spectrometry-assisted molecular imaging of metabolites during nitrogen fixation in the Medicago truncatula–Sinorhizobium meliloti symbiosis. Plant J. 75(1), 130–145 (2013).
- Skriba A, Havlicek V. Mass spectrometry imaging of illicit drugs in latent fingerprints by matrix-free and matrix-assisted desorption/ionization techniques. Eur. J. Mass Spectrom. (Chichester) 24(1), 124–128 (2018).
- Hinners P, O’Neill KC, Lee YJ. Revealing individual lifestyles through mass spectrometry imaging of chemical compounds in fingerprints. Sci. Rep. 8(1), 5149 (2018).
- Wang J, Wang C, Han X. Enhanced coverage of lipid analysis and imaging by matrix-assisted laser desorption/ionization mass spectrometry via a strategy with an optimized mixture of matrices. Anal. Chim. Acta 1000, 155–162 (2018).
- Nielsen MM, Lambertsen KL, Clausen BH et al. Mass spectrometry imaging of biomarker lipids for phagocytosis and signalling during focal cerebral ischaemia. Sci. Rep. 6, 39571 (2016).
- Scott AJ, Jones JW, Orschell CM, Macvittie TJ, Kane MA, Ernst RK. Mass spectrometry imaging enriches biomarker discovery approaches with candidate mapping. Health Phys. 106(1), 120–128 (2014).
- Seeley EH, Caprioli RM. Molecular imaging of proteins in tissues by mass spectrometry. Proc. Natl Acad. Sci. USA 105(47), 18126–18131 (2008).
- O’Rourke MB, Padula MP. A new standard of visual data representation for imaging mass spectrometry. Proteomics Clin. Appl. 11(3–4), doi: 10.1002/prca.201600098 (2017) ( Epub ahead of print).
- Bancroft JD, Cook HC. Manual of Histological Techniques and Their Diagnostic Application. Churchill Livingstone, Nottingham, UK (1994).
- Sampey BP, Korourian S, Ronis MJ, Badger TM, Petersen DR. Immunohistochemical characterization of hepatic malondialdehyde and 4-hydroxynonenal modified proteins during early stages of ethanol-induced liver injury. Alcohol Clin. Exp. Res. 27(6), 1015–1022 (2003).
- Shi SR, Chaiwun B, Young L, Cote RJ, Taylor CR. Antigen retrieval technique utilizing citrate buffer or urea solution for immunohistochemical demonstration of androgen receptor in formalin-fixed paraffin sections. J. Histochem. Cytochem. 41(11), 1599–1604 (1993).
- Battifora H, Kopinski M. The influence of protease digestion and duration of fixation on the immunostaining of keratins. A comparison of formalin and ethanol fixation. J. Histochem. Cytochem. 34(8), 1095–1100 (1986).
- Bolognesi MM, Manzoni M, Scalia CR et al. Multiplex staining by sequential immunostaining and antibody removal on routine tissue sections. J. Histochem. Cytochem. 65(8), 431–444 (2017).
- Ghatak A, Combs CK. Iba1 immunoreactivity is enhanced following an antigen retrieval treatment with EDTA, pH 6.0. MethodsX 1, 269–274 (2014).
- Spengler B. Mass spectrometry imaging of biomolecular information. Anal. Chem. 87(1), 64–82 (2015).
- Chughtai K, Heeren RM. Mass spectrometric imaging for biomedical tissue analysis. Chem. Rev. 110(5), 3237–3277 (2010).
- O’Rourke MB, Padula MP. Analysis of formalin-fixed, paraffin-embedded (FFPE) tissue via proteomic techniques and misconceptions of antigen retrieval. Biotechniques 60(5), 229–238 (2016).
- Prentice BM, Ryan DJ, Van De Plas R, Caprioli RM, Spraggins JM. Enhanced ion transmission efficiency up to m/z 24000 for MALDI protein imaging mass spectrometry. Anal. Chem. doi:10.1021/acs.analchem.7b05105 (2018) ( Epub ahead of print).
- Yang J, Caprioli RM. Matrix sublimation/recrystallization for imaging proteins by mass spectrometry at high spatial resolution. Anal. Chem. 83(14), 5728–5734 (2011).
- Shariatgorji M, Svenningsson P, Andren PE. Mass spectrometry imaging, an emerging technology in neuropsychopharmacology. Neuropsychopharmacology 39(1), 34–49 (2014).
- Weaver EM, Hummon AB. Imaging mass spectrometry: from tissue sections to cell cultures. Adv. Drug Deliv. Rev. 65(8), 1039–1055 (2013).
- Rompp A, Spengler B. Mass spectrometry imaging with high resolution in mass and space. Histochem. Cell. Biol. 139(6), 759–783 (2013).
- O’Rourke MB, Padula MP, Smith C et al. Optimal preparation of formalin-fixed samples for peptide-based matrix-assisted laser desorption/ionization mass spectrometry imaging workflows. J. Vis. Exp. doi:10.3791/56778(131) (2018) ( Epub ahead of print).
- O’Rourke MB, Raymond BB, Padula MP. The characterization of laser ablation patterns and a new definition of resolution in matrix-assisted laser desorption ionization imaging mass spectrometry (MALDI-IMS). J. Am. Soc. Mass. Spectrom. 28(5), 895–900 (2017).