
Abstract
Aim: We propose a simple methodology to estimate oral bioavailability from Phase I clinical trials, which can be broadly phrased as ‘calculated bioavailability’ (FCAL). Materials & methods: FCAL is estimated by obtaining the product of circulating maximal observed drug concentration (Cmax’) and the estimated volume of distribution at steady state (VSS’) followed by dividing this product by the administered dose (d). VSS’ is estimated by allometric scaling based on the preclinical intravenous data. Results & conclusion: Overall, these analyses indicate that when the absorption is faster than elimination process and the VSS’ allometry exponent is between 0.9 and 1.1, the Fcal is a good estimate of the F.
Understanding of oral bioavailability is a key consideration in drug development. Oral bioavailability, commonly referred to as bioavailability (F), is defined as an estimate of the relative fraction of the orally administered dose that enters into the systemic circulation [Citation1]. The regulatory requirements state that the absolute oral bioavailability for a New Chemical Entity is not needed unless there is a particular reason to require such data [Citation2]. Such a study is typically conducted once the New Chemical Entity is furthered along in clinical development (Phases II and III) and there is confidence in its clinical safety and efficacy. The requirements of absolute oral bioavailability studies are slightly different in different regulatory environments [Citation3]. Due to the cost and resources required to perform intravenous (iv.) pharmacokinetic (PK) studies, iv. data are not available in almost all early stages of clinical development and in most New Drug Applications and marketed oral drugs [Citation4].
Bioavailability (F) is obtained by complementing oral (PO) dosing with iv. dosing and using EquationEquation (1) [Citation3]:
where AUCpo and AUCiv. are areas under the curves of concentration-time plots obtained after PO and iv. administration, respectively, and Div. and Dpo are the iv. and PO doses, respectively. It is known that F is a product of the fraction absorbed (Fa) and the fraction that escapes intestinal (FI) and hepatic (FH) elimination (EquationEquation (2)) [Citation5].
For a given drug, FI and FH are physiologically dependent parameters, which typically cannot be readily modulated. But Fa may be manipulated by optimization of the formulation or drug form. Thus, if exposure limitation was mainly due to low Fa, then it may be feasible to optimize the formulation to enhance the drug exposure. For example, if F is less than 10–20% when the hepatic first pass effect is estimated to be low to moderate, one may be able to improve it by formulation or by form and size control. In this current study, we introduce a simple methodology termed ‘calculated bioavailability’ (Fcal) for the purpose of estimating bioavailability (F) prospectively, providing data that could be used in early clinical development in the absence of human iv. data to identify absorption issues that can benefit from formulation work. In this study, we examined a theoretical basis of Fcal along with its limitations, and finally assessed its utilities using multiple clinical examples.
Theory & methods
Theory & simulations
The oral Fcal was estimated using EquationEquation (3):
where Cmax’ is the maximal observed drug concentration in systemic circulation after PO dosing, D is the administered oral dose and Vss’ is the apparent volume of distribution at the steady state. Vss’ can be estimated by either allometric scaling based on preclinical iv. data as a prospective method or human iv. data [Citation6] as a retrospective analysis.
For simplicity, we used a one-compartment model with first order absorption and elimination to build a theoretical relationship between Fcal and F. Under this one-compartment assumption, the concentration (C) in circulation after PO dosing was expressed as EquationEquation (4) [Citation5]:
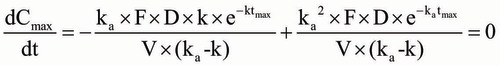
where ka and k are the absorption rate constant and elimination rate constant, respectively, F is the bioavailability, D is the administered oral dose, V is the volume of distribution and, t is the time after dosing. At the corresponding time of Cmax, namely tmax, the theoretical Cmax could be calculated as EquationEquation (5):
Since the rate of change of concentration is 0 at tmax, the following equation holds true:
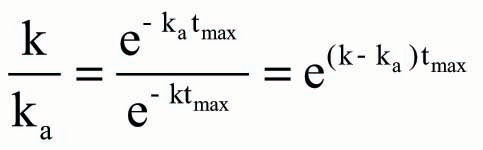
Then,
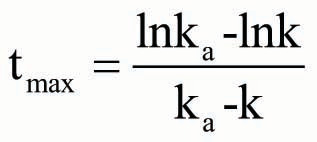
Therefore, the theoretical tmax could be calculated as EquationEquation (8) in the one-compartment model as follows:
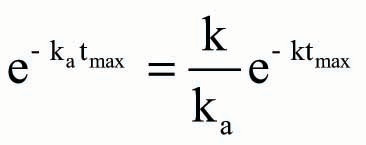
Based on EquationEquation (7),
Accordingly, the theoretical Cmax could be further rearranged as EquationEquation (10) after EquationEquation (9)
was incorporated into EquationEquation (5)
and expressed as follows:
When the observed Cmax [Cmax’ in EquationEquation (3)] is the same as or close to the theoretical Cmax, we can replace Cmax’ in EquationEquation (3)
with Cmax in EquationEquation (10)
,
Similarly, when the predicted or measured Vss [Vss’ in EquationEquations (3) and Equation(11)
] is the same as or close to the theoretical V,
Since e−ktmax < 1, therefore Fcal < F when Vss’/V = 1. For the prediction of PK parameters in human, besides the in vitro in vivo correlation, the allometric scaling also has been widely used with the assumption that there are anatomical, physiological and biochemical similarities between animals and human. In general, comparing with the prediction of the clearance, the allometric scaling has been reasonably accurate on the prediction of volume of distribution with or without the correction of the protein binding [Citation7].
Based on EquationEquations (8) and Equation(12)
, EquationEquation (13)
can be derived as follows:
EquationEquation (13) was used to examine the relationship between Fcal/F versus ka and k, and their ratio ka/k.
Clinical examples
Marketed drugs
The PK parameters, including preclinical and clinical Vss, human bioavailability (F), observed Cmax’, together with the doses (D) for the marketed, orally dosed drugs (total of 35 drugs) were obtained from two independent sources reported in 2005 and 2011 [Citation8,Citation9]. All drugs with the available PK parameters were included in the analysis without preselection. Cmax’ is the reported observed maximal drug concentration after PO dosing expressed in units of μM and the administered dose is expressed in mg/kg. Vss’ was determined by either preclinical simple allometric scaling methodology in units of L/kg or the measured values from published studies in 2011 for comparison [Citation8]. Based on the definition, the Fcal was estimated using EquationEquation (3). Correlations were evaluated between Fcal and measured F and visualized using the Vortex program (Dotmatics, Bishops Stortford, UK).
Vismodegib
F and other PK parameters for vismodegib in healthy female subjects were obtained from the existing literature [Citation10].
GDC-0834
A PO suspension dose of 105 mg of GDC-0834 was administered to healthy volunteers and the PK parameters were reported in previous studies [Citation11].
Human subjects & clinical trials
The studies were reviewed and approved from the formally constituted review board (institutional review board or ethics committee).
Preclinical examples
The PK parameters of mouse, rat, dog were examined. These were PK studies that both iv. (1 mg/kg) and oral (2 or 5 mg/kg) administration of the drugs were conducted. All compounds with the available PK parameters were included in the analysis without preselection. The numbers of studies were 519 for mouse, 986 for rat and 44 or 85 for dog. Cmax’ was the reported observed maximal drug concentration after PO dosing expressed in units of micrometers and the administered dose was expressed in milligrams per kilogram. Measured Vss was used for mouse and rat. For dog Vss, both the measured and estimated from mouse and rat based on simple allometric scaling were used. Based on the definition, the Fcal was estimated using EquationEquation (3). Correlations were evaluated between Fcal and measured F and visualized using the Vortex program (Dotmatics).
Results
Simulations
The theoretical relationships between Fcal/F versus ka and k are presented in . The plot demonstrated that for the purpose of using Fcal to predict F (assuming a one-compartment model), a high ka (fast absorption) and a low k (slow elimination) would be required. To state this more simply, the proposed Fcal method will provide a more accurate estimate of F for those compounds with relatively fast absorption and slow elimination. The relatively fast absorption may depend on several factors including rates of dissolution, food and stomach emptying. Furthermore, in quantitative terms, it is the ratio ka/k that determines the accuracy of this proposed method based on EquationEquation (13). The relationship between Fcal/F versus ka/k is shown in . It is clear that a high ratio of ka/k results in a high ratio of Fcal/F (approaching 100% with more accurate prediction). Our simulations indicated that when ka/k = 30, then Fcal was calculated to be 90% of F; when ka/k = 12 and 6, then Fcal was found to be 80 and 70% of F, respectively.
When k is small (the half-life is long) and ka is large (the absorption is fast), Fcal is fairly close to the measured F (left upper corner). However, as k grows larger and/or ka becomes smaller, Fcal becomes a smaller fraction of F (right lower corner).
A high ratio of ka/k will result in a high ratio of Fcal/F (approaching 100% with more accurate prediction). Our simulations indicate when ka/k = 30, then Fcal = 90% of F; when ka/k = 12, then Fcal = 80% of F; and when ka/k = 6, then Fcal = 70% of F.
Clinical examples
Marketed drugs
When the Fcal method was used and Vss’ was determined by allometric scaling, good correlation was observed between measured F and calculated Fcal provided that the allometric exponents were between 0.9 and 1.1 (A, green dots). The improvement of Vss’ prediction with other methods could further improve the usefulness of the Fcal method as demonstrated in B under the ideal condition by using the measured Vss’.
(A) When the Fcal method was used with Vss’ determined by simple allometric scaling, there was a good correlation between measured F and calculated Fcal provided the exponents were between 0.9 and 1.1 (A, green dots). (B) The estimate of Fcal could be further improved under ideal condition by using the measured Vss’.
Vismodegib
When dosed orally at 150 mg, the average Cmax calculated was 5.95 μM (n = 6)
GDC-0834
GDC-0834 was dosed PO at 105 mg to healthy volunteers. After dosing, the drug was not found in the circulation, except for the major circulating metabolite or hydrolyzed product (referred to as M1) as reported previously [Citation11]. The average Cmax’ of M1 was 9 μM or 390 ng/ml. In a separate study, the metabolite M1 was dosed intravenously in rats and the Vss’ was determined to be 1.94 l/kg. If we assume the same volume of distribution normalized by the body weight between rat and human (allometric exponent, b = 1), the total amount of metabolite M1 at tmax is 53 mg (calculated as Vss’ × Cmax’, assuming that the average human body weight is 70 kg). This resulted in Fcal value of 70% (absorption of GDC-0834 into portal circulation) compared with the parent dose after the conversion of the molecular weight from M1 to parent ().
GDC-0834 was dosed PO at 105 mg to control volunteers. No drug was detected in the circulation except for the major circulating metabolite M1 (hydrolyzed product). The average Cmax’ of M1 was 9 μM or 390 ng/ml. In a separate study, the metabolite M1 was dosed intravenously in rats and the Vss’ was determined to be 1.94 l/kg. If we assume the same volume distribution normalized by the body weight between rats and humans (allometric exponent, b = 1), the total amount of metabolite M1 at tmax is 53 mg (calculated as Vss’ × Cmax’ assuming that the average weight of human body is 70 kg). This resulted in Fcal about 70% compared with the parent dose after the conversion of the molecular weight from metabolize (M1) to the parent GDC-0834. The molecular weights of GDC-0834 and M1 are 597 and 433 Da, respectively.
Preclinical assessment
Robust correlations were observed between log measured %F and %Fcal for the data from all three species tested (Supplementary Figure 1). Linear regression was performed for each set. The largest dataset, from rat, included 898 compounds and the measured %F spanned four orders of magnitude (from 0.03 to 300). For over 90% of the set, the measured %F was greater than %Fcal. Log measured %F showed a good linear fit by log %Fcal, with a slope of 0.77 and an intercept of 0.64; the R2 of the correlation was 0.75.
Discussion
Fcal is a simple, mathematical term used for representation of bioavailability of orally administered drugs. It is derived as a product of Cmax’ and Vss’ divided by the total administered dose. Fcal can be calculated after First in Human studies and the potential absorption issues can be identified and could be potentially addressed by formulation work. Using conditions of a one-compartment model, we elaborated the theoretical aspects of this concept in the current study. We also demonstrated the circumstances where Fcal closely matches F and finally were able to explore the practical usage of this method. Compared to one-compartment model, the two-compartment model was examined for the proposed method and the results were not conclusive since more PK parameters were involved. For two-compartment model, more uncertainties occur as at tmax the central compartment and peripheral compartment may have different concentrations. Therefore, here we used the one-compartment model for the purpose of determination of Fcal in terms of Cmax’ and Vss’ and the total administered dose.
The core feature of this concept is based on the amount of drug remaining in the body at tmax after the oral dose. This parameter is dependent on both ka and k as described in EquationEquations (8) and Equation(12)
. There are two factors that cause Fcal to underestimate the measured F. The first factor is theoretical and based on EquationEquation (12)
. Theoretically, Fcal is always less than F as it is well established that Fcal is the remaining fraction of F at tmax. The parameter that is not accounted for in the Fcal (compared with F) is the fraction of the bioavailable dose (F) eliminated from time zero to tmax, namely 1- e−ktmax. Therefore, the relationship between Fcal and F could be understood from the mass balance point of view, in other words, the more of the drug remaining at tmax (larger e−ktmax), the closer Fcal is to F. With this knowledge, based on EquationEquation (13)
, it seems possible to improve the accuracy of Fcal, at least theoretically, by dividing the Fcal by the expression e−ktmax, where k can be estimated from the slope of the PK curve, assuming a one-compartment model. The effects of ka and k on the Fcal method or Fcal/F are apparent in . When k is small (the half-life is long) and ka is large (the absorption is rapid), Fcal is fairly close to measured F (left upper corner of ). However, as k grows larger and/or ka gets smaller, Fcal becomes a smaller fraction of F (right lower corner of ). Considering a drug with a reasonable half-life and a short tmax, Fcal should provide a reasonable assessment of F, especially for the drugs intended for immediate release with once a day dosing. Another way to visualize this relationship is by comparing the ratios of ka/k to Fcal/F (). When ka/k > 6, Fcal/F is about 70% of true oral bioavailability, which is a reasonable estimation considering the normal data variability is around 30% (internal communication). This means that the calculations using Fcal account for the majority of the absorbed dose in the body. There is a second factor that makes Fcal lower than measured F. Specifically, the maximal observed concentration (Cmax’) usually is considered to be lower than the theoretical Cmax due to the limited number of sampling time points. This issue can be addressed by increasing the frequency of PK sampling around the tmax, if feasible.
In addition, there is an important factor influencing the application of the Fcal method to the prediction of F, which is the value of Vss’ as used in the calculation (EquationEquation 11). This factor is usually not a serious concern based on the assumption of scalability of Vss except the case when free fraction (fu) is highly variable across species. However, by comparing (A) and (B) in with the marketed drugs, it was clearly demonstrated that the accuracy of Vss’ played a critical role in the accuracy of the Fcal method. The Vss’/V in EquationEquation 11
should be close to 1 if the measured values were used and the compound follows one-compartmental model kinetics. Therefore, there is a probability that Fcal/F would in fact be > 1 as shown in because of the overprediction of Vss’. In A, the allometric scaling method was used and the prediction confidence of Fcal could be stratified based on the value of the exponent from Vss’ allometry. The improvement of the Vss’ prediction with other methods could significantly improve the usefulness of the Fcal method as demonstrated in B under ideal conditions by using the measured Vss’. There are several methods for the prediction of Vss’ [Citation13] however they are beyond the scope of this work. Generally, allometric scaling and in vitro methods are considered relatively reliable and accurate to predict human volume of distribution within twofold of error for most of compounds [Citation7]. Since Vss’ plays a critical role in the Fcal method, we propose that the Fcal method should be used cautiously when the exponent value is far outside the range of 0.9–1.1 based on allometric scaling of Vss’, or ‘free’ allometry should be considered for the Vss’ prediction when the plasma protein binding was significantly different from each species.
To further explore this methodology, we used two in-house clinical examples to demonstrate the concept with available clinical data. These examples allowed for the assessment of Fcal methodology and decide on the next steps. Vismodegib had a very long half-life plus the micromolar sustained concentrations. For GDC-0834, only a cleaved product was observed in circulation and the question was related to the absorption of the drug-related material.
The first example involved vismodegib, a drug that has an extremely low k with a terminal half-life of several weeks [Citation10]. The low rate of elimination of the drug is mainly due to the very low hepatic metabolic clearance. Vismodegib has unusual ADME (absorption, distribution, metabolism and excretion) properties, but one aspect of it that could be useful for our examples is the determination of bioavailability of this drug using a conventional method versus the proposed method. Based on an absolute bioavailability studies in humans, F is 31.8% for vismodegib. By using the measured Vss’, Fcal was 27.4%, which was comparable to the measured F. However, the Fcal was calculated as 77.2% when the predicted Vss’ was used based on the allometric scaling. It was not clear what the reason(s) were behind the difference between measured and predicted Vss’. This example further demonstrated the important role of Vss’ in the estimation of Fcal.
The second clinical example involved GDC-0834, a clinical candidate used for inhibiting Bruton’s tyrosine kinase [Citation11]. Preliminary metabolite identification studies of GDC-0834 suggested significant species differences in the extent and type of metabolism [Citation11]. In vitro studies showed evidence for amide hydrolysis observed mainly in human liver fractions. This hydrolysis rate was observed as a high risk for this program but expedited clinical studies were necessary to confirm this. In the clinical studies, GDC-0834 (105 mg) was dosed orally and plasma samples at various time points were collected to quantitate GDC-0834 and its hydrolyzed metabolite M1 [Citation11]. No detectable level of GDC-0834 was observed, however the major metabolite M1 was detected. Here, we applied the Fcal concept to determine the exposure of GDC-0834 based on the M1 PK data (). Based on these calculations, Fcal was approximately 70% (absorption of GDC-0834 into portal circulation). This estimate was used to demonstrate that metabolism but not absorption was the reason behind the lack of exposure to GDC-0834.
Though the focus here has been the clinical utility of this methodology in early clinical studies, the preclinical studies also confirmed its usefulness. This correlation between measured F and Fcal was robust using measured Vss (). When the dog volume of distribution was calculated by allometric scaling from the Vss’s of mouse and rat, the correlation was weaker (R2 = 0.44) than that using the measured Vss, nonetheless it is still significant (n = 44 and p < 0.001).
Table 1. Significant correlations between the logarithm (base 10) of %Fcal with the logarithm (base 10) of measured %F in mouse, rat and dog.
Conclusion
In summary, this work demonstrates an easy method to calculate the oral bioavailability when iv. data are not available. As such the usefulness of this method is valuable for getting a quick read on oral bioavailability once Cmax’ for a given dose is obtained from Phase I study. Based on the theoretical and clinical studies, two conditions are prerequisites when using the Fcal method to estimate F for compounds. These prerequisite conditions can be listed as follows: fast absorption and slow elimination as shown in the simulations (ka/k > 6); accurate prediction of Vss’ as demonstrated in the marketed drugs. Based on these, Fcal is derived as a product of Cmax’ and Vss’ divided by the total administered dose. The degree of success of the Fcal method is dependent on the effectiveness of the prerequisite conditions. As a result, it can help to identify the need or not (like GDC-0834) for formulation fixes to improve oral exposure. The intent is to apply this concept to estimate oral bioavailability in early drug development to decide if we can optimize the formulation to improve the drug exposure. We do not advocate using the proposed method to replace iv. study for determination of absolute oral bioavailability.
A simple methodology to estimate oral bioavailability from Phase I clinical trials, which can be broadly phrased as ‘calculated bioavailability’ (Fcal).
Fcal is estimated by obtaining the product of circulating maximal observed drug concentration (Cmax’) and the estimated volume of distribution at steady state (Vss’) followed by dividing this product by the administered dose (d).
This methodology is very sensitive to the measured Cmax’ and estimated Vss’.
This methodology was examined in 35 marketed drugs. When the Fcal method was used and Vss’ was determined by allometric scaling, good correlation was observed between measured F and Fcal provided that the allometric exponents were between 0.9 and 1.1.
When examined in preclinical species (mouse (n = 519), rat (n = 986) and dog (n = 85)), robust correlations were observed from all the three species tested.
For best prediction, two prerequisite conditions can be listed as follows: fast absorption and slow elimination as shown in the simulations (ka/k > 6); accurate prediction of Vss’ as demonstrated in the marketed drugs.
The intent of Fcal is to apply this concept to estimate oral bioavailability in early drug development to decide if we can optimize the formulation to improve the drug exposure.
We do not advocate using the proposed method to replace intravenous study for determination of absolute oral bioavailability.
Acknowledgements
We would like to thank the staff in the Departments of Drug Metabolism and Pharmacokinetics and Clinical Pharmacology for their contributions in generating data for this study. The clinical trials of vismodegib and GDC-0834 were funded by Genentech, Inc.
Financial & competing interests disclosure
All the authors are employees of Genentech, Inc. The clinical trials of vismodegib and GDC-0834 were funded by Genentech, Inc. The authors have no other relevant affiliations or financial involvement with any organization or entity with a financial interest in or financial conflict with the subject matter or materials discussed in the manuscript apart from those disclosed.
No writing assistance was utilized in the production of this manuscript.
Additional information
Funding
References
- Food and Drug Administration . Guidance for industry – bioavailability and bioequivalence studies submitted in NDAs or INDs – general considerations . The Food and Drug Administration ( 2014 ). www.fda.gov/downloads/drugs/guidancecomplianceregulatoryinformation/guidances/ucm389370.pdf .
- Food and Drug Administration . Food-effect bioavailability and fed bioequivalence studies . The Food and Drug Administration , Rockville, MD, USA , 12 ( 2002 ).
- Mastan S , LathaTB , AjayS . The basic regulatory considerations and prospects for conducting bioavailability/bioequivalence (BA/BE) studies – an overview . Comp. Eff. Res.1 , 1 – 25 ( 2011 ).
- The Food and Drug Administration . Guidance for industry – population pharmacokinetics . The Food and Drug Administration ( 1999 ). www.fda.gov/downloads/drugs/guidances/UCM072137.pdf .
- Perrier D , GibaldiM . General derivation of the equation for time to reach a certain fraction of steady state . J. Pharm. Sci.71 ( 4 ), 474 – 475 ( 1982 ).
- Sinha VK , De BuckSS , FenuLAet al. Predicting oral clearance in humans: how close can we get with allometry? Clin. Pharmacokinet. 47 ( 1 ), 35 – 45 ( 2008 ).
- Obach RS . Prediction of human volume of distribution using in vivo, in vitro, and in silico approaches . Annu. Rep. Med. Chem.42 , 469 – 488 ( 2007 ).
- Hardman J . The Pharmacological Basis of Therapeutics (10th Edition) . HardmanJG , LimburdLE , GilmanAG ( Eds ). McGraw-Hill , NY, USA ( 2000 ).
- Jolivette LJ , WardKW . Extrapolation of human pharmacokinetic parameters from rat, dog, and monkey data: molecular properties associated with extrapolative success or failure . J. Pharm. Sci.94 ( 7 ), 1467 – 1483 ( 2005 ).
- Graham RA , HopCE , BorinMTet al. Single and multiple dose intravenous and oral pharmacokinetics of the hedgehog pathway inhibitor vismodegib in healthy female subjects . Br. J. Clin. Pharmacol.74 ( 5 ), 788 – 796 ( 2012 ).
- Liu L , HalladayJS , ShinYet al. Significant species difference in amide hydrolysis of GDC-0834, a novel potent and selective Bruton’s tyrosine kinase inhibitor . Drug Metab. Dispos.39 ( 10 ), 1840 – 1849 ( 2011 ).
- Wong H , ChenJZ , ChouBet al. Preclinical assessment of the absorption, metabolism and excretion of GDC-0449 (2-chloro-3-pyridin-2-yl)-4-(methylsulfonyl)benzamide), an orally bioavailable systemic Hedgehog signalling pathway inhibitor . Xenobiotica39 , 850 – 861 ( 2009 ).
- Hosea NA , CollardWT , ColeSet al. Prediction of human pharmacokinetics from preclinical information: comparative accuracy of quantitative prediction approaches . J. Clin. Pharmacol.49 ( 5 ), 513 – 533 ( 2009 ).