
Abstract
Aims: Drug–drug interaction studies were used to estimate CYP3A4-dependent clearance of LY2623091. Methods: in a cross-over design, healthy adults received a single 6-mg dose of LY2623091 at baseline. Itraconazole (200 mg twice on day 1 then daily × 19 days; n = 16) and diltiazem (240 mg Extended Release daily × 13 days; n = 16) were given. On days 6 and 4, respectively, LY2623091 was dosed 1 h after itraconazole/diltiazem. Pharmacokinetic samples were obtained and static and dynamic models were used to assess interaction. Results: Area under the concentration–time curve for LY2623091 increased 2.2-fold with itraconazole and 1.4-fold with diltiazem. Maximum plasma concentration did not change. The physiologically based pharmacokinetic model overpredicted itraconazole and hydroxy–itraconazole concentrations. Extraction by CYP3A4 was ∼0.5; gut wall extraction was negligible. Conclusion: Interaction risk requires early clinical assessment to quantify the candidate drug. (Clinical trial registration number: NCT02300259). Data deposition: deposition pending.
LY2623091 (LY) is a selective, orally active, nonsteroidal, competitive mineralocorticoid receptor antagonist that blocks the actions of aldosterone and other mineralocorticoid receptor ligands. Preclinical studies of the molecule suggested that oxidative metabolism was the major clearance pathway with renal and biliary clearance playing smaller roles. In vitro studies with recombinant cytochrome P450 (rCYP) enzymes suggested that CYP3A4 is the enzyme responsible for the oxidative metabolism of LY, contributing >99% of the total CYP-mediated metabolic clearance. Furthermore, in vitro studies with cultured human hepatocytes revealed a relatively small contribution of amide hydrolysis (∼5% of total metabolites recovered) to overall hepatic metabolism. Based on these data, a clinical drug–drug interaction (DDI) study was conducted to assess the risks associated with co-administration of moderate and strong CYP3A inhibitors. These data were assessed in light of a radiolabeled drug mass balance study that subsequently became available. A population pharmacokinetic (PK) analysis has been published elsewhere [Citation1]; the analysis described herein was conducted to elucidate the clearance mechanisms driving the high-level PK parameters [Citation1].
High-dose ketoconazole (400 mg daily for ≥5 days) was the gold standard of strong CYP3A inhibitors in clinical DDI studies during drug development; however, in 2013, the US FDA and the EMA advised against using a ketoconazole regimen following review of clinical safety reports [Citation2,Citation3]. There is considerable debate regarding the choice of a replacement for ketoconazole in drug development, with itraconazole (ITR), clarithromycin, ritonavir, posaconazole and cobicistat being proposed as alternatives [Citation4–7]. However, despite having a complex PK profile leading to uncertainty around optimal study design, ITR is widely used as a reference strong CYP3A4 inhibitor due to the in vivo selectivity for CYP3A4 and good tolerance in healthy volunteers [Citation4,Citation7].
Accordingly, a clinical study was conducted to assess the change in the exposure of LY when co-administered with ITR. The study design recommended by Ke et al. [Citation7] was used to ensure that ITR concentrations elicited strong inhibition and approximated steady state for assessment of the interaction with LY. The concentrations of ITR and hydroxy-ITR (OH-ITR) in the plasma were determined to evaluate the utility of the physiologically based pharmacokinetic (PBPK) model developed by Ke et al. to facilitate trial design for DDI studies with long half-life drugs, such as LY. Due to the uncertainty in predicting ITR PK and CYP3A inhibition in drug development and the uncertainty in using the outcome of such a study to estimate the fraction of substrate (LY) metabolized by CYP3A and the fraction escaping gut wall metabolism, a second CYP3A inhibitor, diltiazem (DIL) was also included in the study. DIL is relevant to the target patient population but is a considerably weaker inhibitor of CYP3A than ITR. The inclusion of two CYP3A inhibitors had the potential advantage of facilitating an estimate of the CYP3A contribution to the clearance of LY, while also mitigating the risk of an unexpected outcome using a single inhibitor.
Methods
In vitro assessments
Initially, in vitro approaches were used to determine the particular CYP enzymes responsible for the in vitro metabolism of LY and to predict the fraction of hepatic CYP-mediated clearance that was mediated by CYP3A. A substrate depletion approach was utilized whereby at concentrations expected to represent first-order (nonsaturated) processes, LY (30 and 60 nM) and a positive control, verapamil (300 nM) were incubated for 5 and 30 min with human liver microsomes (HLMs; from a mixed-gender pool of 150 individuals; BD Biosciences, MA, USA) and a panel of 10 cDNA-expressed CYPs (rCYPs; SupersomesTM, BD Biosciences; rCYPs 1A2, 2B6, 2C8, 2C9, 2C19, 2D76, 2E1, 2J2, 3A4 and 3A5) at 0.25 mg/ml protein. Verapamil demonstrated the expected substrate depletion rate constant in HLMs and metabolism by rCYPs 2D6, 3A4 and 3A5. Under these experimental conditions, the intrinsic clearance of drug (CLint) for HLM was 86.4 µl/min/mg.
Physiologically-based PK simulations
Based on the in vitro data, we performed simulations using the Simcyp® (version 14) software package (Simcyp, A Certara Company, Sheffield, UK) to simulate the clinical DDI potential of LY with two CYP3A inhibitors. The DIL simulations used the Simcyp library DIL file with no adjustments and the trial design outlined in . The Simcyp library file for DIL was comprised the parent drug file and an accompanying metabolite file for desmethyl-DIL (formed via CYP3A4 and 1A2 metabolism of the parent). Both the parent and the metabolite were captured as competitive- (Ki values of 36.1 and 2.43 µM, respectively) and mechanism-based (Ki values of 4.75 and 1.74 µM, respectively, and kinact values of 0.702 and 1.09 h−1, respectively) inhibitors of CYP3A4 as illustrated by Rowland et al. [Citation8]. The ITR simulations used the trial design in and the Simcyp ITR library file with some small modifications as suggested by Ke et al. [Citation7]. The Simcyp library file for ITR is comprised the parent drug file and an accompanying metabolite file for hydroxyl-ITR (formed via CYP1A2 and 3A4 metabolism of the parent). Both the parent and the metabolite are described as competitive inhibitors of CYP3A4 with Ki values of 0.0013 and 0.0023 µM, respectively. A compound file for LY was created using the input parameters and assumptions specified in . The absorption of LY was assumed to be permeability rate-limited and described by a first-order absorption model. The elimination was assumed to be entirely via hepatic oxidative metabolism, which was justified based on the lack of renal or biliary excretion observed in preclinical species and predominance of oxidative metabolites observed in human hepatocyte preparations. Active hepatic uptake of LY was not detected in in vitro studies. However, these studies were inconclusive due to very high nonspecific binding, Therefore active uptake cannot be ruled out. However, in vitro in vivo extrapolation of metabolic clearance predicted in vivo observed clearance in preclinical species within twofold, so we felt that it was reasonable to assume that LY did not undergo active hepatic uptake. Efflux transport was also assumed to not be a factor in determining the disposition of LY due to its high permeability. The volume of distribution was input as observed after oral dosing, assuming bioavailability was complete. High bioavailability was a reasonable assumption based on preclinical data, low CLint (and hence, low extraction ratio) and good permeability and solubility.
Table 1. In silico simulation design for the evaluation of the impact of CYP3A4 inhibition on the pharmacokinetics of LY2623091 using Simcyp.
Table 2. Drug-specific assumption of parameters of LY2623091 used to construct the physiologically based pharmacokinetic model.
Human DDI study
This was a single-center, open-label, fixed-treatment sequence, parallel-design study in three groups of healthy adult male and female subjects. The study was conducted at the Covance Clinical Research Unit, Inc. (FL, USA) in accordance with Good Clinical Practice guidelines and ethical principles that have their origin in the Declaration of Helsinki. The study protocol was approved by an independent institutional review board (Midlands Independent Review Board, KS, USA), and subjects were required to provide written informed consent before any study-related procedures were performed.
The study was comprised three groups: group 1 quantified the effect of ITR, a strong CYP3A inhibitor, on the PK of LY; group 2 quantified the effect of DIL, a moderate, time-dependent inhibitor of CYP3A, on the PK of LY. Group 3 was to assess the interaction between simvastatin, a sensitive CYP3A substrate, and LY; the results of that group are not relevant to the current discussion and are hence discussed no further except to say that there was no clinically significant effect of LY on the PK of simvastatin or simvastatin acid.
It was planned that up to 32 subjects would be enrolled into groups 1 and 2 so that ∼28 subjects (14 per group) completed the study. Subjects enrolled in this study were required to be overtly healthy males and postmenopausal or surgically sterile females, aged 18 to 65 years, inclusive, with a body mass index of 18.5–32.0 kg/m2, inclusive.
The study consisted of two periods. In period 1, a single 6-mg dose of LY was administered orally in capsules with 240 ml of water. Blood samples were collected for quantification of plasma LY over a period of 240 h. Period 2 began a minimum of 9 days after the start of period 1, and the design differed slightly between the two groups:
Group 1 subjects received 200 mg ITR (administered as an oral solution; 10 mg-ITR/ml) twice daily on day 1 followed by daily dosing for 4 days (days 2–5). On day 6, LY was dosed 1 h after ITR administration. ITR dosing continued daily for a further 14 days (days 7–21) following LY administration. Plasma samples were collected to determine the PK of LY, ITR and OH-ITR.
Group 2 subjects received 240 mg DIL extended release daily for 3 days. On day 4, LY was dosed concurrently with DIL and blood samples were collected to determine the PK of LY. Trough samples were also collected for DIL and desacetyl-DIL (DES-DIL). DIL dosing continued following the dose of LY for 9 days (through day 13).
Safety and tolerability were assessed throughout the study by means of vital sign measurements, clinical laboratory tests, electrocardiograms, physical examinations (as indicated) and adverse event (AE) recording.
Human mass balance study
The clinical study was conducted at the Covance Clinical Research Unit, Inc. (WI, USA). Participants were healthy male subjects, aged 27–63 years. Subjects were required to provide written informed consent before any study-related procedures were performed. After an overnight fast, the subjects (n = 6) received a single oral dose of 25 mg (100 µCi) of [14C]-LY2623091 administered as an oral solution. Subjects continued fasting for 4 h and were given water ad libitum from 1 h after dosing. Blood samples were collected predose and at 0.5, 1, 2, 3, 4, 6, 8, 10, 12 and 24 h post dose, and every 24 h thereafter until the study release criteria had been met (subjects remained on study until up to 21 days post dose). Urine was collected before study drug administration (-12 to 0 h), 0–6, 6–2 and 12–24 h post dose and at 24-h intervals thereafter until the study release criteria had been met. Feces from each bowel movement were collected and the time of collection was noted. For each subject, fecal samples were combined by the analytical laboratory for each 24-h period and subsequently analyzed to determine the percentage of radioactivity excreted over that period. Whole blood, plasma, urine and fecal concentrations of radioactivity were determined using liquid scintillation counting techniques.
Bioanalytical methods
Plasma concentrations of LY, ITR, OH-ITR, DIL and DES-DIL were measured using validated and MS/MS methods. The LLOQ was 0.5 ng/ml for LY, 1 ng/ml for ITR and OH-ITR and 0.1 ng/ml for DIL and DES-DIL. The upper limit of quantification was 900 ng/ml for LY, 1000 ng/ml for ITR and OH-ITR and 200 ng/ml for DIL and DES-DIL. Samples with concentrations above these upper limits were diluted to yield results within the calibrated ranges. LY was stable for up to 320 days (when stored with anticoagulant at approximately -20 or -70°C), 168 days for ITR and OH-ITR (when stored at ∼ -70°C) and 425 days for DIL and DES-DIL (when stored at ∼ -70°C). All LY samples were analyzed at Quintiles BioSciences, Inc. (NY, USA), ITR and OH-ITR samples were analyzed at Covance Laboratories Inc. (WI, USA) and DIL and DES-DIL samples were analyzed at Pharmaceutical Product Development, LLC (PPD; WI, USA).
PK analysis methods
PK parameters for LY, ITR, OH-ITR, DIL and DES-DIL were computed by standard noncompartmental methods of analysis using Phoenix WinNonlin® version 6.2.1 (Pharsight, A Certara Company; CA, USA). The maximum observed plasma drug concentration (Cmax), area under the plasma concentration versus time curve (AUC) from time zero to tlast (AUC(0-t)), where tlast is the time of last measurable plasma concentration, and AUC from time zero to infinity (AUC(0-∞)) were calculated for LY in periods 1 and 2. Trough concentrations, and Cmax and AUC(0-T) were also calculated for ITR, OH-ITR, DIL and DES-DIL where appropriate. Samples below the LOQ were treated as missing from the analysis, except for predose concentrations which were set to zero.
Statistical methods
The PK parameters AUC(0-tlast), AUC(0-∞) and Cmax for LY were log-transformed and evaluated using analysis of variance with treatment as a fixed effect and patient as a random effect. The ratios of geometric least squares means of these parameters and their 90% repeated CIs between LY parameters in the presence (period 2) or absence (period 1) of an inhibitor were calculated.
Static model calculations based on observed data
The mean AUC ratios of LY in the presence of ITR and DIL given various fraction metabolized (fm) values, were estimated using EquationEquation 1Equation 1 . The fraction of drug entering the GI tract that passes into portal circulation (Fg) was assumed to be 0.92 since, in the presence of ITR, the observed Cmax of LY increased minimally (by 8%). The value of fm that would result in AUC ratio of LY in the presence of ITR and DIL closest to that observed was identified.
Equation 1
Where AUCR is the AUC of LY in the presence of inhibitor divided by the ‘uninhibited’ AUC of LY; fm is the fraction of LY metabolized by CYP3A; Fg is the fraction of LY that enters the enterocytes that is available to the portal circulation (assumed to be 0.92 as described earlier); and A and B are the constants describing the extent of CYP3A inhibition mediated by the inhibitor. That is, A describes the proportion of hepatic metabolism remaining after inhibition, and B describes the fraction of gut metabolism remaining.
The parameters A and B are dependent on the inhibitor and the dosing schedule used. These constants have been calculated previously and described for DIL by Han et al. [Citation9]. Given a dosing regimen of 120 mg twice daily for 14 days, both A and B are 0.32.
The values of A and B, given the dosing schedule recommended by Ke et al. [Citation7] and using a solution formulation of ITR, have not been reported. Therefore, they were calculated as follows: a simulation was run using the study design described in , and the Simcyp output was examined to assess the reduction in CYP3A4 CLint at the level of the gut and the liver. The average CLint remaining, over the dosing interval in the liver and the gut, was taken to represent the ‘A’ and ‘B’ parameters, respectively. The hepatic CLint of the CYP3A substrate was reduced to between 10.9 and 51.0% of the uninhibited clearance over the dosing interval. These values were averaged to give a value for A of 0.31. Similarly, the gut CLint was reduced to between 2.0 and 4.8% of the uninhibited clearance over the dosing interval. These values were averaged to give a value for B of 0.034.
Results
In vitro assessments
The CLint values for rCYP3A4 and 3A5-mediated metabolism of LY were 8.41 µl/min/pmol CYP and 4.64 µl/min/pmol CYP, respectively, and the CLint for rCYP2J2 was determined to be 0.49 µl/min/pmol CYP.
Using relative activity factors (RAFs) determined in-house, the scaled HLM CLint for CYP2J2 and 3A4 were estimated to be 1.8 and 367 µl/min/mg, respectively, for LY. An RAF was not available for rCYP3A5, and since the depletion rate for rCYP3A5 was approximately 50% of that for rCYP3A4, CYP3A4-mediated metabolism was considered to represent total CYP3A-mediated metabolism for determinations of fraction metabolized. Using the aforementioned scaled HLM CLint values for LY adjusted by RAF, we estimated the fraction metabolized via CYP2J2 to be 0.005 (0.5%), while that for CYP3A4 was 0.995 (99.5%) of the hepatic CYP-mediated clearance of LY.
Physiologically based PK simulations
Using a bottom-up approach based on the above in vitro data and the input parameters provided in , the exposure to LY (in the absence of interacting drug) was well predicted by the PBPK model. The Cmax and AUC0-inf were within twofold of the observed data (1.2- and 0.6-fold, respectively; ). The same ‘bottom-up’ model predicted an AUC ratio of 9.8 when LY was administered with ITR, and a ratio of 2.9 when LY was administered with DIL ().
Table 3. Observed and predicted pharmacokinetic parameters for LY2623091, itraconazole, and hydroxy-itraconazole and observed and predicted interaction ratios for LY2623091 in the presence of itraconazole and diltiazem.
DDI study: disposition & subject characteristics
Sixteen subjects were recruited to group 1 and 16 to group 2. One subject in group 1 discontinued because of an AE after receiving all doses of study drugs and submitting for PK sampling on day 14 of period 2. Data from this subject are included in the PK analysis. Three subjects in group 2 did not complete the study, but all available PK data at the time of discontinuation were included in the analysis. One subject discontinued due to an AE following completion of PK sampling in period 1 and, one subject withdrew consent due to personal reasons and discontinued the study following the day 13 PK blood collection in period 2. The third discontinued subject also withdrew consent due to personal reasons, discontinuing the study following the day 11 PK blood sample collection in period 1. The two AEs leading to subject discontinuation were considered unrelated to LY.
Safety & tolerability
Of the 16 subjects who received 6 mg LY and 200 mg ITR, two subjects reported AEs that were related to study treatment as judged by the investigator (diarrhea and abdominal discomfort). During the ITR lead-in, seven mild AEs (diarrhea and abdominal discomfort/distention, and cough) were reported by three subjects and judged to be related to ITR treatment by the investigator. No subjects reported AEs following administration of LY alone. All AEs were of mild severity and resolved without treatment.
Of the 14 subjects who received 6 mg LY and 240 mg DIL, one subject had an AE (aspartate aminotransferase increased) of moderate severity approximately 10 days after the last dose of DIL that was considered related to study treatment by the investigator. The aspartate aminotransferase recovered to within normal limits when retested 4 days later. During the DIL lead-in, three mild AEs (constipation, abdominal pain and abdominal distension) were reported by one subject and judged to be related to DIL treatment by the investigator. No subjects reported drug-related AEs following administration of LY alone.
The incidence of drug-related AEs was low in both groups and most AEs were of mild severity. Overall, co-administration of LY with ITR or DIL did not appear to alter the AE profile compared with administration of LY alone. There were no clinically significant changes in supine pulse rate, systolic blood pressure, diastolic blood pressure or electrocardiograms recorded during the study.
LY2623091 PK & CYP3A interaction
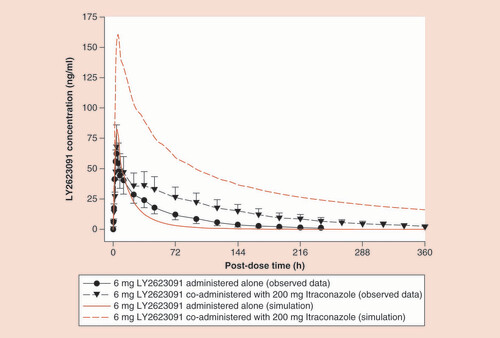
LY PK in this study was consistent with that described previously [Citation1]. The impact of ITR administered in group 1, period 2 on the systemic exposure (i.e., Cmax and AUC(0-∞)) of LY is presented and graphically represented in . The statistical analyses of the geometric least squares means ratios of LY plus ITR relative to LY alone for AUC(0-∞) and Cmax are listed in , demonstrating that there was a moderate inhibition of LY metabolism by ITR and its metabolites with a fold ratio of 2.23 for AUC. The corresponding fold ratio for DIL-mediated inhibition was 1.37. The predicted fold ratios for LY exposure in the presence of the metabolites are also shown in .
Red lines represent simulations; black lines show the observed data with the error bars representing the 90% confidence interval.
ITR & hydroxy-ITR PK
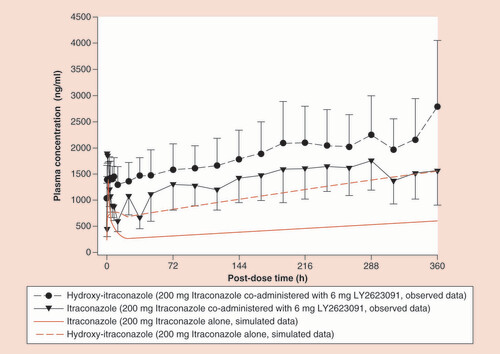
One of the aims of the current study was to better understand the PK of ITR and optimal study design for CYP3A interaction studies. ITR and OH-ITR PK were predicted prior to the study. Predicted PK of the two analytes was compared with the observed data in , while shows the predicted and observed accumulation of ITR and OH-ITR.
Red lines represent simulations; black lines represent observed data with the error bars representing the 90% confidence interval.
Human mass balance study
Orally administered [14C]- LY2623091 was cleared primarily by metabolism with only 2% of the radioactive dose being excreted as intact drug, thus confirming the validity of the PBPK model where renal clearance is considered to be negligible. The primary metabolic clearance pathways involved were oxidative dealkylation within the morpholine ring, oxidative deamination with loss of the morpholine ring and cleavage of the urea substituent ().
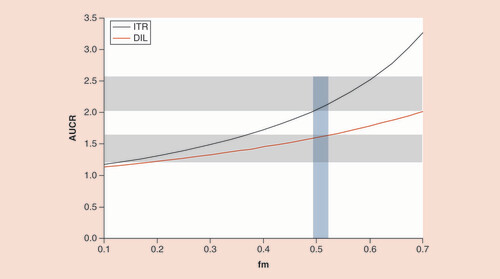
AUCR: Area under the concentration–time curve ratio; DIL: Diltiazem; fm: Fraction metabolized; ITR: Itraconazole.
F: Feces; P: Plasma.
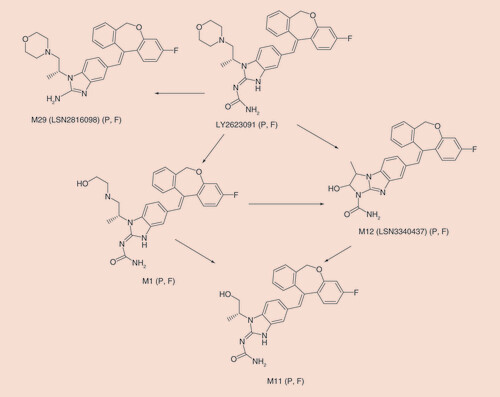
The mean (n = 6) recovery of radioactivity in urine and feces was 61.9% (± 4.17%) over the 504-h study (range = 56.9–68.8%) with only 1.4% of the total radioactivity recovered in urine. Most of the administered radioactivity was excreted slowly and recovered in the first 312 h post dose (∼55.0%). Quantifiable levels of radioactivity in urine and feces were observed for the majority of subjects through 504 h post dose (the last collection interval). In total, 17 metabolites were detected in plasma and feces. Urine was not profiled due to the low percentage of dose excreted in urine. The primary metabolic pathways and circulating metabolites are presented in . M1, the primary oxidative metabolite, and M12 were the two metabolites most likely formed via CYP3A pathways and would be subject to inhibition. A previously undetected nonoxidative metabolic pathway was identified (M29 in ). This nonoxidative metabolite, the result of the cleavage of the urea, was excreted in feces at a comparable percentage (12%) to the primary oxidative metabolite, M1 (13%).
Static model calculations
The value of fm that would result in AUC ratios (for DIL and ITR) closest to the observed values was identified. shows the AUC ratios and corresponding fm values which were simulated using Equationequation 1Equation 1 . The 95% confidence limits for the observed AUC ratios are shown on the plot as gray blocks. As demonstrated by the blue shaded area, an fm value of approximately 0.5 allowed the observations to fall within the 90% CI for both ITR and DIL simultaneously.
Discussion
The safe and effective use of a new drug requires an understanding of the fraction of the systemic clearance that proceeds via excretory and metabolic routes. This knowledge is leveraged in developing a quantitative understanding of the effect of intrinsic and extrinsic factors on drug exposure and identifying appropriate dosing recommendations. Preclinical animal studies revealed that LY was not excreted unchanged in feces or urine to a significant extent. Further, metabolites detected in human hepatocyte incubations were derived from oxidation and determined to likely be formed by CYP-mediated metabolism. The only CYP capable of oxidizing LY in vitro was CYP3A4, and hence the fm via CYP3A in humans was projected to be high (>90%) with the potential for a tenfold increase in systemic exposure in the presence of strong CYP3A4 inhibitors that completely inhibited enzymatic clearance. Therefore, we tested this hypothesis by conducting DDI studies with the strong and moderate CYP3A4 inhibitors, ITR and DIL, respectively.
To design the DDI study between LY and ITR, we employed a PBPK model previously verified to predict the interactions between ITR and midazolam over nine studies [Citation7]. Based on these simulations, an ITR solution regimen was utilized, whereby 200 mg was administered twice daily on day 1 followed by 200 daily for 14 days and LY administered 1 h after the inhibitor on day 6. These conditions were chosen to minimize variability in exposure, reach close to maximal inhibition with a short lead-in time and maintain inhibition over the long elimination phase of LY. Under these conditions the predicted AUC ratio of LY in the presence of ITR was 9.8 under the assumptions of an fm of 0.95, as justified previously, and an Fg of unity. The value of Fg was subsequently estimated to be 0.92 and therefore is not a major determinant of the extent of LY AUC increase in the presence of ITR. A significant but substantially lower 2.23-fold increase in LY exposure was detected in the clinical study described herein. Similarly the observed increase in LY AUC elicited by DIL was substantially lower than predicted ().
We have systematically addressed the potential reasons for the substantially lower than predicted DDI between ITR/DIL and LY. First, we assessed whether the PBPK model systematically overpredicts the inhibitory effect of ITR/DIL on CYP3A metabolism. Using the same or similar dosing regimen employed in this study, ITR caused a six- to tenfold increase in midazolam AUC in three studies [Citation10–12], whereas the PBPK prediction from Ke et al. [Citation7] was a 6.8-fold increase on day 4 of the same regimen. Similarly, DIL caused a 3.9- and 4.8-fold increase in the oral AUC of midazolam and simvastatin, respectively [Citation13,Citation14]. Second, we addressed the possibility that ITR and its inhibitory 6-hydroxy metabolite did not achieve the plasma concentrations predicted by the PBPK model. However, this was also ruled out because our observed inhibitor concentrations were approximately double than those predicted (). Incorporating the higher plasma concentrations of these two inhibitors into the model would lead to an even greater predicted AUC ratio and a larger overprediction of DDI magnitude. Using top-down optimization of the original PBPK model for ITR implemented in Simcyp, Ke et al. demonstrated an improved prediction of observed ITR and the OH-ITR plasma concentrations [Citation7]. However, although our observed Cmax and AUC of ITR and OH-ITR are within twofold of the model predictions, there is clearly still some improvement necessary to accurately describe the concentration-time profile of ITR and OH-ITR. Indeed, Chen et al. [Citation15] have published a top-down optimization of the Simcyp model which appears to offer some improvement. The study design recommended by Ke et al. [Citation7], and used in the current study (ITR twice daily on first day followed by 4 more days of daily dosing) was employed primarily to achieve ITR concentrations approximating steady state (i.e., ∼75% of steady state concentration) prior to dosing LY. As seen in , steady state was not reached by day 6, nor was it reached by the end of the study as concentrations of both ITR and OH-ITR appeared to continue increasing beyond the final sampling time point. Other studies have demonstrated that steady state can be reached by around day 14 [Citation16,Citation17]. We believe this continued accumulation to be a characteristic of ITR itself since the observed concentrations were similar to those observed elsewhere [Citation16,Citation17], and there was no reason to suspect that LY inhibited the clearance of ITR, thereby causing the concentrations to increase in this way. It should be noted that this continued accumulation would inevitably lead to a greater extent of hepatic CYP3A inhibition on prolonged dosing and an extended washout and subsequent recovery of CYP3A activity.
The remaining possible explanation for the poor ITR/DIL DDI predictions relate to misspecification of clearance pathways. A clinical study with radiolabeled LY was performed at approximately the same time as the current study, and the absence of significant renal excretion (<2%) was confirmed. The study with radiolabeled LY also confirmed that clearance of LY was predominately by metabolism (2% of the dose excreted as intact LY) with oxidative pathways (M1, M11, M12 in ) as expected from in vitro studies. However, a previously undetected nonoxidative metabolic pathway was identified (M29 in ). This nonoxidative metabolite, cleavage of the urea, was excreted in feces at a comparable percentage to the primary oxidative metabolite, M1, in feces. Taking this into account, the fm would be estimated at approximately 0.68 and the predicted interaction with ITR and DIL would be approximately 3.5- and 2.0-fold, respectively, which are much closer to the observed values of 2.2 with ITR and 1.4 with DIL (). The very low efficiency of formation of the hydrolysis product in human hepatocytes suggests that nonhepatic hydrolases may be involved and highlights the challenges inherent in predicting the contribution of non-CYP pathways to overall systemic clearance.
Finally, it is possible that an active transport process could offer an explanation for the overestimation of the DDI based on in vitro data. Efflux transport was not considered to play a role in the overestimation of DDI liability since absorption was thought to have been complete and the compound was highly permeable. Had intestinal efflux inhibition been included in the model, our predicted DDI would have been very similar or even greater, depending on what assumption was chosen for fa. Conversely, if active hepatic uptake was the rate limiting step determining intracellular concentrations in the hepatocyte, then the effect of inhibiting CYP3A metabolism could be dampened. The in vitro to in vivo extrapolation of metabolic clearance had worked well in preclinical species which led us to believe that hepatic uptake would not play a role. However, when in vitro studies were conducted in cultured hepatocytes to assess the potential for hepatic uptake of LY, the results were inconclusive due to a very high level of nonspecific binding. Perhaps further investigation into hepatic uptake of LY is warranted since it appeared to be the only feasible explanation remaining for the poor translation of our assumptions to clinical outcome.
A well-conducted DDI study not only estimates the clinical risk of a specific victim-perpetrator pair but also allows the result to be used to further define the clearance pathways of a new drug. The static DDI model provides a convenient approach to estimating the values of Fg and fm of a new drug by exploiting the known effect of well-characterized inhibitors on gut and hepatic CYP3A4 [Citation18]. In this approach, the fractional remaining liver CYP3A activity (A in EquationEquation 1Equation 1 ) and the fractional remaining gut activity (B in EquationEquation 1
Equation 1 ) in the presence of an inhibitor is determined from observations made when the inhibitor is co-administered with the sensitive CYP3A substrate, midazolam, when it is administered intravenously. The values of A and B estimated for DIL with the dosing regimen used in this study are both 0.32 [Citation9]. These values were combined with the assumed high value of Fg, to simulate expected AUC ratios, given different fm values. This exercise demonstrated that the plausible range of potential fm values would be from approximately 0.2-0.5 (the range within which the red line in falls within the 90% CI of the observations). There is no clinical study in which the oral solution of ITR has been co-administered with intravenous midazolam, and consequently the corresponding A and B values are not known. However, these values can be estimated from Simcyp simulations based on the model proposed by Ke et al. [Citation7] for a solution formulation. This approach resulted in A and B values of 0.31 and 0.034, respectively, and allowed us to simulate the range of plausible AUC ratios, given various fm values. When the observed AUC ratios and their 90% CIs are overlaid with the simulated values (), it becomes clear that the likely range of fm values is between 0.49 and 0.52. Using the information from both inhibitors simultaneously, we were able to refine the reasonable values and focus on a plausible fm for LY of around 0.5. However, caution should be exercised when building upon these conclusions as the A and B values are derived for short half-life drugs and have not been prospectively verified for long half-life drugs where the time-averaged concentration of inhibitor may be different.
Conclusion
We demonstrated the importance of well-conducted human studies in defining the clearance pathways for a new drug. Preclinical studies are key drivers of the development program by identifying high-risk drug properties and setting priorities for human studies. Ultimately, the clinical studies can be leveraged to provide a complete understanding of clearance pathways and, subsequently, important intrinsic and extrinsic modulators of clearance.
Future perspective
Drug developers will make increasing use of mechanistic PK approaches to understand the characteristics of their molecules and to form the basis of dosing recommendations or other regulatory arguments. As we rely more heavily on the in vitro, in vivo and clinical data package for a drug molecule, it is important to develop methodology that ensures the maximum information is extracted from every study ().
Table 4. Observed and predicted pharmacokinetic parameters for LY2623091, itraconazole, and hydroxy-itraconazole and observed and predicted interaction ratios for LY2623091 in the presence of itraconazole and diltiazem.
It is a belief firmly held that in vitro and preclinical data can be integrated into physiologically based pharmacokinetic models to predict drug–drug interactions (DDIs) via CYP3A with reasonable confidence.
However, it is also understood that there is some degree of uncertainty implicit in both the prediction of clearance mechanisms and in the prediction of a DDI based on a given in vitro inhibitory potency.
Further uncertainty was introduced when regulatory agencies recently mandated the cessation of clinical DDI studies with the strong inhibitor ketoconazole. Ketoconazole was thus replaced with the somewhat less well-understood inhibitor, itraconazole (ITR).
ITR concentrations were collected diligently and thoroughly throughout the study to add to the current understanding of ITR and hydroxy-ITR exposures and the plasma accumulation of both moieties.
The approach whereby a more well-understood CYP3A inhibitor is introduced in a study in order to inform and finesse the understanding of the fraction metabolized via CYP3A for the substrate drug elucidated from a less well-understood inhibitor is novel.
It is clear that even with extensive preclinical investigation, there can still remain unexpected metabolic pathways or clearance routes and the fraction metabolized via CYP3A can be overestimated.
Ethical conduct of research
The authors state that they have obtained appropriate institutional review board approval or have followed the principles outlined in the Declaration of Helsinki for all human or animal experimental investigations. In addition, for investigations involving human subjects, informed consent has been obtained from the participants involved.
Financial & competing interests disclosure
This study was funded by Eli Lilly and Company. The authors are employees of and minor stockholders in Eli Lilly and Company. The authors have no other relevant affiliations or financial involvement with any organization or entity with a financial interest in or financial conflict with the subject matter or materials discussed in the manuscript apart from those disclosed.
Writing assistance was utilized in the production of this manuscript. Eli Lilly and Company funded the medical writing and editorial support provided by T Ball. T Ball is an employee of inVentiv Health Clinical.
Additional information
Funding
References
- Wang EB , ChaudharyA , WaterhouseTH , DickinsonGL . Population pharmacokinetics of LY2623091 in patients with hypertension and chronic kidney disease . J. Clin. Pharmacol.57 ( 6 ), 739 – 746 ( 2017 ).
- Center for Drug Evaluation and Research . FDA Advises Against Using Oral Ketoconazole in Drug Interaction Studies Due to Serious Potential Side Effects . US Department of Health and Human Services ( 2015 ). www.fda.gov/Drugs/DrugSafety/ucm371017.htm .
- European Medicines Agency . Guideline on the Investigation of Drug Interactions ( 2012 ). www.ema.europa.eu/docs/en_GB/document_library/Scientific_guideline/2012/07/WC500129606.pdf .
- Liu L , BelloA , DresserMJet al. Best practices for the use of itraconazole as a replacement for ketoconazole in drug-drug interaction studies . J. Clin. Pharmacol.56 , 143 – 151 ( 2016 ).
- Greenblatt DJ , HarmatzJS . Ritonavir is the best alternative to ketoconazole as an index inhibitor of cytochrome P450–3A in drug–drug interaction studies . Br. J. Clin. Pharmacol.80 , 342 – 350 ( 2015 ).
- Vermeer LM , IsringhausenCD , OgilvieBW , BuckleyDB . Evaluation of ketoconazole and its alternative clinical CYP3A4/5 inhibitors as inhibitors of drug transporters: the in vitro effects of ketoconazole, ritonavir, clarithromycin, and itraconazole on 13 clinically-relevant drug transporters . Drug Metab. Dispos.44 , 453 – 459 ( 2016 ).
- Ke AB , Zamek-GliszczynskiMJ , HigginsJW , HallSD . Itraconazole and clarithromycin as ketoconazole alternatives for clinical CYP3A inhibition studies . Clin. Pharmacol. Ther.95 , 473 – 476 ( 2014 ).
- Rowland Yeo K , JameiM , YangJ , TuckerGT , Rostami-HodjeganA . Physiologically based mechanistic modelling to predict complex drug–drug interactions involving simultaneous competitive and time-dependent enzyme inhibition by parent compound and its metabolite in both liver and gut – the effect of diltiazem on the time-course of exposure to triazolam . Eur. J. Pharm. Sci.39 , 298 – 309 ( 2010 ).
- Han B , DickinsonGL , TurnerPK , HallSD . Prediction of CYP3A mediated drug-drug interactions: estimation of gut wall and hepatic contributions [abstract] . Clin. Pharmacol. Ther.93 ( Suppl. 1 ), S44 ( 2013 ).
- Olkkola KT , AhonenJ , NeuvonenPJ . The effects of the systemic antimycotics, itraconazole and fluconazole, on the pharmacokinetics and pharmacodynamics of intravenous and oral midazolam . Anesth. Analg.82 , 511 – 516 ( 1996 ).
- Backman JT , KivistöKT , OlkkolaKT , NeuvonePJ . The area under the plasma concentration–time curve for oral midazolam is 400-fold larger during treatment with itraconazole than with rifampicin . Eur. J. Clin. Pharmacol.54 , 53 – 58 ( 1998 ).
- Olkkola KT , BackmanJT , NeuvonenPJ . Midazolam should be avoided in patients receiving the systemic antimycotics ketoconazole or itraconazol . Clin. Pharm. Ther.55 , 481 – 485 ( 1994 ).
- Zhang X , QuinneySK , GorskiJC , JonesDR , HallSD . Semiphysiologically based pharmacokinetic models for the inhibition of midazolam clearance by diltiazem and its major 1metabolite . Drug Metab. Dispos.37 , 1587 – 1597 ( 2009 ).
- Mousa O , BraterDC , SunbladKJ , HallSD . The interaction of diltiazem with simvastatin . Clin. Pharmacol. Ther.67 , 267 – 274 ( 2000 ).
- Chen Y , MaF , LuTet al. Development of a physiologically based pharmacokinetic model for itraconazole pharmacokinetics and drug–drug interaction prediction . Clin. Pharmacokinet.55 , 735 – 749 ( 2010 ).
- Barone JA , KohJG , BiermanRHet al. Food interaction and steady-state: pharmacokinetics of itraconazole capsules in healthy male volunteers . Antimicrob. Agents Chemother.37 , 778 – 784 ( 1993 ).
- Hardin TC , GraybillJR , FetchickR , WoestenborghsR , RinaldiMG , KuhnJG . Pharmacokinetics of itraconazole following oral administration to normal volunteers . Antimicrob. Agents Chemother.32 , 1310 – 1313 ( 1988 ).
- Peters SA , SchroederPE , GiriN , DolgosH . Evaluation of the use of static and dynamic models to predict drug–drug interaction and its associated variability: impact on drug discovery and early development . Drug Met. Disp.40 , 1495 – 1507 ( 2012 ).