
Abstract
Breast cancer is the leading cause of cancer related death in women. Quercetin is a flavonol shown to have anti-carcinogenic actions. However, few studies have investigated the dose-dependent effects of quercetin on tumorigenesis and none have used the C3(1)/SV40 Tag breast cancer mouse model. At 4 weeks of age female C3(1)/SV40 Tag mice were randomized to one of four dietary treatments (n = 15–16/group): control (no quercetin), low-dose quercetin (0.02% diet), moderate-dose quercetin (0.2% diet), or high-dose quercetin (2% diet). Tumor number and volume was assessed twice a week and at sacrifice (20 wks). Results showed an inverted ‘U’ dose-dependent effect of dietary quercetin on tumor number and volume; at sacrifice the moderate dose was most efficacious and reduced tumor number 20% and tumor volume 78% compared to control mice (C3-Con: 9.0 ± 0.9; C3-0.2%: 7.3 ± 0.9) and (C3-Con: 2061.8 ± 977.0 mm3; and C3-0.2%: 462.9 ± 75.9 mm3). Tumor volume at sacrifice was also reduced by the moderate dose compared to the high and low doses (C3-2%: 1163.2 ± 305.9 mm3; C3-0.02%: 1401.5 ± 555.6 mm3), as was tumor number (C3-2%: 10.7 ± 1.3 mm3; C3-0.02%: 8.1 ± 1.1 mm3). Gene expression microarray analysis performed on mammary glands from C3-Con and C3-0.2% mice determined that 31 genes were down-regulated and 9 genes were up-regulated more than 2-fold (P < 0.05) by quercetin treatment. We report the novel finding that there is a distinct dose-dependent effect of quercetin on tumor number and volume in a transgenic mouse model of human breast cancer, which is associated with a specific gene expression signature related to quercetin treatment.
Abbreviations
| MIN | = | mammary intraepithelial neoplasia |
| DCIS | = | ductal carcinoma in situ |
| BW | = | body weight |
| Muc13 | = | Mucin 13 |
| TIMP4 | = | tissue inhibitor of metalloproteinases-4 |
| krt6a/b | = | keratin 6A/B |
| NGFR | = | nerve growth factor receptor |
| TMPRSS4 | = | transmembrane protease serine 4 |
| FABP7 | = | fatty acid binding protein-7 |
| GREB1 | = | growth regulation by estrogen in breast cancer |
| ERα | = | estrogen receptor alpha |
| DEPTOR | = | DEP domain containing mTOR-interacting protein |
| DEXA | = | dual-energy X-ray absorptiometry |
Introduction
According to the American Cancer Society, it is estimated that 232,670 new cases of invasive breast cancer will be diagnosed in 2014 and that 40,000 women will die from the disease making breast cancer the most commonly diagnosed and the second most deadly cancer in women in the United States. Research suggests that breast cancer risk may be reduced by an increased intake of fruits and vegetables, given their higher content of bioactive compounds with anti-cancer properties; however robust epidemiological data to firmly support this hypothesis is still lacking.Citation1-Citation7 Further, the lack of controlled in vivo experimental studies examining this relationship and the mechanisms involved weaken the basis for inferring a causal relationship.
Quercetin is a phytoestrogen and polyphenol present in several plant-based foods with numerous beneficial properties including anti-oxidant, anti-inflammatory, anti-obesogenic and anti-carcinogenic actions.Citation8,9 Numerous in vitro studies have established quercetin as an anti-carcinogenic agent, which can decrease cell proliferation and survival in several malignant tumor cell lines including breast cancer.Citation10-Citation13 Specifically, in MDA-MB breast cancer cell lines quercetin treatment reduced cell proliferation and/or increased apoptosis, as well as caused an accumulation of cells in G2/M phase and a decrease of cells in G1 phase, indicative of cell cycle arrest.Citation10,Citation12-Citation20 Investigations utilizing animal models of breast cancer have also provided evidence of a benefit of quercetin as tumor growth is decreased and markers of proliferation and apoptosis are modulated favorably.Citation21-Citation24 However, across published studies there is tremendous variability related to both effective doses and the model systems employed, which may explain why significant gaps in our mechanistic understanding of quercetin's actions remain.
In the present investigation we utilized the C3(1)/SV40Tag mouse model of breast cancer to investigate the anti-carcinogenic potential of quercetin on mammary tumor development and progression. C3(1)/SV40Tag mice exist on a FVB/N background and are representative of the human disease; mammary lesions that develop by 8-12 weeks of age are histologically similar to mammary intraepithelial neoplasia (MIN) and ductal carcinoma in situ (DCIS) observed in humans.Citation25,26 Mammary tumors develop with a 100% incidence in transgenic female mice and progress to invasive carcinomas at ∼16weeks of age making this a timely and appropriate model for prevention and intervention studies.Citation25,26 However the effect of quercetin administration has not been examined using this model.
The goals of the present investigation were 2-fold. First, we wished to determine the optimal dose of quercetin for prevention of breast cancer specifically in the triple negative C3(1)/SV40Tag mouse model. Second, we sought to establish a novel mRNA expression signature of the effects of quercetin in mammary tumorigenesis displayed in the C3(1)/SV40Tag mouse model to provide future targets for mechanistic research on the anti-carcinogenic actions of quercetin. We hypothesized that quercetin treatment would significantly reduce tumorigenesis in a dose-dependent manner with the highest quercetin dose (2%) being most effective compared to the moderate (0.2%) and lowest (0.02%) dose when incorporated into the diet for a 16 week period. However, the results instead supported an inverted ‘U’ dose response with the moderate 0.2% dose being most effective and therefore this dose was selected for further analyses.
Results
Descriptive characteristics
Dose
Food intake was monitored each week and was similar across all groups; average intake over the 16 week treatment period was between 2.6-2.9 g/day/mouse in the C3(1)/SV40Tag groups. Absolute food intake (in grams) was consistent over the treatment period, however because animals gained body weight over time, the relative dose of quercetin (expressed as mg/kg BW) decreased slightly within each group. The average daily dose of quercetin received over the 16 week period was 2899.9 mg/kg BW for the high dose (2%); 269.5 mg/kg BW for moderate dose (0.2%) and 27.9 mg/kg BW for the low dose (0.02%). When equations utilizing body surface area are used to determine the human equivalent (for 60 kg reference man) for each of these doses (compared to a 20 g mouse), it was calculated that 136 mg/day of quercetin would be needed to replicate the 0.02% dose; 1311 mg/day to equal the 0.2% dose; and 14108 mg/day to reproduce the 2% dose.Citation27
Body weight
Body weight was measured weekly throughout the treatment period (4-20 weeks of age), prior to sacrifice, and after the removal of all tumors. Over time, body weight was comparable across all groups with no differences detected at any point (). Similarly, body weights measured at sacrifice after the total tumor weight had been removed showed no significant differences between the groups (). DEXA measurements of body fat, percent body fat, lean mass and percent lean mass were also not different between the treatment groups at 4 wks, 12 wks and 16 wks of age ().
Table 1. Body composition was not altered by quercetin treatment in C3(1)/SV40Tag mice. All mice underwent a DEXA scan prior to treatment initiation(4 weeks), and at 12 and 16 weeks of age. No significant differences were detected between groups at each time point, P < 0.05 Values are means ± SEM
Figure 1. Body weight was not influenced by quercetin treatment or mammary tumor development. Body weight was measured weekly (A) and at sacrifice following the removal of all mammary tumors (B). Values are means ± SEM. No differences were detected between groups, (P < 0.05).
Spleen weight
Spleen weight was recorded at sacrifice as it has previously been correlated with tumor burden.Citation28 Accordingly, spleen weight was significantly elevated in C3-Con mice compared to wild type FVB mice. A strong trend was also detected for elevated spleen weight in C3-0.02% mice versus the FVB group (p = 0.06). Conversely, no significant difference was detected between C3-2% or C3-0.2% and FVB mice. A trend existed for a reduction in spleen weight with 0.2% quercetin treatment compared to C3-Con, (p = 0.08) (FVB: 99.8 ± 5.1; C3-Con: 172.3 ± 34.1 mg; C3-2%: 139.6 ± 7.9 mg; C3-0.2%:112.8 ± 4.5 mg; C3-0.02%:155.7 ± 20.4 mg). When spleen weight was expressed as a percentage of total body weight results remained similar as spleen weight was elevated in C3-Con and C3-0.02% mice compared with the FVB control group (P < 0.05) (FVB:0.44 ± 0.01%; C3-Con:0.69 ± 0.10%; C3-2%: 0.60 ± 0.03%; C3-0.2%:0.51 ± 0.02%; C3-0.02%: 0.65 ± 0.07%). In agreement with previous reports, absolute spleen weight was highly correlated with tumor volume (R = 0.79) and tumor weight (R = 0.78) at sacrifice in the C3(1)/SV40Tag mice (P < 0.001) (data not shown).
Complete blood count
A complete blood profile was assessed immediately following sacrifice using whole blood. Of the cell types measured, white blood cells and lymphocytes showed no differences between treatment groups (). Monocytes, the precursor cells of macrophages, were significantly elevated in C3-Con mice compared to FVB and C3(1)-0.2% mice (P<0.05), and trended to be higher than both C3-2% and C3-0.02% mice (p = 0.06 and p = 0.05). Neutrophils were also significantly elevated in C3-Con mice compared to FVB mice (P < 0.05), but no significant differences existed between any of the quercetin treatment groups and FVB mice. Breast cancer in the C3(1)/SV40Tag mouse model was not associated with any changes in red blood cells, hemoglobin, or hematocrit compared with wild type FVB mice.
Table 2. Complete blood counts in wild type FVB and C3(1)/SV40Tag mice after quercetin treatment. Whole blood was analyzed immediately following sacrifice for determination of a complete blood count using the Vetscan blood analyzer. WBC: White blood cells; Lym: Lymphocytes; Mon: Monocytes; Neu: Neutrophils; RBC: Red blood cells; Hb: Hemoglobin; Hct: Hematocrit. Values are mean ± SEM. ^significantly different from FVB; *significantly different from C3(1)-Con; P < 0.05
Dose-dependent effect of quercetin on tumorigenesis in C3(1)/SV40Tag mice
Beginning at 10 weeks of age, all C3(1)/SV40Tag mice were palpated twice a week for tumors, and tumor number and volume were recorded. Quercetin treatment, at any dose, did not influence the average time (days) to the appearance of the first palpable tumor (). However, C3(1)/SV40Tag mice develop multiple tumors over their lifetime and differences were detected in the development of additional carcinomas as there was a significant main effect of quercetin treatment, weeks of age, and their interaction on the average number of palpable tumors (). At sacrifice, the 0.2% quercetin dose had fewer tumors than C3-Con mice () and from 18 weeks of age through sacrifice at 20 weeks of age, tumor number was significantly elevated in the 2% quercetin mice compared to all of the other C3(1)/SV40Tag groups (Con, 0.2% and 0.02%) (P < 0.05).
Table 3. Tumor latency and tumor characteristics at sacrifice (20 wks) in C3(1)/SV40Tag mice. Time (from birth) to the development of the first palpable tumor was calculated (days) following twice weekly measurements initiated at 10 weeks of age. At sacrifice all tumors were removed, counted and measured. Tumor volume was calculated using the formula 0.52 x (largest diameter) x (smallest diameter)2 and is expressed as mm3 Values are means ± SEM. *significantly different from control; #significantly different from 2%; ^significantly different from 0.2%; and significantly different from 0.02%; (P < 0.05)
Figure 2. Quercetin reduced tumor number and volume in a dose-dependent manner in C3(1)/SV40Tag mice. C3(1)/SV40Tag mice were palpated twice a week for detection and measurement of tumor number (A) and tumor volume (B). Values are means ± SEM. *significantly different from C3-Con; #significantly different from C3-2%; ^significantly different from C3-0.2%; and significantly different from C3-0.02%; P < 0.05.
Tumor volume was also significantly changed over time (weeks of age) along with a significant interaction of treatment and time in C3(1)/SV40Tag mice. From 18.5 weeks of age through sacrifice at 20 weeks, 0.2% quercetin decreased tumor volume vs C3-Con mice (P < 0.05) (). The 2% quercetin dose also reduced tumor volume compared with the control group at 19.5, 20 weeks of age and sacrifice (P < 0.05), while C3-0.02% was only different from C3-Con mice at 19.5 weeks. Dose-dependent effects of quercetin on tumor volume also existed; from 19.5 weeks through sacrifice C3-0.2% mice had lower tumor volume than C3-0.02% (P < 0.05). Additionally, tumor volume was reduced by the 0.2% quercetin dose at 20 weeks, and at sacrifice, compared to the 2% dose (P < 0.05). Tumor weight was also lowest in the C3-0.2% quercetin mice at sacrifice; however, no statistically significant differences were detected between the groups ().
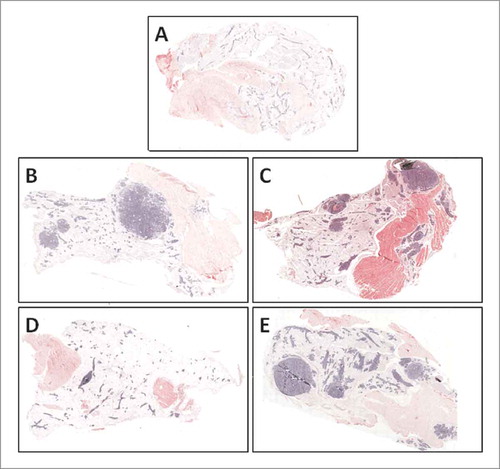
Histological examination confirmed the presence of more advanced lesions throughout the mammary gland of C3-Con, C3-2% and C3-0.02% mice compared to C3-0.2% mice (). C3-0.2% exhibited fewer invasive lesions and glandular tissue appeared more similar to that of the FVB/N control mice.
Figure 3. Mammary lesion and tumor development was minimized by 0.2% quercetin in the thoracic mammary gland of C3(1)/SV40Tag mice. Thoracic mammary glands were fixed in formalin, embedded and then sectioned for H&E staining. Images were capture using the DAKO Chromavision Systems ACIS 3 system (20× magnification). Glands from FVB/N mice (A), C3-Con (B), C3-2% (C), C3(1)-0.2% (D) and C3(1)-0.02% (E) treated mice are presented. Large areas of invasive carcinoma as well as advanced lesion formation appear blue in these sections.
Differential regulation of several genes by 0.2% quercetin in the mammary gland tissue of C3(1)/SV40Tag mice
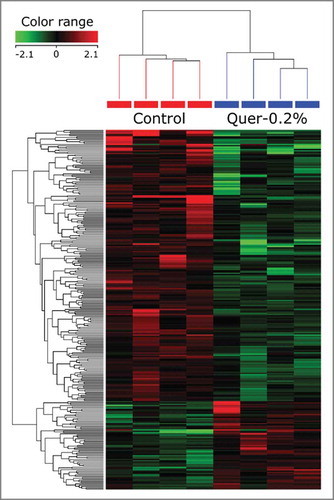
The present findings indicate that the moderate 0.2% dose of quercetin most effectively reduced tumor number and volume. Therefore, mammary gland tissue of 4 representative samples from each C3(1)/SV40Tag group (Con and 0.2% quercetin) were processed for DNA Microarray gene expression analysis. With a 1.5-fold change serving as the initial cut-off point, analysis revealed that 344 genes were significantly modulated (P < 0.05) by quercetin in C3(1)/SV40Tag mice; 275 were downregulated and 69 were upregulated by quercetin. When we increased the criteria to include a 2-fold or greater change (P-value < 0.05) only 31 genes were down-regulated (), and 9 genes were up-regulated () in response to quercetin treatment (). The genes most significantly down regulated by quercetin treatment included Greb1, Ngfr, Gbp8, Fabp7 and Ptpn5. In contrast, only 2 genes, Slc22a2 and Cox7a1, were up regulated more than 3-fold, while other genes including Timp4, Deptor and Flt1 were >2 fold higher in the quercetin treated group. The analysis of potential pathways modulated by quercetin resulted in the identification of 33 pathways altered following a 0.2% quercetin diet in C3(1)/SV40Tag mice (). Several of those affected have immune modularly and growth regulatory actions in relation to potential carcinogenic events.
Table 4. Genes downregulated by quercetin in the mammary gland of C3(1)/SV40Tag mice. Microarray gene expression analysis was performed on mammary gland tissue from control C3(1)/SV40Tag and 0.2% quercetin C3(1)/SV40Tag mice (n = 4 per group). Genes that were significantly decreased more than 2 fold following quercetin treatment are listed
Table 5. Genes upregulated by quercetin in mammary gland of C3/(1)SV40Tag mice. Microarray gene expression analysis was performed on mammary gland tissue from control C3(1)/SV40Tag and 0.2% quercetin C3(1)/SV40Tag mice (n = 4 per group). Genes found to be significantly increased by 2 fold or more by quercetin treatment are listed
Table 6. Pathways significantly modulated by quercetin in the mammary gland of C3(1)/SV40Tag mice. Following gene microarray analysis of mammary tissue from Control and 0.2% quercetin treated C3(1)/SV40Tag mice (n = 4/group), pathway analysis was performed in GeneSpring GX using Reactome, KEGG, BioCarta and NCI-Nature Curated pathway databases. All pathways found to be significantly (P < 0.05) modulated by quercetin treatment compared to control are listed
Figure 4. Visual representation of genes differentially modulated by quercetin treatment in the mammary glands of C3(1)/SV40Tag mice. A DNA microarray was conducted on C3-Con and C3-0.2% mammary gland samples (n = 4/gr) and the results are presented. The first 4 lanes (red) correspond to C3(1)/SV40Tag control mice and the last 4 to C3(1)/SV40Tag mice treated with 0.2% quercetin for 16 weeks.
Conformational RT-PCR was performed for a subset of genes identified by the microarray. Similar to the changes reported for the microarray, the mRNA expression of FABP7 (30%), Greb1 (52%), Muc13 (61%), and Tmprss4 (29%) were all significantly decreased in the mammary gland of mice receiving the 0.2% quercetin diet compared to the control mice ().
Figure 5. Quercetin reduces the mRNA expression of genes identified in the tissue microarray in C3(1)/SV40Tag mice. Mammary gland tissue was collected from control (C3-Con; n = 14) and 0.2% quercetin (C3-0.2%;n = 16) treated mice and RT-PCR was performed. Values are means ± SEM. *significantly different from C3-Con, (P < 0.05).
Discussion
Evidence suggests a relationship between increased consumption of fruits and vegetables and a reduced risk of breast cancer which is thought to be due, at least in part, to their high content of flavonoids and other bioactive compounds, including quercetin.Citation1-Citation7 Several in vitro and considerably fewer in vivo investigations have shown benefits of quercetin on both hormonal responsive and unresponsive breast cancer. However, negative findings also exist largely due to the fact that an effective dose of quercetin needed to elicit an anti-neoplastic response has yet to be identified.Citation10,Citation14-Citation18, Citation21,29 This is the first report of a clear dose-dependent response to quercetin with regard to tumorigenesis in a genetically engineered mouse model of breast cancer. In contrast to our original hypothesis, the moderate dose of quercetin (0.2%) incorporated into the diet most effectively inhibited tumor growth and multiplicity compared with the higher (2%) and lower (0.02%) doses.
Relatively few investigations have examined the effects of quercetin in animal models of breast cancer and of those that do doses, treatment regimens, animal models and observed outcomes have varied widely.Citation18,Citation21-Citation23, Citation29,30 In 2 different chemically-induced rat models of breast cancer, doses of 2% and 5% quercetin reduced tumor development, incidence and multiplicity, with the 5% dose having the greatest influence.Citation21 Mouse xenograft models using hormonal-independent breast cancer cells have also shown benefits of quercetin on survival and apoptosis.Citation23,30 In contrast, estrogen-induced breast cancer (E2+cholesterol via slow release subcutaneous pellets) in ACI rats was more prevalent, although not statistically, following the addition of 2.5 g/kg quercetin to a phytoestrogen-free diet (equivalent to 0.25% quercetin in the diet). Citation29 Evidently, the hormonal status of the model system is an important factor in the efficacy of quercetin, as the same dose of quercetin (0.2%) was most beneficial in our progressively estrogen independent C3(1)/SV40Tag mouse model.Citation31 Additionally, phenotypic characteristics of the model system may influence measures most affected by the treatment; in the C3(1)/SV40Tag mouse, tumors develop with 100% incidence, which may explain the more pronounced change in tumor volume than tumor number observed with 0.2% quercetin treatment.Citation25 Lastly, the dose of quercetin administered is also an important factor in determining the effects of the flavonoid on mammary tumorigenesis. In the C3(1)/SV40Tag mouse, we observed minimal effects of quercetin at the 2% and 0.02% dose. This was in contrast to previous investigations that cite benefits on tumorigenesis at these and/or higher and lower doses; however at this time reasons for this discrepancy are unclear.Citation18,21,29,30
Dose-response investigations are imperative for maximizing the therapeutic potential of an agent within a given disease model. In the current study, the finding that the greatest benefits on tumorigenesis were associated with the moderate (0.2%) dose of quercetin provides unexpected but important evidence of an inverted U-shaped response to quercetin treatment. We do not believe that toxicity at the higher dosage caused the increase in tumor number and smaller reduction in tumor volume as no other signs or symptoms were identifiable. A non-linear dose-dependent effect of quercetin was also observed in vitro in MDA-MB-231 breast cancer cells; 0.5 μM quercetin increased cell proliferation whereas 5 and 20 μM decreased proliferation.Citation18 In the corresponding mouse xenograft model, a moderate dose of 5 mg/kg/day of the combination of quercetin, resveratrol and catechin most effectively reduced tumor growth compared to the lower 0.5 or higher 25 mg/kg/day doses.Citation18 Similar hormetic responses to treatment with other phytochemicals in several disease models has also been reported.Citation32 Lastly, discrepancies between in vitro and in vivo models may also account for dissimilar outcomes regarding the efficacy of quercetin dose. For example, quercetin administered in vitro at high levels has been shown to promote negative pro-oxidant effects not supported by in vivo investigations.Citation33 Therefore, the hormetic response to quercetin merits further investigation to elucidate potential mechanisms related to this effect, as this knowledge will be critically important to the design of future therapeutic treatment regimes. Further, while bioavailability studies were not performed in the present investigation, these data highlight the importance of pharmacokinetic experiments to provide insight on optimal dosing in humans.
As a first step toward elucidating the multifocal actions of quercetin, we performed a comprehensive unbiased search of potential genes whose expression was altered by quercetin treatment. Results of the DNA microarray gene expression analysis confirmed that quercetin had widespread anti-carcinogenic actions as well as distinguished several previously unidentified genes specifically in the mammary glands of C3(1)/SV40Tag mice. For example, Mucin 13 (Muc13) of the Mucin protein family, which was down-regulated ∼3 fold by quercetin, has only previously been implicated in colon, gastric, and ovarian cancers, with little evidence supporting its aberrant expression in breast cancer. Citation34-Citation38 Further, the significance of the down-regulation of expression of both keratin 6A (krt6a) and keratin 6B (krt6b) by quercetin remains to be determined as little evidence exists characterizing the role of these specific keratin isoforms in mammary gland malignancy in contrast to keratin5/6 which is commonly used in the classification of ‘basal like’ breast cancer and is associated with poor prognosis.Citation39,40
Other genes down-regulated by quercetin including nerve growth factor receptor (NGFR), transmembrane protease, serine 4 (TMPRSS4) and fatty acid binding protein -7 (FABP7) have previously been measured in mammary tumor samples; however, the significance of this suppression by quercetin remains unknown with the exception of TMPRSS4, whose elevated expression in breast cancer is associated with poor prognosis.Citation41-Citation46 Although both NGFR and FABP7 have been shown to be either overexpressed in breast cancer tissues or important to its in vitro growth,Citation46,47 separate reports of improved patient outcome in relation to their expression in mammary carcinomas or decreased breast tumor cell proliferation also exist.Citation48,49 It appears that breast cancer subtype, as defined by expression patterns within triple negative and basal-like carcinomas, may be responsible for these discordant findings which vary greatly and lead to differing prognoses.Citation39,50 Therefore, the prognostic significance in relation to the effects of quercetin on these genes are likely to be context dependent.
Carcinomas in C3(1)/SV40Tag mice are initially ERα responsive, but may progress to ERα unresponsive, paralleling the molecular events observed in women after Tamoxifen treatment.Citation31,51,52 GREB1 expression, which is stimulated by estrogen and correlated with ERα expression in breast cancer,Citation53 promotes the in vitro growth of ER (+) cells and is expressed at much higher levels in patients with ER (+) carcinomas than ER (−).Citation54-Citation56 Therefore, the quercetin-induced decrease (4-fold) in the mRNA expression of growth regulation by estrogen in breast cancer (GREB1) is likely a prominent factor in the reduction in tumorigenesis observed presently. Previous investigations in C3(1)/SV40Tag mice show that knocking out ERα prevents tumor formation while estrogen treatment (which would presumably increase GREB1) increases tumor growth.Citation54 Therefore, the quercetin-induced decrease in its expression is promising in the treatment of ER (+) mammary cancers, although this effect will need to be confirmed in human tissues in the future.
Quercetin treatment upregulated substantially fewer genes within the mammary gland as only 9 showed more than a 2-fold change. Of these genes, the increased expression of DEP domain containing mTOR-interacting protein (DEPTOR) is noteworthy as its activation has inhibitory actions toward mTOR, whose dysregulation in cancer has prompted the clinical testing of mTOR inhibitors for the treatment of various types of breast cancer.Citation57 In corroboration with this finding, quercetin-mediated inhibition of mTOR signaling in cancer has been reported and is an important anti-carcinogenic action of this flavonoid.Citation57 Equally promising is the increase in the expression of the tissue inhibitor of metalloproteinases-4 (TIMP4) by quercetin, as both in vitro and in vivo overexpression of TIMP4 has been shown to inhibit cell invasion and tumor growth.Citation58
Overall, quercetin significantly modulated the expression of a number of genes that have either already been implicated in breast cancer or have a potential to be targets for future investigations. While a direct link between modulation of each of these genes and tumorigenesis is not possible from these data, it is likely that the reduction in tumor growth resulted from the wide spread anti-carcinogenic actions of quercetin displayed by the microarray analysis presented herein. In conclusion, this work describes a dose-dependent reduction in mammary tumorigenesis following quercetin supplementation in the C3(1)/SV40Tag mouse model; however, additional experiments should focus on identifying the important role of several of the novel genes identified in order to further develop therapeutic interventions.
Methods
Animals
Female FVB/N mice were purchased from Harlan Sprague-Dawley Laboratories and bred with male heterozygous C3(1)/SV40Tag mice (a gift from Dr. Jeffrey Green, Chief, Transgenic Oncogenesis and Genomics Section, Laboratory of Cancer Biology and Genetics, National Cancer Institute) in the animal research facility at the University of South Carolina. Female offspring were genotyped by tail snips at 3 wks old. Mice were maintained on a 12:12 h light-dark cycle in a low-stress environment (22°C, 50% humidity and low noise) and provided with food and water ad libitum. All animal experimentation was approved by the University of South Carolina's Institutional Animal Care and Use Committee.
Treatment
Following weaning at 4 wks of age, C3(1)/SV40Tag mice on an FVB/N background were randomized to one of the 4 treatments groups; placebo control, 2% quercetin, 0.2% quercetin or 0.02% quercetin based on body weight and litter (C3-Con: n = 15; C3-2%: n = 16; C3-0.2%: n = 16; C3-0.02%: n = 17). An additional FVB/N wild type group of female mice was also included as cancer-free controls. All control groups were fed a basal diet of AIN-76A (Bio-Serv), while quercetin treated groups were fed the AIN-76A diet with the specific dose of quercetin incorporated into the food pellets (Cat. # F1515, Bio-Serv). Mice received their respective treatment diet from 4-20 weeks of age.
Quercetin dosages
The lowest 0.02% dose of quercetin was selected based upon previous investigations performed by our laboratory showing that this dose decreased colon polyp multiplicity and improved mitochondrial properties in muscle and brain.Citation59,60 The highest dose of quercetin (2%) was chosen based on early work by Verma et al., (1988) which showed that in the DMBA rat model of breast cancer treatment with 2% quercetin decreased tumor development, incidence and multiplicity.Citation21 Finally, the 0.2% dose was chosen as a median dose corresponding to a 10-fold separation between the other 2 doses. For a 25 g mouse consuming 5 g of food per day, the 0.02% dose of quercetin would correspond to a dose of 1 mg or 40 mg/kg body weight (BW), the 0.2% to a dose of 10 mg or 400 mg/kg BW and the 2% to a dose of 100 mg or 4000 mg/kg. This dosage scheme represents physiologically relevant doses ranging from what is achievable through careful dietary planning to an upper level of supplementation or treatment.
Body weight, body composition and food intake
Body weight and food intake was measured weekly throughout the treatment period. C3(1)/SV40Tag mice develop large mammary tumors that account for a substantial percentage of the animal's total body weight. Therefore, final body weight after the removal of all tumors is also reported as a more accurate measure of the animal's mass. In order to assess any differences in body composition resulting from the treatment, body composition analysis was performed on the Lunar PIXImus X-ray densitometer (DEXA) for small animals. Animals were lightly anesthetized throughout the procedure (∼3 min/ scan) via isoflurane inhalation (1-2%) using a nose cone. Body composition was measured at 4, 12 and 16 weeks of age. The 12 and 16 week time points were chosen because animals had minimal palpable tumor development at these times. Mammary tumors in the C3(1)/SV40Tag mouse can vary in composition and therefore could have skewed the compositional data if performed at a later time point.
Tumor progression
Beginning at 10 weeks of age, all C3(1)/SV40Tag mice were examined twice a week for palpable tumors by the same investigator. C3(1)/SV40Tag mice typically develop palpable mammary tumors between 12 and 16 weeks of age.Citation25,61 Upon palpation of a tumor, calipers were used to measure the longest and shortest diameter of the tumor. The number of tumors within each mouse was recorded and the tumor volume was estimated for each tumor using the formula: 0.52 × (largest diameter) x (smallest diameter) Citation 2 as previously described.Citation62 The total tumor volume within each animal was then averaged within each treatment group.
Sacrifice and tissue collection
At 20 weeks of age, all mice were sacrificed via isoflurane inhalation. Blood was collected at sacrifice from the inferior vena cava. A 50 μl sample of whole blood was immediately analyzed using a Vetscan blood analyzer (Abaxis, Union City, CA). Visible tumors were dissected from all 10 mammary glands and measured to determine tumor weight and tumor volume as described above. All remaining thoracic mammary gland tissue was then removed from both the right and left side. This tissue was either snap frozen in liquid nitrogen for gene expression analysis or fixed in 10% neutral buffered formalin (Cat. #SF100-20, Fisher Scientific) for histopathological analysis. Spleen weight was also recorded as it has been positively associated with tumorigenesis.Citation28
mRNA isolation, labeling and hybridization
For isolation of RNA, thoracic mammary glands were homogenized under liquid nitrogen using TRIzol reagent (Cat. #15596-018, Life Technologies). RNA quantity was assessed using an Agilent 2100 Bioanalyzer and RNA Integrity Numbers (RIN) ranged from 8.5 to 9.3. Microarray experiments were performed using reagents and slides from Agilent Technologies. Total RNA samples were amplified and labeled using Agilent's Low Input Quick Amp Labeling Kit (Cat. # 5190-2306) according to the manufacturer's recommendations. Briefly, mRNA (from 200 ng of total RNA) was converted into cDNA using a poly-dT primer that also contained the T7 RNA polymerase promoter sequence. Subsequently, T7 RNA polymerase was added to cDNA samples to amplify the cDNA and to simultaneously incorporate cyanine 3- or cyanine 5-labeled CTP (cRNA) into the amplification products. In addition, Agilent RNA spike-in controls (Cat. # 5188-5279) were added to samples prior to cDNA synthesis. Dye-labeled RNA was purified using Qiagen's RNeasy Mini Kit (Cat. # 74104). After spectrophotometric assessment of dye incorporation and cRNA yield, samples were stored at −80°C until hybridization. Labeled cRNA samples were hybridized to SurePrint G3 Mouse GE 8 × 60 K Microarrays (Cat. # G4858A-028005) at 65°C for 17 h using Agilent's Gene Expression Hybridization Kit (Cat. # 5188-5242) according to the manufacturer's recommendations. Four representative mammary gland samples from control and 0.2% quercetin treated C3(1)/SV40Tag mice were hybridized in a 2-color experimental design with dye swap. After washes, arrays were scanned using an Agilent DNA Microarray Scanner System (Cat. # G2565CA).
Data were extracted from images with Feature Extractor Software version 10.7.3.1 (Agilent). In this process, background correction using detrending algorithms was performed. In addition, linear and LOWESS methods were used for dye normalization. Subsequently, background-corrected, dye-normalized data were uploaded into GeneSpring GX version 11.5.1 for analysis. Data were log2 transformed, quantile normalized and baseline transformed using the median of all samples. Then, data were filtered by flags in a way that 3 out of the 4 biological replicates had a “detected” flag in at least one of the 2 treatment groups. Differentially expressed genes were determined by analysis of the data using the Mann-Whitney unpaired statistical tests. A cutoff p-value of 0.05 and a fold change cutoff value of 2.0 were used to filter the data. Pathway analysis was performed in GeneSpring GX using Reactome, KEGG, BioCarta and NCI-Nature Curated pathway databases.
mRNA analysis
In order to confirm changes in a subset of genes identified by the microarray we performed RT-PCR on the mammary gland tissue of control (n = 14) and 0.2% quercetin (n = 16) treated mice. RNA was reverse transcribed into cDNA and quantitative RT-PCR was carried out as per the manufacturer's instructions (Applied Biosystems, Foster City, CA) using TaqMan Gene Expression Assays (Life Technologies, Carlsbad, CA) as previously described.Citation63 Conditions utilized for RT-PCR were as follows: 2 min at 50°C; 10 min at 95°C; and 40 repetitions of 15 seconds at 95°C followed by 1 min at 60°C. Genes measured included Fabp7 (Mm00445226_g1), Greb1 (Mm00479269_m1), Muc13 (Mm00495397_m1), Tmprss4 (Mm00520486_m1) and 18 S (Mn03928990_g1) as the reference gene. Quantification of mRNA expression of all target genes was calculated using the 2ΔΔCT method, which employs a single calibrator sample to compare every unknown sample's gene expression against. Briefly, ΔCT [CT (FAM) - CT (VIC)] was calculated for each sample and the average ΔCT of the control mice was used as the calibrator sample. ΔΔCT [ΔCT (calibrator) - ΔCT (sample)] was then determined for each sample and the relative quantification was calculated as 2ΔΔCT.
Histopathology
Mammary gland sections were processed for histopathological examination. Formalin-fixed, paraffin-embedded sections were deparaffinized in xylenes and rehydrated in graded alcohol washes. H&E staining was then performed. Imaging was performed using the DAKO Chromavision Systems ACIS 3 system.
Statistical analysis
All data, except the microarray analysis data which was described above, was analyzed using commercial statistical software (SigmaStat, SPSS, Chicago, IL). Weekly tumor data, body weight, food consumption and water intake were analyzed using a repeated measures 2-way ANOVA (time x dependent variable) with Student-Newman-Keuls post-hoc testing when appropriate. Analysis of relationships between outcome measures and tumor volume and number was completed using Pearson product moment correlations. Students’ t-tests (type 2, 2-tailed) were used to determine the differences between control and 0.2% quercetin mice for the mRNA expression of mammary gland genes confirmed via RT-PCR. All other analyses were completed using a one-way ANOVA with Student-Newman-Keuls post-hoc testing when appropriate. Statistical significance was set at an alpha value of P < 0.05. Data are presented as mean ± SEM.
Disclosure of Potential Conflicts of Interest
No potential conflicts of interest were declared.
Funding
This work was supported by grants from the National Institutes of Health (P20GM103641 and K01AT007824).
References
- Freudenheim JL, Marshall JR, Vena JE, Laughlin R, Brasure JR, Swanson MK, et al. Premenopausal breast cancer risk and intake of vegetables, fruits, and related nutrients. J Natl Cancer Inst 1996; 88:340-8; PMID:8609642; http://dx.doi.org/10.1093/jnci/88.6.340
- La Vecchia C, Decarli A, Franceschi S, Gentile A, Negri E, Parazzini F. Dietary factors and the risk of breast cancer. Nutr Cancer 1987; 10:205-14; PMID:2829140; http://dx.doi.org/10.1080/01635588709513958
- Iscovich JM, Iscovich RB, Howe G, Shiboski S, Kaldor JM. A case-control study of diet and breast cancer in Argentina. Int J Cancer 1989; 44:770-6; PMID:2583858; http://dx.doi.org/10.1002/ijc.2910440504
- Pawlega J. Breast cancer and smoking, vodka drinking and dietary habits. A case-control study. Acta Oncol 1992; 31:387-92; PMID:1632971; http://dx.doi.org/10.3109/02841869209088276
- Butler LM, Wu AH, Wang R, Koh WP, Yuan JM, Yu MC. A vegetable-fruit-soy dietary pattern protects against breast cancer among postmenopausal Singapore Chinese women. Am J Clin Nutr 2010; 91:1013-9; PMID:20181808; http://dx.doi.org/10.3945/ajcn.2009.28572
- Sangrajrang S, Chaiwerawattana A, Ploysawang P, Nooklang K, Jamsri P, Somharnwong S. Obesity, diet and physical inactivity and risk of breast cancer in Thai women. Asian Pac J Cancer Prev 2013; 14:7023-7; PMID:24377643; http://dx.doi.org/10.7314/APJCP.2013.14.11.7023
- Kruk J. Association between Vegetable, Fruit and Carbohydrate Intake and Breast Cancer Risk in Relation to Physical Activity. Asian Pac J Cancer Prev 2014; 15:4429-36; PMID:24969864; http://dx.doi.org/10.7314/APJCP.2014.15.2.561
- Gibellini L, Pinti M, Nasi M, Montagna JP, De Biasi S, Roat E, Bertoncelli L, Cooper EL, Cossarizza A. Quercetin and cancer chemoprevention. Evid Based Complement Alternat Med 2011; 2011:591356; PMID:21792362; http://dx.doi.org/10.1093/ecam/neq053
- Kobori M, Masumoto S, Akimoto Y, Oike H. Chronic dietary intake of quercetin alleviates hepatic fat accumulation associated with consumption of a Western-style diet in C57BL6J mice. Mol Nutr Food Res 2011; 55:530-40; PMID:21462320; http://dx.doi.org/10.1002/mnfr.201000392
- Brusselmans K, Vrolix R, Verhoeven G, Swinnen JV. Induction of cancer cell apoptosis by flavonoids is associated with their ability to inhibit fatty acid synthase activity. Journal of Biological Chemistry 2005; 280:5636-45; PMID:15533929; http://dx.doi.org/10.1074/jbc.M408177200
- Kandaswami C, Lee LT, Lee PP, Hwang JJ, Ke FC, Huang YT, Lee MT. The antitumor activities of flavonoids. In Vivo 2005; 19:895-909; PMID:16097445
- Avila MA, Velasco JA, Cansado J, Notario V. Quercetin mediates the down-regulation of mutant p53 in the human breast cancer cell line MDA-MB468. Cancer Res 1994; 54:2424-8; PMID:8162591
- Choi EJ, Bae SM, Ahn WS. Antiproliferative effects of quercetin through cell cycle arrest and apoptosis in human breast cancer MDA-MB-453 cells. Arch Pharm Res 2008; 31:1281-5; PMID:18958418; http://dx.doi.org/10.1007/s12272-001-2107-0
- Balabhadrapathruni S, Thomas TJ, Yurkow EJ, Amenta PS, Thomas T. Effects of genistein and structurally related phytoestrogens on cell cycle kinetics and apoptosis in MDA-MB-468 human breast cancer cells. Oncol Rep 2000; 7:3-12; PMID:10601582
- Conklin CM, Bechberger JF, MacFabe D, Guthrie N, Kurowska EM, Naus CC. Genistein and quercetin increase connexin43 and suppress growth of breast cancer cells. Carcinogenesis 2007; 28:93-100; PMID:16777995; http://dx.doi.org/10.1093/carcin/bgl106
- Chien SY, Wu YC, Chung JG, Yang JS, Lu HF, Tsou MF, Wood WG, Kuo SJ, Chen DR. Quercetin-induced apoptosis acts through mitochondrial- and caspase-3-dependent pathways in human breast cancer MDA-MB-231 cells. Hum Exp Toxicol 2009; 28:493-503; PMID:19755441; http://dx.doi.org/10.1177/0960327109107002
- Seo HS, Ju JH, Jang K, Shin I. Induction of apoptotic cell death by phytoestrogens by up-regulating the levels of phospho-p53 and p21 in normal and malignant estrogen receptor alpha-negative breast cells. Nutr Res 2011; 31:139-46; PMID:21419318; http://dx.doi.org/10.1016/j.nutres.2011.01.011
- Schlachterman A, Valle F, Wall KM, Azios NG, Castillo L, Morell L, Washington AV, Cubano LA, Dharmawardhane SF. Combined resveratrol, quercetin, and catechin treatment reduces breast tumor growth in a nude mouse model. Transl Oncol 2008; 1:19-27; PMID:18607509; http://dx.doi.org/10.1593/tlo.07100
- So FV, Guthrie N, Chambers AF, Moussa M, Carroll KK. Inhibition of human breast cancer cell proliferation and delay of mammary tumorigenesis by flavonoids and citrus juices. Nutr Cancer 1996; 26:167-81; PMID:8875554; http://dx.doi.org/10.1080/01635589609514473
- Staedler D, Idrizi E, Kenzaoui BH, Juillerat-Jeanneret L. Drug combinations with quercetin: doxorubicin plus quercetin in human breast cancer cells. Cancer Chemother Pharmacol 2011; 68(5).
- Verma AK, Johnson JA, Gould MN, Tanner MA. Inhibition of 7,12-dimethylbenz(a)anthracene- and N-nitrosomethylurea-induced rat mammary cancer by dietary flavonol quercetin. Cancer Res 1988; 48:5754-8; PMID:3139283
- Zhong X, Wu K, He S, Ma S, Kong L. [Effects of quercetin on the proliferation and apoptosis in transplantation tumor of breast cancer in nude mice]. Sichuan Da Xue Xue Bao Yi Xue Ban 2003; 34:439-42; PMID:12910683
- Dechsupa S, Kothan S, Vergote J, Leger G, Martineau A, Berangeo S, Kosanlavit R, Moretti JL, Mankhetkorn S. Quercetin, Siamois 1 and Siamois 2 induce apoptosis in human breast cancer MDA-mB-435 cells xenograft in vivo. Cancer Biol Ther 2007; 6:56-61; PMID:17172819; http://dx.doi.org/10.4161/cbt.6.1.3548
- Du G, Lin H, Yang Y, Zhang S, Wu X, Wang M, Ji L, Lu L, Yu L, Han G. Dietary quercetin combining intratumoral doxorubicin injection synergistically induces rejection of established breast cancer in mice. Int Immunopharmacol 2010; 10:819-26; PMID:20447470; http://dx.doi.org/10.1016/j.intimp.2010.04.018
- Green JE, Shibata MA, Yoshidome K, Liu ML, Jorcyk C, Anver MR, Wigginton J, Wiltrout R, Shibata E, Kaczmarczyk S, et al. The C3(1)SV40 T-antigen transgenic mouse model of mammary cancer: ductal epithelial cell targeting with multistage progression to carcinoma. Oncogene 2000; 19:1020-7; PMID:10713685; http://dx.doi.org/10.1038/sj.onc.1203280
- Maroulakou IG, Anver M, Garrett L, Green JE. Prostate and mammary adenocarcinoma in transgenic mice carrying a rat C3(1) simian virus 40 large tumor antigen fusion gene. Proc Natl Acad Sci U S A 1994; 91:11236-40; PMID:7972041; http://dx.doi.org/10.1073/pnas.91.23.11236
- Reagan-Shaw S, Nihal M, Ahmad N. Dose translation from animal to human studies revisited. FASEB J 2008; 22:659-61; PMID:17942826; http://dx.doi.org/10.1096/fj.07-9574LSF
- Murphy EA, Davis JM, Barrilleaux TL, McClellan JL, Steiner JL, Carmichael MD, Pena MM, Hebert JR, Green JE. Benefits of exercise training on breast cancer progression and inflammation in C3(1)SV40Tag mice. Cytokine 2011; 55:274-9; PMID:21600785; http://dx.doi.org/10.1016/j.cyto.2011.04.007
- Singh B, Mense SM, Bhat NK, Putty S, Guthiel WA, Remotti F, Bhat HK. Dietary quercetin exacerbates the development of estrogen-induced breast tumors in female ACI rats. Toxicol Appl Pharmacol 2010; 247:83-90; PMID:20600213; http://dx.doi.org/10.1016/j.taap.2010.06.011
- Wong MY, Chiu GN. Liposome formulation of co-encapsulated vincristine and quercetin enhanced antitumor activity in a trastuzumab-insensitive breast tumor xenograft model. Nanomedicine 2011; 7(6).
- Yoshidome K, Shibata MA, Couldrey C, Korach KS, Green JE. Estrogen promotes mammary tumor development in C3(1)SV40 large T-antigen transgenic mice: paradoxical loss of estrogen receptoralpha expression during tumor progression. Cancer Res 2000; 60:6901-10; PMID:11156389
- Son TG, Camandola S, Mattson MP. Hormetic dietary phytochemicals. Neuromolecular Med 2008; 10:236-46; PMID:18543123; http://dx.doi.org/10.1007/s12017-008-8037-y
- Metodiewa D, Jaiswal AK, Cenas N, Dickancaité E, Segura-Aguilar J. Quercetin may act as a cytotoxic prooxidant after its metabolic activation to semiquinone and quinoidal product. Free Radic Biol Med 1999; 26:107-16; PMID:9890646; http://dx.doi.org/10.1016/S0891-5849(98)00167-1
- Maher DM, Gupta BK, Nagata S, Jaggi M, Chauhan SC. Mucin 13: structure, function, and potential roles in cancer pathogenesis. Mol Cancer Res 2011; 9:531-7; PMID:21450906; http://dx.doi.org/10.1158/1541-7786.MCR-10-0443
- Chauhan SC, Vannatta K, Ebeling MC, Vinayek N, Watanabe A, Pandey KK, Bell MC, Koch MD, Aburatani H, Lio Y, et al. Expression and functions of transmembrane mucin MUC13 in ovarian cancer. Cancer Res 2009; 69:765-74; PMID:19176398; http://dx.doi.org/10.1158/0008-5472.CAN-08-0587
- Packer LM, Williams SJ, Callaghan S, Gotley DC, McGuckin MA. Expression of the cell surface mucin gene family in adenocarcinomas. Int J Oncol 2004; 25:1119-26; PMID:15375564
- Walsh MD, Young JP, Leggett BA, Williams SH, Jass JR, McGuckin MA. The MUC13 cell surface mucin is highly expressed by human colorectal carcinomas. Hum Pathol 2007; 38:883-92; PMID:17360025; http://dx.doi.org/10.1016/j.humpath.2006.11.020
- Shimamura T, Ito H, Shibahara J, Watanabe A, Hippo Y, Taniguchi H, Chen Y, Kashima T, Ohtomo T, Tanioka F, et al. Overexpression of MUC13 is associated with intestinal-type gastric cancer. Cancer Sci 2005; 96:265-73; PMID:15904467; http://dx.doi.org/10.1111/j.1349-7006.2005.00043.x
- Cheang MC, Voduc D, Bajdik C, Leung S, McKinney S, Chia SK, Perou CM, Nielsen TO. Basal-like breast cancer defined by five biomarkers has superior prognostic value than triple-negative phenotype. Clin Cancer Res 2008; 14:1368-76; PMID:18316557; http://dx.doi.org/10.1158/1078-0432.CCR-07-1658
- Bhalla A, Manjari M, Kahlon SK, Kumar P, Kalra N. Cytokeratin 56 expression in benign and malignant breast lesions. Indian J Pathol Microbiol 2010; 53:676-80; PMID:21045391; http://dx.doi.org/10.4103/0377-4929.72026
- Cheng D, Kong H, Li Y. TMPRSS4 as a poor prognostic factor for triple-negative breast cancer. Int J Mol Sci 2013; 14:14659-68; PMID:23857060; http://dx.doi.org/10.3390/ijms140714659
- Liang B, Wu M, Bu Y, Zhao A, Xie F. Prognostic value of TMPRSS4 expression in patients with breast cancer. Med Oncol 2013; 30:497; PMID:23420063; http://dx.doi.org/10.1007/s12032-013-0497-8
- Reis-Filho JS, Steele D, Di Palma S, Jones RL, Savage K, James M, Milanezi F, Schmitt FC, Ashworth A. Distribution and significance of nerve growth factor receptor (NGFRp75NTR) in normal, benign and malignant breast tissue. Mod Pathol 2006; 19:307-19; PMID:16424897; http://dx.doi.org/10.1038/modpathol.3800542
- Tsang JY, Wong KH, Lai MW, Lacambra MD, Ko CW, Chan SK, Lam CC, Yu AM, Tan PH, Tse GM. Nerve growth factor receptor (NGFR): a potential marker for specific molecular subtypes of breast cancer. J Clin Pathol 2013; 66:291-6; PMID:23268325; http://dx.doi.org/10.1136/jclinpath-2012-201027
- Zhang H, Rakha EA, Ball GR, Spiteri I, Aleskandarany M, Paish EC,Powe DG, Macmillan RD, Caldas C, Ellis IO, et al. The proteins FABP7 and OATP2 are associated with the basal phenotype and patient outcome in human breast cancer. Breast Cancer Res Treat 2010; 121:41-51; PMID:19590950; http://dx.doi.org/10.1007/s10549-009-0450-x
- Alshareeda AT, Rakha EA, Nolan CC, Ellis IO, Green AR. Fatty acid binding protein 7 expression and its sub-cellular localization in breast cancer. Breast Cancer Res Treat 2012; 134:519-29; PMID:22562177; http://dx.doi.org/10.1007/s10549-012-2083-8
- Tang XY, Umemura S, Tsukamoto H, Kumaki N, Tokuda Y, Osamura RY. Overexpression of fatty acid binding protein-7 correlates with basal-like subtype of breast cancer. Pathol Res Pract 2010; 206:98-101; PMID:19608352; http://dx.doi.org/10.1016/j.prp.2009.06.010
- Wang M, Liu YE, Ni J, Aygun B, Goldberg ID, Shi YE. Induction of mammary differentiation by mammary-derived growth inhibitor-related gene that interacts with an omega-3 fatty acid on growth inhibition of breast cancer cells. Cancer Res 2000; 60:6482-7; PMID:11103817
- Shi YE, Ni J, Xiao G, Liu YE, Fuchs A, Yu G, Su J, Cosgrove JM, Xing L, Zhang M, et al. Antitumor activity of the novel human breast cancer growth inhibitor, mammary-derived growth inhibitor-related gene, MRG. Cancer Res 1997; 57:3084-91; PMID:9242429
- Prat A, Adamo B, Cheang MC, Anders CK, Carey LA, Perou CM. Molecular characterization of basal-like and non-basal-like triple-negative breast cancer. Oncologist 2013; 18:123-33; PMID:23404817; http://dx.doi.org/10.1634/theoncologist.2012-0397
- Riggins RB, Lan JP, Zhu Y, Klimach U, Zwart A, Cavalli LR, Haddad BR, Chen L, Gong T, Xuan J, et al. ERRgamma mediates tamoxifen resistance in novel models of invasive lobular breast cancer. Cancer Res 2008; 68:8908-17; PMID:18974135; http://dx.doi.org/10.1158/0008-5472.CAN-08-2669
- Ring A, Dowsett M. Mechanisms of tamoxifen resistance. Endocr Relat Cancer 2004; 11:643-58; PMID:15613444; http://dx.doi.org/10.1677/erc.1.00776
- Hnatyszyn HJ, Liu M, Hilger A, Herbert L, Gomez-Fernandez CR, Jorda M, Thomas D, Rae JM, El-Ashry D, Lippman ME. Correlation of GREB1 mRNA with protein expression in breast cancer: validation of a novel GREB1 monoclonal antibody. Breast Cancer Res Treat 2010; 122:371-80; PMID:19842031; http://dx.doi.org/10.1007/s10549-009-0584-x
- Rae JM, Johnson MD, Scheys JO, Cordero KE, Larios JM, Lippman ME. GREB 1 is a critical regulator of hormone dependent breast cancer growth. Breast Cancer Res Treat 2005; 92:141-9; PMID:15986123; http://dx.doi.org/10.1007/s10549-005-1483-4
- Ghosh MG, Thompson DA, Weigel RJ. PDZK1 and GREB1 are estrogen-regulated genes expressed in hormone-responsive breast cancer. Cancer Res 2000; 60:6367-75; PMID:11103799
- Sun J, Nawaz Z, Slingerland JM. Long-range activation of GREB1 by estrogen receptor via three distal consensus estrogen-responsive elements in breast cancer cells. Mol Endocrinol 2007; 21:2651-62; PMID:17666587; http://dx.doi.org/10.1210/me.2007-0082
- Jordan NJ, Dutkowski CM, Barrow D, Mottram HJ, Hutcheson IR, Nicholson RI, Guichard SM, Gee JM. Impact of dual mTORC12 mTOR kinase inhibitor AZD8055 on acquired endocrine resistance in breast cancer in vitro. Breast Cancer Res 2014; 16:R12; PMID:24457069; http://dx.doi.org/10.1186/bcr3604
- Wang M, Liu YE, Greene J, Sheng S, Fuchs A, Rosen EM, Shi YE. Inhibition of tumor growth and metastasis of human breast cancer cells transfected with tissue inhibitor of metalloproteinase 4. Oncogene 1997; 14:2767-74; PMID:9190892; http://dx.doi.org/10.1038/sj.onc.1201245
- Davis JM, Murphy EA, Carmichael MD, Davis B. Quercetin increases brain and muscle mitochondrial biogenesis and exercise tolerance. Am J Physiol Regul Integr Comp Physiol 2009; 296:R1071-7; PMID:19211721
- Murphy EA, Davis JM, McClellan JL, Carmichael MD. Quercetin's effects on intestinal polyp multiplicity and macrophage number in the Apc(Min+) mouse. Nutr Cancer 2011; 63:421-6; PMID:21391122; http://dx.doi.org/10.1080/01635581.2011.535954
- Shibata MA, Jorcyk CL, Liu ML, Yoshidome K, Gold LG, Green JE. The C3(1)SV40 T antigen transgenic mouse model of prostate and mammary cancer. Toxicol Pathol 1998; 26:177-82; PMID:9502400; http://dx.doi.org/10.1177/019262339802600121
- Calvo A, Yokoyama Y, Smith LE, Ali I, Shih SC, Feldman AL, Libutti SK, Sundaram R, Green JE. Inhibition of the mammary carcinoma angiogenic switch in C3(1)SV40 transgenic mice by a mutated form of human endostatin. Int J Cancer 2002; 101:224-34; PMID:12209972; http://dx.doi.org/10.1002/ijc.10589
- Steiner JL, Murphy EA, McClellan JL, Carmichael MD, Davis JM. Exercise training increases mitochondrial biogenesis in the brain. J Appl Physiol 2011; 111:1066-71; PMID:21817111; http://dx.doi.org/10.1152/japplphysiol.00343.2011