
Abstract
Glioblastoma cells are resistant to apoptotic stimuli with autophagic death prevailing under cytotoxic stress. Autophagy interfering agents may represent a new strategy to test in combination with chemo-radiation. We investigated the patterns of expression of autophagy related proteins (LC3A, LC3B, p62, Beclin 1, ULK1 and ULK2) in a series of patients treated with post-operative radiotherapy. Experiments with glioblastoma cell lines (T98 and U87) were also performed to assess autophagic response under conditions simulating the adverse intratumoral environment. Glioblastomas showed cytoplasmic overexpression of autophagic proteins in a varying extent, so that cases could be grouped into low and high expression groups. 10/23, 5/23, 13/23, 5/23, 8/23 and 9/23 cases examined showed extensive expression of LC3A, LC3B, Beclin 1, Ulk 1, Ulk 2 and p62, respectively. Lysosomal markers Cathepsin D and LAMP2a, as well as the lyososomal biogenesis transcription factor TFEB were frequently overexpressed in glioblastomas (10/23, 11/23, and 10/23 cases, respectively). TFEB was directly linked with PTEN, Cathepsin D, HIF1α, LC3B, Beclin 1 and p62 expression. PTEN was also significantly related with LC3B but not LC3A expression, in both immunohistochemistry and gene expression analysis. Confocal microscopy in T98 and U87 cell lines showed distinct identity of LC3A and LC3B autophagosomes. The previously reported stone-like structure (SLS) pattern of LC3 expression was related with prognosis. SLS were inducible in glioblastoma cell lines under exposure to acidic conditions and 2DG mediated glucose antagonism. The present study provides the basis for autophagic characterization of human glioblastoma for further translational studies and targeted therapy trials.
Abbreviations
| LC3 | = | Microtubule-associated protein 1 light chain 3 |
| Beclin 1 | = | Coiled-Coil, Moesin-Like BCL2 Interacting Protein |
| Ulk | = | Unc-51 Like Autophagy Activating Kinase |
| p62 | = | sequestosome 1, SQSTM1 |
| SLS | = | stone-like structures |
| 2DG | = | 2-deoxy-D-glucose |
Introduction
Glioblastoma multiforme (GBM) is one of the most lethal human tumorsCitation1 with a median survival of 12 months.Citation2 Complete surgical removal of glioblastoma is rarely achieved due to the infiltrative nature of the disease. Post-operative radiotherapy with temozolomide is the standard adjuvant therapy offered worldwide.Citation3 Radiation is offered as the main treatment option in patients with poor performance status or surgically inaccessible lesions.
Targeted therapies with specific molecules against discreet molecular pathways may improve the management of this highly lethal disease. Glioblastomas, being highly angiogenic tumors, were thought to be susceptible to anti-VEGF therapy. Bevacizumab was approved by the FDA for the treatment of recurrent GBM.Citation4 However its role in combination with radiotherapy remains under investigation. About half of glioblastomas bear EGFR gene amplification, mutation and receptor overexpression.Citation5 Anti-EGFR1 monoclonal antibodies and pharmacological tyrosine kinase inhibitors, although of limited efficacy as single agent therapy,Citation6 may provide a benefit as shown in randomized trials in combination with radiotherapy.
Autophagy (the term used herein for macro-autophagy) is a major intracellular pathway dedicated to a continuous removal of cell constituents through the degradation and recycling of long-lived or damaged proteins and cytoplasmic organelles.Citation7 During autophagy double-membrane vesicles are formed that engulf the damaged proteins and organelles and fuse with lysosomal vesicles.Citation8 Beclin 1 is an autophagosome initiation protein and LC3 a structural component of the autophagosomes. LC3-I is the soluble form while LC3-II is the autophagosome membrane bound form that is distinguishable from LC3-I in western blot analysis. Beclin 1, LC3A and LC3B are 3 main proteins that are extensively used for the study of autophagy.Citation9 ULK1 and ULK2 (Atg1 homologs, uncoordinated family member (unc- 51–like kinase 1 and 2) are also important autophagy signaling molecules triggered under conditions of amino acid deprivation but not by glucose deprivation.Citation10 The unique nature of glioblastoma cells is to be resistant to apoptotic stimuli with death occurring through autophagy.Citation11,12 This suggests that autophagy interfering agents in combination with radiation and temozolomide may represent a new strategy to test.
In the current pilot study we sought to investigate the expression patterns of LC3, Beclin 1 and ULK proteins in a series of glioblastomas. The p62/sequestrosome protein that carries damaged proteins to the autophagosomes was also studied. In addition, we studied the expression of the TFEB (transcription factor EB) regulating lyososomal biogenesis and the expression of the lysosomal membrane LAMP2a prortein and the Cathepsin D intralyososomal enzyme expression patterns.Citation13 The aim of the current study is to identify specific patterns of autophagy protein expression to characterize subgroups of glioblastoma patients that could be included in clinical trials for autophagy interfering therapies.
Results
LC3 cytoplasmic expression
In the normal brain, strong cytoplasmic LC3A and LC3B expression was apparent in all neurons and their processes (). In contrast, glial cells were negative. Similarly, endothelial cells in the normal brain were non reactive with either of the 2 antibodies.
Figure 1. Immunohistochemical expression of LC3A and LC3B in the normal brain and in glioblastomas. Strong cytoplasmic LC3A and LC3B expression was apparent in all neurons and their processes, but not in glial cells (). Strong cytoplasmic LC3A and LC3B expression in glioblastoma cells (, respectively). shows a typical LC3A+ staining of multiple intracytoplasmic SLSs, in glioblastoma cells. shows the Kaplan-Meier survival curves of patients with glioblastoma stratified for SLS expression.
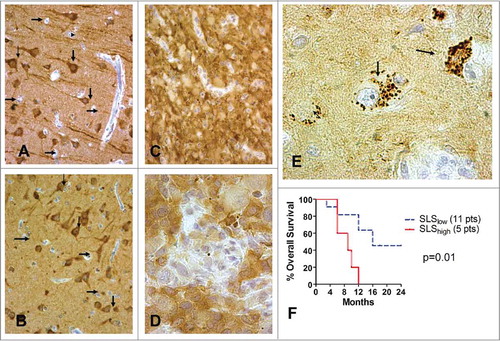
Glioblastoma cells showed a strong cytoplasmic LC3A expression to a varying extent, ranging from 0% to 90% (median 40%) (). Ten of the 23 cases (43.4%) demonstrated extensive overexpression in a percentage of cells higher than the median (≥50%), and these were considered as having a high cytoplasmic LC3 reactivity.
The LC3B antigen was /also/ overexpressed in glioblastoma cells to an extent varying among cases from 0% to 100% (median 10%) () Extensive overexpression in ≥50% of glioma cells was noted in 5/23 cases (21.7%), and these were considered as having a high LC3B cytoplasmic expression. There was no significant association between LC3A and B expression.
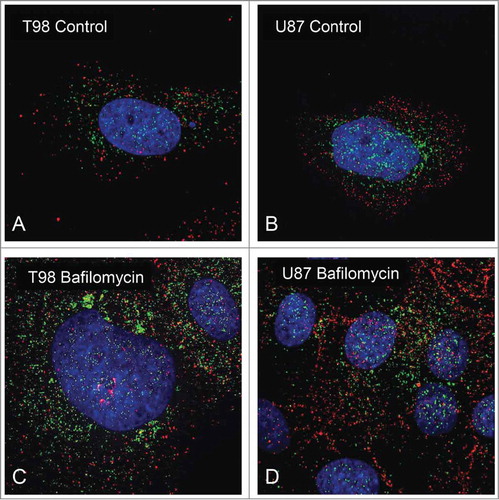
Confocal microscopy of cell lines showed LC3A and LC3B localization in round cytoplasmic structures. Double immunostaining revealed that autophagosomes were stained either with LC3A or LC3B with apparent lack of co-localization, even after exposure to the autophagy disrupting agent Bafilomycin (), implying a different biogenetic origin of LC3A and LC3B autophagososmes. Of interest, there were distinct cytoplasmic areas where the LC3A or the LC3B autophagosomes prevailed. LC3A showed a perinuclear and nuclear localization, while LC3B was homogeneously distributed in the cytoplasmic area but poorly within the nucleus.
Figure 2. Confocal immunofluorescence microscopy of T98 and U87 glioblastoma cells showing a non-overlapping presence of LC3A and LC3B autophagosomes (A and B). Following exposure to Bafilomycin, LC3A and LC3B autophagosomes were accumulated in the cytoplasm of T98 (2C) and U87 (2D) cells, without any colocalization of the staining.
LC3 SLS
In normal brain tissue there were no neurons or glial cells with SLS. This feature was tumor specific. In glioblastoma cells, the size of the LC3A+ SLS ranged from 0.91 μm-2.51 μm and their number ranged from one structure to multiple (up to 20); . This contrasts with the typical SLS of epithelial tumors where often one large ‘stone’ occupies the whole cytoplasm.Citation13 Of interest, the glioblastoma cell nucleus often maintained a central position in the cell (), surrounded by the SLS, while in epithelial carcinomas the nucleus is pushed to the periphery of the cell, as previously described.Citation14
In glioblastoma cells, after inspection of all x 400 optical fields, LC3 + SLS were evident in a percentage ranging from 0-40% (median 10%) of total cells (). 7/23 (30.4%) cases had SLS in a % of cells higher than the median (≥20%).
Stress induction of LC3 and of SLS in cell lines
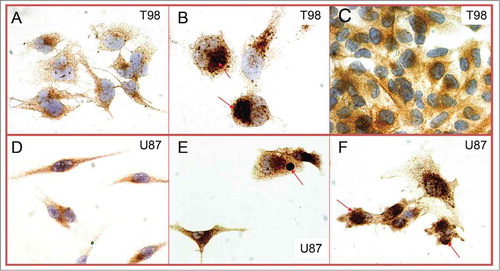
Cultured cell lines under oxygenated conditions and optimal culture medium were placed on poly-L-lysine coated slides and immunohistochemistry for LC3A and B was performed. In T98 cells, both LC3A and LC3B showed a paranuclear polarized expression at the one side of the nucleus. In U87 cells LC3A and LC3B showed a rather diffuse pattern of expression. In both cases small LC3+ autophagic vacuoles were evident. SLS could not be identified in either cell line.
To examine whether and which of the tumor microenvironment stress factors are able to induce LC3 and the SLS phenomenon, cultures were performed under hypoxia, acidity, hyperthermia and glucose metabolism blockage with 2-deoxy-D-glucose. Acidity resulted in intensification of LC3A and B expression in the form of diffuse cytoplasmic and also of small autophagic vacuoles. Hyperthermia, induced depletion of the diffuse cytoplasmic expression of LC3A and B and reduction in the density of the autophagic structures. Of interest, exposure to 2DG resulted in dramatic increase of diffuse LC3 expression and accumulation of large autophagic vacuoles similar to the SLS noted in a fraction of glioblastoma cells in human tumors (). This was evident in both cell lines. However, low pH induced SLS in the U87 cell line but not in the T98 one.
Figure 3. T98 (4A) and U87 (4D) glioblastoma cells in optimal culture conditions. Exposure to 2DG resulted in dramatic increases of LC3A and LC3B, with evident accumulation of SLS, in both cell lines (T98: 4B; U87: 4E). Low pH on the other hand induced SLS in the U87 cell line (4F) but not in the T98 (4C).
Beclin 1 expression
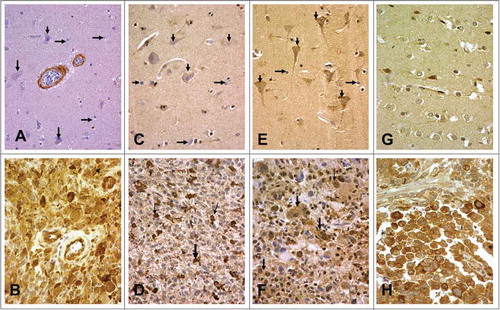
In normal brain Beclin 1 was not expressed by neurons or glial cells, while a sporadic staining of normal vessels was evident (). In glioblastoma, tumor cells showed strong cytoplasmic Beclin 1 overexpression (compared to normal glial cells) in a varying percentage of cells, ranging from 0% to 100%, median 20% (). 13/23 cases (56.5%) showed a prevalence of negative cells (50-100%), 10/23 (43.5%) showed a clear over-expression of Beclin 1 in 50-100% of cells.
Figure 4. Normal neurons and glial cells were unreactive for Beclin 1, while normal vessels were sporadically positive . Glioblastoma cells showing strong cytoplasmic Beclin 1 expression . ULK1 or ULK2 were not expressed by normal neurons or glial cells (. Strong cytoplasmic ULK1 and ULK2 expression was noted in glioblastoma cells , respectively). shows weak expression of p62 in normal brain, while indicates glioblastoma cells with strong cytoplasmic p62 reactivity.
ULK1 and 2 expression
In normal brain glial cells did not express ULK1 or ULK2, but ULK2 showed some expression in neurons (). Strong cytoplasmic ULK1 expression was noted in 0-90% of glioblastoma cells (median 10%). In 5/23 cases (21.7%) ULK1 was extensively expressed in more than 50% of tumor cells and these were considered to have high ULK1 reactivity. In some cases ULK1 stained a scattered subpopulation of the glioblastoma cells (). Similarly ULK2 overexpression was noted in 0–90% (median 30%) of glioblastoma cells (). In 8/23 (34.8%) of cases, extensive ULK2 overexpression in more than 50% of tumor cells was noted and these were considered of high ULK2 expression.
P62 expression
In normal brain, p62 had a weak expression in neurons while glial cells seemed unreactive, with sporadic expression (). In glioblastoma cases, p62 overexpression (compared to normal glial cells) was evident in a varying percentage of neoplastic cells ranging from 0–100% (median 40%). Extensive overexpression in more than 50% of cells was noted in 9/23 cases ().
Lysosomal protein expression patterns
In normal brain, lysosomal markers were weakly expressed in neurons and glial cells. In glioblastomas, TFEB showed strong granular cytoplasmic expression ranging fro 0–60% of neoplastic cells (median 10%). Granular cytoplasmic LAMP2a strong expression was evident in glioblastomas ranging from 0–60% (median 20%) of the total neoplastic cell population. Strong granular cytoplasmic Cathepsin D expression was also evident ranging from 0–70% of the total glioblastoma cell population (median 40%). shows typical cytoplasmic overexpression of the 3 lysosomal markers. Using the median values as cut-off points, 10/23, 11/23, and 10/23 cases were considered to have high TFEB, LAMP2a and Cathepsin D expression, respectively.
Correlation between markers
Among autophagosomal markers, using linear regression analysis of the % of positive cells, the only association found was the inverse relation of ULK2 expression with the number of SLS (p = 0.02, r2 = 0.20) and the strong direct association of p62 with Beclin 1 overexpression (P < 0.0001; r = 0.88).
Linear regression analysis of the lysosomal markers showed that TFEB was directly linked with HIF1α (p = 0.001, r = 0.64), LC3B (p = 0.002, r = 0.60), Beclin 1 (p = 0.01. r = 0.50) and p62 (p = 0.008, r = 0.55) protein expression. Moreover, Cathepsin D expression was directly linked with TFEB (p = 0.02, r = 0.44), HIF1α (p = 0.003, r = 0.59), LC3A (p = 0.001, r = 0.63) and LC3B (p = 0.0007, r = 0.64) protein expression ().
Correlation of PTEN with auto-lysosomal markers
Cytoplasmic expression was strong in normal brain and in 9/23 (39%) of glioblastomas (). The % of tumor cells with strong PTEN expression ranged from 10-60% (median 20%). PTEN expression was significantly correlated with LC3B (p = 0.01, r = 0.48) but not with LC3A. Moreover, PTEN was significantly related to TFEB (p = 0.006, r = 0.54) and LAMP2a (p = 0.02, r = 0.45) expression; .
Figure 5. Immunohistochemical images of glioblastoma stained for lysosomal markers, showing granular cytoplasmic expression: (A) Cathepsin D, (B) LAMP2a, (C) TFEB. Linear regression analysis of TFEB (D) and Cathepsin D (E) expression with autophagy markers.
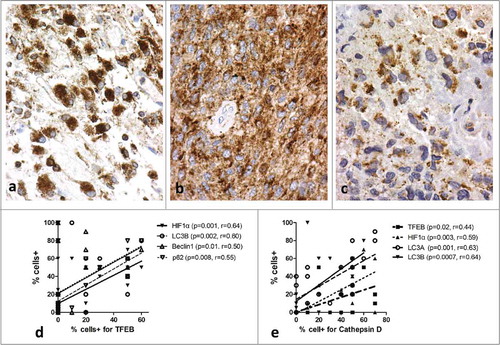
Figure 6. Immunohistochemical image of glioblastoma stained for PTEN (A). Correlation of PTEN expression with auto-lysosomal markers in immunohistochemical data (B) and in gene expression data (C).
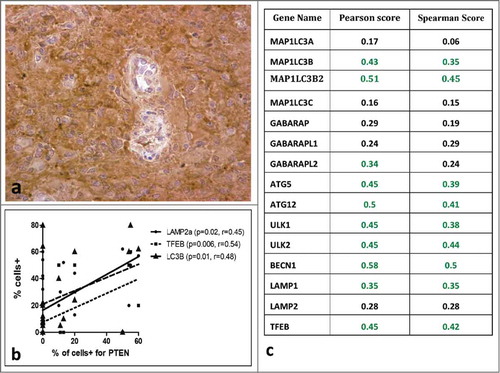
To further assess the correlation between PTEN and autophagy related genes we analyzed data sets from at the cBio portal, as mentioned in the methods. We found a positive correlation between PTEN gene expression and expression of autophagy related genes (). PTEN was correlated with MAP1LC3B and MAP1LC3B2 but not with MAP1LC3A. Also PTEN was co-expressed with autophagy signaling genes such as ULK1/2 and Beclin1. PTEN correlated with atg5 and atg12, and the transcription factor TFEB.
Normal brain vs. glioblastoma cell line protein expression
Western blot analysis of protein expression in normal human brain tissue vs. cell line extracts is shown in . Normal brain had a high content of proLC3A and LC3A-I protein, but a striking lack of the LC3A-II form. This later form of the protein was strongly expressed in the U87 cell line but poorly in the T98 cell line. In contrast to LC3A, LC3B was poorly expressed in the normal brain, but was strongly expressed in the U87 cell line, in both I and II forms. LC3B was poorly expressed in the T98 cell line. P62 was also poorly expressed in normal brain compared to the 2 glioblastoma cell lines. ULK1 was not detectable, while low expression of ULK2 was noted in the 2 glioblastoma cell lines. Beclin 1 on the other hand was strongly expressed only in the U87 cell line.
Figure 7. Western blot analysis of autophagosomal (LC3A, LC3B, p62, ULK2, Beclin 1), lysosomal (TFEB, LAMP2a, Cathepsin D) markers and PTEN expression, in normal human brain and the 2 glioblastoma cell lines (U87 and T98) under optimal culture conditions.
Regarding the lysosomal markers, these were weakly expressed in the normal brain, which is in accordance with the immunohistochemistry results. TFEB was clearly overexpressed in the U87, but not in the T98 cell line. Presumably due to its role in lysosomal biogenesis, TFEB defined a strong presence of LAMP2a and Cathepsin D in the U87 cell line, while the expression of these proteins was reduced in the TFEB weakly expressing T98 cell line. The PTEN protein was highly expressed in normal brain and the T98 glioblastoma cell line, while it was absent in the U87 one ().
Survival analysis
Post-irradiation survival analysis was feasible in 16 patients, the rest of patients being diagnosed in remote therapeutic centers. Despite the low number of cases, SLS was the only parameter that was linked with poor prognosis (p = 0.01; ).
Discussion
Glioblastoma is typically an incurable disease. Radiotherapy delivered after surgery improves the median survival by some months, but only a small percentage of patients survive more than 2 y The fact that glioblastoma is a rather localized disease that never metastasizes outside the central nervous system, makes the disease a real challenge for radiotherapy. Why this tumor is one of the most radioresistant of all human malignancies remains a mystery.
Recent experimental data have shown an important resistance of glioblastoma cells to undergo apoptosis as a response to radiation. It is suggested that blocked apoptotic pathways due to mutations of relevant genes may underlie this phenomenon.Citation15 In early studiesCitation16,17 glioblastoma cells were found to preferentially undergo autophagic death instead of apoptosis, following irradiation. High LET radiation also kills glioblastoma cells through autophagy.Citation18 It is, therefore, suggested that interfering autophagy may be an important policy to enhance the activity of radiotherapy in glioblastomas. This was verified in experiments using mTOR inhibitors that trigger autophagic responses, where an important radio-sensitization of U87 glioma cells was obtained.Citation19 Arsenic trioxide also enhances the activity of radiation in glioma cell lines by augmenting the autophagic cell death.Citation20
Temozolomide, the only drug shown to overcome the blood-brain barrier and to be of clinical value in the radio-chemotherapy of gliomas, also kills glioma cells by inducing autophagy.Citation21 Blockage of autophagy suppresses the activity of Temozolomide. Lefranc et al suggested that, as glioblastoma cells are resistant to apoptosis, blocking targets that down regulate autophagy (such as mTOR), may enhance the activity of Temozolomide induced autophagic death.Citation22,23
It appears, therefore, that although exacerbation of autophagy is a death pathway exploited by radiotherapy and Temozolomide, only a small number of clinico-pathological studies have investigated gioblatomas, and they show a high percentage of glioblastomas already have an up-regulated autophagic pathway,Citation24,25 with overexpression of LC3 and beclin 1 proteins, presumably as an indispensable pathway for energy acquisition under the stressful metabolic demands of an accelerated growth. Any stressor that further accelerates autophagy may result in accelerated autophagic death, especially when cells are exposed to radiation and/or Temozolomide.
In the current work, we studied the expression of key autophagy proteins in a small series of glioblastomas, namely LC3A, LC3B, Beclin 1 and ULK1,2 proteins. Investigating specific patterns of expression may help to identify subgroups of glioblastomas that would benefit from autophagy targeting agents. An interesting finding confirmed by confocal microscopy was that LC3A and LC3B autophagosomes were distinct and that there were no autophagosomes composed of both proteins. Moreover LC3A and LC3B subcellular localizations were not identical, implying different biological roles in the cancer cell.
In accordance with our previous studies in epithelial carcinomas, LC3 staining was upregulated also in glioblastomas. The extensive consumption of the glioma cell cytoplasm by an exacerbated autophagic activity, resulting in presumably undigested remnant stone like structures (SLS) occupying the cytoplasmic space was a tumor specific feature, never noted in the normal brain glia. In approximately half of the cases, the increased expression of LC3 and the presence of cells with SLS was marked. Assessment of LC3A and LC3B in T98 and U87 cell lines showed an intense expression of both forms in the U87 one. In this cell line both the cytoplasmic and membrane bound (I and II, respectively) forms were present. On the contrary, LC3s were weakly expressed in the T98 cell line. This finding reflects the immunohistochmical expression intensity variation of LC3s noted among human glioblastomas. Of interest, normal human brain had an impressive expression of LC3A-I and pro-LC3A forms, while a striking absence of the LC3A-II form and of all forms of LC3B protein was noted. This may show that, unlike LC3B, LC3A has important biological roles in normal brain that should be further examined. Putting cell lines under various stresses we were able to induce SLS in the cytoplasm of cancer cells. Glucose antagonism with 2DG and acidic conditions highly induced this feature, suggesting that the presence of glioblastoma cells with SLS in human tissue sections reflects a similar intratumoral environment.
Beclin 1 protein was also upregulated in tumor cells compared to normal brain in approximately one third of the glioblastoma cases. Some tumors lacked Beclin 1 expression. Methylation of the promoter of Beclin 1 gene has been reported to be a common event in breast cancerCitation26 but there are no data for glioblastomas. Monoallelic deletion of the Beclin 1 gene may also be a reason for lack of Beclin 1 expression in some tumors.Citation27 Whether demethylating agents can restore Beclin 1 function and contribute to radiation/Temozolomide induced autophagic death is a hypothesis worth pursuing. Indeed, 5-aza-20-deoxycytidine, a potent demethylating agent, is also an autophagy promoter.Citation28 Differentiation inducing agents and inhibitors of histone deacetylase, such as valproic acid,Citation29 are potent inducers of autophagy in glioma cells, inducing autophagic cell death but not apoptosis.Citation30 Whether such agents can target radiation/Temozolomide resistant glioma stem cells is another hypothesis to test. Of interest, Beclin 1 was overexpressed in the U87 but not in the T98 cell line, while ULK1 was overxpressed in both cell lines at similar levels compaired to normal brain. Whether the low expression of Beclin 1 in T98 cell line is a result of gene methylation, demands further investigation.
The above may show distinct autophagy signaling pathways activated in the 2 cell lines. The tumor suppressor gene PTEN is frequently mutated in glioblastomas.Citation31,32 The phosphatase encoded by PTEN antagonizes the AKT/mTOR pathway, which plays a major regulatrory role in autophagy. It has been reported that U87MG glioma cells lacks a functional PTEN activity,Citation33 also confirmed in the current study, which suggests an enhanced mTOR activity with an expected suppression of autophagy. The intense presence of LC3A,B-II forms in U87, as found in the current study, suggests an mTOR independent autophagy regulation pathway in this cell line. For example, the ULK1–Atg13–FIP200 complex regulate autophagy by signaling downstream of mTORC1 to start autophagosomal formation.Citation34 Indeed, ULK2 was overexpressed in both cell lines examined. Studying the distinct signaling pathways among human glioblastomas may be important in the classification of tumors according to their autophagic profile.
Analysis of PTEN immunohistochemical expression in the series of glioblastomas, showed a significant direct association of PTEN with LC3B expression, but not with LC3A. This was also confirmed in analysis of mRNA levels. The role of PTEN in the differential regulation of the LC3A and LC3B proteins further supports a distinct role of these proteins in the cellular homeostasis regulation and physiology. PTEN was also related with additional autophagy and lysosomal related proteins like ULK1/2, TFEB atg5 and atg12, in gene expression analysis.
An additional interesting observation was that lysosomal presence was intensified in most glioblastomas, as suggested by the overexpression of LAMP2a membrane and Cathepsin D intra-lysosomal protein expression. Moreover, the key transcription factor TFEB regulating the expression of proteins involved in lysosomal biogenesis, and also of autophagy related proteins, was overexpressed in a subset of tumors and directly linked with autophagy markers. Western blot analysis confirmed overexpression of TFEB and lysosomal proteins in the U87 glioblastoma cell line, but this was far less intense in the T98 one, confirming the existence of different autophagy profiles among glioblastomas.
Taking into account the above findings it is suggested that autophagic activity is increased in a large percentage of glioblastomas, that is not always linked with Beclin 1 up-regulation. Alternative pathways involving the UKL1/ULK2 autophagy initiating molecules are presumed to be active in about half of the cases examined. Nevertheless 30% of cases with high LC3 autophagic activity had a lack of Beclin 1 or ULK expression suggesting the existence of a non-canonical autophagic activity in another fraction of the glioblastomas. Moreover, lysosomal activity also varies among glioblastoma cases and cell lines and this certainly contributes to the robustness of the autophagic machinery in tumors.
Conclusions
The current pilot histopathological study shows that glioblastomas share an autophagic activity, which is guided by different molecular pathways. Intense autophagic activity characterizes more than half of the glioblastomas studied (55%). ULKs and Beclin 1 are separately or concurrently up-regulated in about 70% of these cases. 45% of glioblastomas seem to have a low autophagic activity, suggesting the presence of a pathway suppressing the signaling ability of these molecules or a molecular deficit in the autophagic vacuolar formation downstream of these signaling molecules. TFEB and lysosomal markers were also intensively upregulated in glioblastomas, and were directly linked with autophagosomal markers, providing a new therapeutic target for further research. The SLS, a hallmark of malignancy, was also a feature related to prognosis and was inducible in vitro by unfavourable environmental conditions. The prognostic and predictive role, in terms of response to radiotherapy and Temozolomide, of specific autophagy expression patterns should be thoroughly examined in a larger series of patients.
Materials and Methods
This study includes 23 glioblastoma specimens, surgically removed before radiotherapy. Ethical approval was obtained from the appropriate institutional board: Research Committee of the Democritus University of Thrace, Alexandroupolis, Greece. Archived paraffin embedded tissue blocks were used for analysis.
Immunohistochemistry for autophagy/lysosome related proteins
Autophagy related proteins were detected by a previously standardized immunohistochemical techniques using: i) The purified rabbit polyclonal antibody MAP1LCA (AP1805a, Abgent, San Diego, CA) raised against a synthetic peptide at the C-terminal cleavage site of the human cleaved-LC3A (APG8a). This antibody was used at 1:50 dilution (overnight incubation), as recently described.Citation13 This antibody recognizes specifically the A and not the B variant in Western blot experiments against human recombinant proteins LC3A (H00084557-P01, Abnova) and LC3B (H00081631-P01, Abnova).Citation35 ii) The mouse monoclonal LC3B 5F10 (Nanotools) antibody (dilution 1:100, overnight incubation;). This antibody recognizes specifically the B and not the A variant in Western blot experiments (data not shown). iii) The rabbit monoclonal antibody EPR1733Y to Beclin 1 (ab51031, Abcam, Cambridge, UK), used at a dilution 1:50 and overnight incubation.Citation36 This is a synthetic peptide corresponding to residues near the C-terminus of human Beclin1. iv) the mouse monoclonal ab56416 antibody (ABCAM, UK) raised against full length protein corresponding to aminoacids 1-441 of Human SQSTM1/p62 protein (dilution 1:200, 30 min incubation) v) the mouse monoclonal antibody AA602-715 (ABIN563613, antibodies online GmbH, Germany) was used to detect the ULK1protein (dilutions 1:20 at overnight incubation) and, vi) the U8008 rabbit monoclonal antibody (Sigma Aldrich, USA) for the detection of the ULK2 protein (dilution 1:400, overnight incubation).
Lysosomal related proteins were detected using: i) The mouse monoclonal CTD-19 (ABCAM, UK) antibody, raised against full length human liver native protein, was used to detect Cathepsin D (dilution 1:1000, 30 min incubation), ii) the goat polyclonal antibody ab122910 (ABCAM, UK) raised against a synthetic peptide corresponding to the N terminal aminoacids 2–14 of Human TFEB, was used to detect the TFEB protein (dilution 1:100, overnight incubation) and iii) the rabbit polyclonal ab19528 antibody (ABCAM, UK) was used to detect the LAMP2a protein (dilution 1:100, 30 min incubation ). Moreover the PTEN protein was assessed using the rabbit 9188S monoclonal antibody to PTEN, at dilution 1:100 (Cell Signaling).
Briefly, tissue sections were cut at 3 μm from formalin-fixed paraffin-embedded tumors and mounted on poly-L-lysine coated glass slides. They were subsequently de-waxed and rehydrated in graded alcohols. Heat-induced epitope retrieval was achieved by placing the sections in citrate buffer (1:10 dilution, pH 7.2) and heated at 120°C for 3 × 5 min. Endogenous peroxidase activity was neutralized using peroxidase block for 5 min. The non-specific binding was blocked by preincubation with protein block for 5 min at room temperature (Novocastra Laboratories Ltd, Newcastle upon Tyne, United Kingdom). The slides were then incubated overnight at 4°C with the primary antibodies at dilutions indicated above. After washes in phosphate-buffered saline (PBS) (2 × 5 min), the sections were incubated with post primary block (that enhances penetration of the subsequent polymer agent) for 30 minutes at room temperature (Novocastra Laboratories Ltd). They were subsequently washed in PBS for 2 × 5 min and incubated with NovoLink polymer for 30 min at room temperature (Novocastra Laboratories Ltd). This recognizes mouse and rabbit immunoglobulins and detects any tissue-bound primary antibody. After thorough washing in PBS (2 × 5 min), the color reaction was developed in 3,3′-diaminobenzidine (DAB) for 5 min. The sections were then counterstained with hematoxylin, dehydrated and mounted.
In every staining run one component of the sequential staining reaction was omitted from at least one section, this usually being the omission of the primary antibody and its replacement by normal rabbit immunoglobulin-G.
Evaluation of autophagy/lysosome related protein expression
The patterns of LC3A expression are diffuse , perinuclear, cytoplasmic and “stone-like” structures (SLS), as previously reported.Citation13 These are readily recognized as large, rounded, densely stained material, amorphous or laminated, typically enclosed within an LC3 positive cytoplasmic vacuole. The proportion of glioblastoma cells with strong cytoplasmic/perinuclear expression or with SLS in their cytoplasm was recorded in all x400 optical fields and the mean value was used to score each case. Similarly, the proportion of tumor cells with Beclin 1, ULK1, ULK2, p62, TFEB, LAMP2a, Cathepsin D and PTEN cytoplasmic expression was recorded in all x400 optical fields and the mean value was use to score the cases.
Confocal microscopy
In order to assess whether LC3A and LC3B staining does not overlapped, double immunostaining with LC3A and LC3B antibodies was performed for confocal microscopy assessment. For immunofluorescence staining, cells grown on No.1.5 glass coverslips were fixed in 3.7% formaldehyde/PBS at pH 7.4 for 20 min at 37°C and then permeabilized in PBS/0.1% v/v Triton X-100 pH 7.4 for 5 min at room temperature. Cells were blocked in PBS/5% w/v BSA pH 7.4 and stained with various combinations of: anti-MAP1LC3A rabbit polyclonal (1:500; AP1805a Abgent) and anti-LC3B mouse monoclonal antibody (1:100; LC3B 5F10 Nanotools), for 1 h at room temperature. Cells were washed in PBS pH 7.4, incubated with appropriate CF 488 and 564 secondary antibodies (1:500; Biotium) for 30 min a room temperature and DNA was counterstained with Hoechst 33342 (1 μg/ml; Sigma-Aldrich). After final washes coverslips were mounted in homemade Mowiol mounting medium.
Imaging of fixed samples was performed on a customized Andor Revolution Spinning Disk Confocal System built around a stand (IX81; Olympus) with a 100x-1.4 NA lens and a digital camera (Andor Ixon + 885) (CIBIT Facility, MBG-DUTH). Image acquisition was performed in Andor IQ 2.1.7 software. Optical sections were recorded every 0.3 μm.
Microenvironmental stess simulation
The U87MG was cultured in low glucose DMEM, (Gibco Life Technologies Grand Island, New York, USA) and the T98G in low glucose MEM (Gibco Life Technologies Grand Island, New York, USA) with 10% Foetal Bovine Serum and 37°C, 21% oxygen / 5% CO2. MEM was supplemented with 1 mM Sodium Pyruvate and 2 mM L-Glutamine. In an attempt to investigate whether intratumoral related microenviromental conditions regulate specific patterns of LC3 expression, cell lines were exposed to i) hyperthermia (40°C) for 48 h, ii) low pH (near to 6.5), achieved with HCl addition under monitoring of the culture medium pH, for 48 h and, iii) glucose competition by exposing cells to 2DG (12 mM) for 48 h. 105 cells were allowed to grow on poly-L-lysin coated slides in petri dishes under the above conditions for subsequent immunocytochemistry.
Western blot analysis
Glioma cell lines (U87MG and T98T) obtained from the ATCC were cultured under standard conditions in a 5% CO2 incubator at 37°C according to the guidelines for their growth. Cells were lysed using the RIPA buffer containing the protease and phosphatase inhibitor cocktail. Moreover, normal brain tissue homogenized in RIPA buffer using plastic pestle (100 μl RIPA for 1 mg of tissue). Total protein concentrations were estimated according to the method of BCA protein assay kit (Thermo Scientific Pierce, USA).
The antibodies used were: i) The rabbit polyclonal to LC3A (1:15.000, ab62720, Abcam, a synthetic peptide PSDRPFKQRRSFADR conjugated to KLH by a Cysteine residue linker, corresponding to amino acids 2-15 of Human MAP1LC3A) ii) The mouse monoclonal antibody to LC3B (1:1.000; LC3B 5F10 Nanotools), iii) the rabbit polyclonal to beclin1 [EPR1733Y] (1:1.000, ab51031, Abcam, Synthetic peptide corresponding to residues near the C-terminus of human Beclin 1) iv) the rabbit polyclonal antibodies to SQSTM1/p62 (1:1.000, ab64134, Abcam, a synthetic peptide as a part of SQSTM1/ p62 conjugated to immunogenic carrier protein), v) the mouse monoclonal antibody AA602-715 (1:250, ABIN563613, antibodies online GmbH, Germany) was used to detect the ULK1 protein, vi) the U8008 rabbit monoclonal antibody (1:250, Sigma Aldrich, USA) for the detection of the ULK2 protein, vii) the rabbit polyclonal antibody to TFEB (1:2.000, A303-673A, Bethyl Laboratories, Inc., USA), viii) the mouse monoclonal anti-cathepsin D[CTD-19] (1:1.000, ab6313, Abcam) ix) the rabbit polyclonal antibody to LAMP2a (1:1.000, ab18528, Abcam) and, x) the rabbit monoclonal antibody to PTEN (1:1000, 9188S, Cell Signaling).
Whole fraction samples were separated on discontinuous SDS gels using 15% separating for LC3A and LC3B, 10% for Beclin1, TFEB, p62, PTEN and Cathepsin D, 7.5% for LAMP2a, ULK1 and ULK2, and 5% stacking gels. Forty nanograms of the cell extracts where loaded on the gel. Immunoblotting was performed utilizing PVDF-PSQ membranes (Millipore Corp.). After being blocked with 5% non-fat dry milk in 150 mM NaCl, 10 mM Tris, pH 7.5 (TBS) at room temperature, the membranes were hybridized overnight at 4°C with primary antibodies. The membranes were then hybridized for 2 hr at room temperature with the secondary antibody, goat polyclonal to rabbit IgG (H+L)-HRP (1:3.000, Biorad, 1706515, USA) or goat polyclonal to mouse IgG (H+L)-HRP (1:3.000, Biorad, 1706516, USA), and developed in Chemidoc MP Imaging System (Biorad, USA). Each of these blots was then stripped, dried overnight, re-hybridized with the rabbit polyclonal Anti-Lamin B1 (1:5000, Abcam, ab16048, synthetic peptide conjugated to KLH derived from within residues 400-500 of Mouse Lamin B1) and rabbit polyclonal antibody to β Actin (1:5000, ab75186, Abcam, Synthetic peptide derived from within residues 1-100 of Human β Actin.)
Gene expression data
The gene expression data analyzed in this study were obtained from the cBio portal (http://www.cbioportal.org) using the Glioblastoma data set published on Cell 2013 (TCGA, Brennal et al. 2013). Pearson correlation computed first, and for genes with a correlation greater than 0.3 or less than −0.3, the Spearman correlations are also computed. Only gene pairs with values >0.3 or<−0.3 in both analysis are shown.
Statistical analysis
Statistical analysis and graphs were performed using the Instat 3.1 Package and GraphPad Prism 5.01 package (GraphPad Software Inc., USA).
Disclosure of Potential Conflicts of Interest
No conflicts of interest were declared.
Funding
The study has been funded by the «TRAINING AND LIFELONG LEARNING - ARISTEIA» project, code no 520, ESPA 2007-2013, GGET decision number 12605/26.09.2012
References
- Hayat MJ, Howlader N, Reichman ME, Edwards BK. Cancer statistics, trends, and multiple primary cancer analyses from the surveillance, epidemiology, and end results (SEER) program. Oncologist 2007;12:20-37; PMID:17227898; http://dx.doi.org/10.1634/theoncologist.12-1-20
- Ohgaki H, Dessen P, Jourde B, Horstmann S, Nishikawa T, Di Patre PL, Burkhard C, Schüler D, Probst-Hensch NM, Maiorka PC, et al. Genetic pathways to glioblastoma: a population-based study. Cancer Res 2004; 64:6892-9; PMID:15466178; http://dx.doi.org/10.1158/0008-5472.CAN-04-1337
- Stupp R, Hegi ME, Mason WP, van den Bent MJ, Taphoorn MJ, Janzer RC, Ludwin SK, Allgeier A, Fisher B, Belanger K, et al. European organisation for research and treatment of cancer brain tumour and radiation oncology groups; national cancer institute of canada clinical trials group. Effects of radiotherapy with concomitant and adjuvant temozolomide versus radiotherapy alone on survival in glioblastoma in a randomised phase III study: 5-year analysis of the EORTC-NCIC trial. Lancet Oncol 2009; 10:459-66; PMID:19269895; http://dx.doi.org/10.1016/S1470-2045(09)70025-7
- Kreisl TN, Kim L, Moore K, Duic P, Royce C, Stroud I, Garren N, Mackey M, Butman JA, Camphausen K, et al. Phase II trial of single-agent bevacizumab followed by bevacizumab plus irinotecan at tumor progression in recurrent glioblastoma. J Clin Oncol 2009; 27:740-5; PMID:19114704; http://dx.doi.org/10.1200/JCO.2008.16.3055
- Hatanpaa KJ, Burma S, Zhao D, Habib AA. Epidermal growth factor receptor in glioma: signal transduction, neuropathology, imaging, and radioresistance. Neoplasia 2010; 12:675-84; PMID:20824044
- van den Bent MJ, Brandes AA, Rampling R, Kouwenhoven MC, Kros JM, Carpentier AF, Clement PM, Frenay M, Campone M, Baurain JF, et al. Randomized phase II trial of erlotinib versus temozolomide or carmustine in recurrent glioblastoma: EORTC brain tumor group study 26034. J Clin Oncol 2009; 27:1268-74; PMID:19204207; http://dx.doi.org/10.1200/JCO.2008.17.5984
- Klionsky DJ, Emr SD. Autophagy as a regulated pathway of cellular degradation. Science 2000; 290:1717-21; PMID:11099404; http://dx.doi.org/10.1126/science.290.5497.1717
- Yorimitsu T, Klionsky DJ. Autophagy: molecular machinery for self eating. Cell Death Differ 2005; 12, 2:1542-52; PMID:16247502; http://dx.doi.org/10.1038/sj.cdd.4401765
- Kabeya Y, Mizushima N, Ueno T, Yamamoto A, Kirisako T, Noda T, Kominami E, Ohsumi Y, Yoshimori T. LC3, a mammalian homologue of yeast Apg8p, is localized in autophagosome membranes after processing. EMBO J 2000; 19:5720-8; PMID:11060023; http://dx.doi.org/10.1093/emboj/19.21.5720
- Cheong H, Lindsten T, Wu J, Lu C, Thompson CB. Ammonia-induced autophagy is independent of ULK1/ULK2 kinases. Proc Natl Acad Sci U S A 2011; 5: 108:11121-6; PMID:21690395; http://dx.doi.org/10.1073/pnas.1107969108
- Yao KC, Komata T, Kondo Y, Kanzawa T, Kondo S, Germano IM. Molecular response of human glioblastoma multiforme cells to ionizing radiation: cell cycle arrest, modulation of the expression of cyclin-dependent kinase inhibitors, and autophagy. J Neurosurg 2003; 98:378-84; PMID:12593626; http://dx.doi.org/10.3171/jns.2003.98.2.0378
- Kanzawa T, Germano IM, Komata T, Ito H, Kondo Y, Kondo S. Role of autophagy in temozolomide-induced cytotoxicity for malignant glioma cells. Cell Death Differ 2004; 11:448-57; PMID:14713959; http://dx.doi.org/10.1038/sj.cdd.4401359
- Settembre C, Di Malta C, Polito VA, Garcia Arencibia M, Vetrini F, Erdin S, Erdin SU, Huynh T, Medina D, et al. TFEB links autophagy to lysosomal biogenesis. Science 2011; 332:1429-33; PMID:21617040; http://dx.doi.org/10.1126/science.1204592
- Sivridis E, Koukourakis MI, Zois CE, Ledaki I, Ferguson DJ, Harris AL, Gatter KC, Giatromanolaki A. LC3A-positive light microscopy detected patterns of autophagy and prognosis in operable breast carcinomas. Am J Pathol 2010; 176: 2477-89; PMID:20382705; http://dx.doi.org/10.2353/ajpath.2010.090049
- Lee JJ, Kim BC, Park MJ, Lee YS, Kim YN, Lee BL, Lee JS. PTEN status switches cell fate between premature senescence and apoptosis in glioma exposed to ionizing radiation. Cell Death Differ 2011; 18:666-77; PMID:21072054; http://dx.doi.org/10.1038/cdd.2010.139
- Yao KC, Komata T, Kondo Y, Kanzawa T, Kondo S, Germano IM. Molecular response of human glioblastoma multiforme cells to ionizing radiation: cell cycle arrest, modulation of the expression of cyclin-dependent kinase inhibitors, and autophagy. J Neurosurg 2003; 98:378-84; PMID:12593626; http://dx.doi.org/10.3171/jns.2003.98.2.0378
- Ito H, Daido S, Kanzawa T, Kondo S, Kondo Y. Radiation-induced autophagy is associated with LC3 and its inhibition sensitizes malignant glioma cells. Int J Oncol 2005; 26:1401-10; PMID:15809734
- Benzina S, Altmeyer A, Malek F, Dufour P, Denis JM, Gueulette J, Bischoff P. High-LET radiation combined with oxaliplatin induce autophagy in U-87 glioblastoma cells. Cancer Lett 2008; 264:63-70; PMID:18329790; http://dx.doi.org/10.1016/j.canlet.2008.01.023
- Fujiwara K, Iwado E, Mills GB, Sawaya R, Kondo S, Kondo Y. Akt inhibitor shows anticancer and radiosensitizing effects in malignant glioma cells by inducing autophagy. Int J Oncol 2007; 31:753-60; PMID:17786305
- Chiu HW, Ho SY, Guo HR, Wang YJ. Combination treatment with arsenic trioxide and irradiation enhances autophagic effects in U118-MG cells through increased mitotic arrest and regulation of PI3K/Akt and ERK1/2 signaling pathways. Autophagy 2009; 5:472-83; PMID:19242099; http://dx.doi.org/10.4161/auto.5.4.7759
- Kanzawa T, Germano IM, Komata T, Ito H, Kondo Y, Kondo S. Role of autophagy in temozolomide-induced cytotoxicity for malignant glioma cells. Cell Death Differ 2004; 11:448-57; PMID:14713959; http://dx.doi.org/10.1038/sj.cdd.4401359
- Lefranc F, Kiss R. Autophagy, the Trojan horse to combat glioblastomas. Neurosurg Focus 2006; 20(4):E7; PMID:16709038; http://dx.doi.org/10.3171/foc.2006.20.4.4
- Zhivotovsky B, Joseph B, Orrenius S. Tumor radiosensitivity and apoptosis. Exp Cell Res 1999; 248:10-17; PMID:10094808; http://dx.doi.org/10.1006/excr.1999.4452
- Aoki H, Kondo Y, Aldape K, Yamamoto A, Iwado E, Yokoyama T, Hollingsworth EF, Kobayashi R, Hess K, Shinojima N, et al.. Monitoring autophagy in glioblastoma with antibody against isoform B of human microtubule-associated protein 1 light chain 3. Autophagy 2008; 4:467-75; PMID:18259115; http://dx.doi.org/10.4161/auto.5668
- Pirtoli L, Cevenini G, Tini P, Vannini M, Oliveri G, Marsili S, Mourmouras V, Rubino G, Miracco C. The prognostic role of Beclin 1 protein expression in high-grade gliomas. Autophagy 2009; 5:930-6; PMID:19556884; http://dx.doi.org/10.4161/auto.5.7.9227
- Li Z, Chen B, Wu Y, Jin F, Xia Y, Liu X. Genetic and epigenetic silencing of the beclin 1 gene in sporadic breast tumors. BMC Cancer 2010; 10:98; PMID:20230646; http://dx.doi.org/10.1186/1471-2407-10-98
- Qu X, Yu J, Bhagat G, Furuya N, Hibshoosh H, Troxel A, Rosen J, Eskelinen EL, Mizushima N, Ohsumi Y, et al. Promotion of tumorigenesis by heterozygous disruption of the beclin 1 autophagy gene. J Clin Invest 2003; 112:1809-20; PMID:14638851; http://dx.doi.org/10.1172/JCI20039
- Chen MY, Liao WS, Lu Z, Bornmann WG, Hennessey V, Washington MN, Rosner GL, Yu Y, Ahmed AA, Bast RC Jr. Decitabine and suberoylanilide hydroxamic acid (SAHA) inhibit growth of ovarian cancer cell lines and xenografts while inducing expression of imprinted tumor suppressor genes, apoptosis, G2/M arrest, and autophagy. Cancer 2010; 117:4424-38; PMID:21491416; http://dx.doi.org/10.1002/cncr.26073
- Park JA, Kim YE, Seok HJ, Park WY, Kwon HJ, Lee Y. Differentiation and upregulation of heat shock protein 70 induced by a subset of histone deacetylase inhibitors in mouse and human embryonic stem cells. BMB Rep 2011; 44:176-81; PMID:21429295; http://dx.doi.org/10.5483/BMBRep.2011.44.3.176
- Fu J, Shao CJ, Chen FR, Ng HK, Chen ZP. Autophagy induced by valproic acid is associated with oxidative stress in glioma cell lines. Neuro Oncol 2010; 12:328-40; PMID:20308311; http://dx.doi.org/10.1093/neuonc/nop005
- Bonneau D, Longy M. Mutations of the human PTEN gene. Hum Mutat 2000; 16: 109-22; PMID:10923032; http://dx.doi.org/10.1002/1098-1004(200008)16: 2%3c109::AID-HUMU3%3e3.0.CO;2-0
- Koul D PTEN signaling pathways in glioblastoma. Cancer Biol Ther 2008; 7: 1321-5; PMID:18836294; http://dx.doi.org/10.4161/cbt.7.9.6954
- Errafiy R, Aguado C, Ghislat G, Esteve JM, Gil A, Loutfi M, Knecht E. PTEN increases autophagy and inhibits the ubiquitin-proteasome pathway in glioma cells independently of its lipid phosphatase activity. PLoS One. 2013; 8:e83318; PMID:24349488; http://dx.doi.org/10.1371/journal.pone.0083318
- Sarkar S. Regulation of autophagy by mTOR-dependent and mTOR-independent pathways: autophagy dysfunction in neurodegenerative diseases and therapeutic application of autophagy enhancers. Biochem Soc Trans. 2013; 41:1103-30; PMID:24059496; http://dx.doi.org/10.1042/BST20130134
- Sivridis E, Giatromanolaki A, Liberis V, Koukourakis MI. Autophagy in endometrial carcinomas and prognostic relevance of 'stone-like' structures (SLS): what is destined for the atypical endometrial hyperplasia? Autophagy 2011; 7:74-82; PMID:21099253; http://dx.doi.org/10.4161/auto.7.1.13947
- Koukourakis MI, Giatromanolaki A, Sivridis E, Pitiakoudis M, Gatter KC, Harris AL. Beclin 1 over- and underexpression in colorectal cancer: distinct patterns relate to prognosis and tumour hypoxia. Br J Cancer 2010; 103:1209-14; PMID:20842118; http://dx.doi.org/10.1038/sj.bjc.6605904