
Abstract
Mechanistic target of rapamycin (mTOR) is a master regulator of cell growth through its ability to stimulate ribosome biogenesis and mRNA translation. In contrast, the p53 tumor suppressor negatively controls cell growth and is activated by a wide range of insults to the cell. The mTOR and p53 signaling pathways are connected by a number of different mechanisms. Chemotherapeutics that inhibit ribosome biogenesis often induce nucleolar stress and activation of p53. Here we have investigated how the p53 response to nucleolar stress is affected by simultaneous mTOR inhibition in osteosarcoma and glioma cell lines. We found that inhibitors of the mTOR pathway including rapamycin, wortmannin, and caffeine blunted the p53 response to nucleolar stress induced by actinomycin D. Synthetic inhibitors of mTOR (temsirolimus, LY294.002 and PP242) also impaired actinomycin D triggered p53 stabilization and induction of p21. Ribosomal protein (RPL11) is known to be required for p53 protein stabilization following nucleolar stress. Treatment of cells with mTOR inhibitors may lead to reduced synthesis of RPL11 and thereby destabilize p53. We found that rapamycin mimicked the effect of RPL11 depletion in terms of blunting the p53 response to nucleolar stress. However, the extent to which the levels of p53 and RPL11 were reduced by rapamycin varied between cell lines. Additional mechanisms whereby rapamycin blunts the p53 response to nucleolar stress are likely to be involved. Indeed, rapamycin increased the levels of endogenous MDM2 despite inhibition of its phosphorylation at Ser-166. Our findings may have implications for the design of combinatorial cancer treatments with mTOR pathway inhibitors.
Abbreviations
| Act D | = | actinomycin D |
| BrdU | = | bromodeoxyuridine |
| CHX | = | cycloheximide |
| DMSO | = | dimethylsulphoxide |
| DOX | = | doxorubicin |
| EGCG | = | epigallocatechin-3-gallate |
| FACS | = | fluorescence-activated cell sorting |
| 5-FU | = | 5-fluorouracil |
| MPA | = | mycophenolic acid |
| mTOR | = | mechanistic target of rapamycin |
| MTT | = | (3-[4, 5-dimethylthiazol-2-yl]-2, 5 diphenyl tetrazolium bromide) |
| PI | = | propidium iodide |
Introduction
Cancer cells often display an elevated production of ribosomes to sustain their rapid growth and proliferation. Ribosome biogenesis and especially transcription of the rRNA genes by RNA pol I is a re-emerging and promising target in anti-cancer therapy. Ribosome biogenesis is regulated by a number of oncogenes and tumor suppressors including Myc, p53 and PTEN.Citation1 Ribosome biogenesis is deregulated in human diseases including cancer and in a number of syndromes collectively known as ribosomopathies.Citation2 The p53 tumor suppressor is activated by a wide range of insults to the cell including DNA damage, oncogene activation and hypoxia.Citation3 In turn, p53 trans-activates a set of target genes that control cell cycle arrest, apoptosis, autophagy, DNA repair, cell senescence, differentiation, and metabolism.Citation3 p53 is tightly controlled by the MDM2 E3 ligase oncoprotein that targets it for nuclear export and proteasomal degradation.Citation4 Under normal conditions p53 is present at a low level, but increases as a consequence of cellular stress. The elevation in p53 protein usually stems from a disrupted MDM2-p53 interaction.Citation4 A deficiency in ribosome biogenesis elicits a p53-dependent cellular stress response referred to as “nucleolar stress” or “ribosomal stress”.Citation5 Measurable effects of nucleolar stress include p53 activation and induction of p21. Morphological effects such as changes in nucleolar size or translocation of nucleolar proteins to the nucleoplasm can also be seen and quantified in stressed cells. Nucleolar stress activates p53-dependent signaling pathways that lead to cell cycle arrest, apoptosis, differentiation or senesc-ence.Citation6-Citation8 The mechanism(s) by which p53 is activated following nucleolar stress is only partially understood. One model suggests that p53 is stabilized and activated by default when normal nucleolar function is disrupted due to an essential function of the nucleolus in catalyzing p53 protein degradation.Citation9 A second model implies that a subset of ribosomal proteins bind to the MDM2 protein following disruption of ribosome biogenesis leading to inhibition of its E3 ligase activity thus causing p53 stabilization and activation.Citation7 The ribosomal proteins that bind to MDM2 include RPL5, RPL11 and RPL23 among others, and ribosomal protein binding to MDM2 may play a role in regulating subcellular localization of MDM2 or the MDM2/p53 complex.Citation9-Citation13 Stabilization of p53 in response to nucleolar stress requires de novo synthesis of RPL11 and RPL5, and these 2 ribosomal proteins regulate p53 as part of the 5S ribonucleoprotein particle (5S RNP), in which also the 5S rRNA is a critical component.Citation14-Citation16 A number of chemotherapeutic agents trigger nucleolar stress and one example is actinomycin D (Act D), a DNA intercalating molecule and inhibitor of cancer cell proliferation. Low concentrations of Act D (1–10 nM) preferentially inhibit Pol I-mediated transcription of the rRNA genes and activate p53 through the nucleolar stress pathway.Citation17
Another inhibitor of cancer cell growth and proliferation is rapamycin. Rapamycin blocks mTOR, the catalytic subunit of the 2 molecular complexes mTORC1 and mTORC2.Citation18 Specifically, rapamycin suppresses mitogen and amino acid induced activation of mTOR and the translation of 5´TOP mRNAs mediated by mTOR-S6K1 pathway.Citation19 The mTORC1 complex plays an important role, integrating growth factor and stress signals to regulate cell cycle progression and ribosome biogenesis.Citation20 Deregulated mTORC1 signaling is considered a major driving force in cancer progression, and activated mTORC1 phosphorylates several important downstream targets involved in mRNA translation including S6K1 kinase and the translational repressor protein 4E-BP1.
The mTOR and p53 pathways are connected through a number of different mechanisms.Citation21 For example, the mTOR-S6K1 pathway is activated in response to genotoxic stress and in turn S6K1 binds and inhibits MDM2.Citation22 On the other hand, p53 transcriptionally induces a number of genes involved in suppression of the mTOR pathway including Sestrin1/2 and TSC2.Citation23 Moreover, inhibition of mTOR may engage the Akt kinase through a feedback mechanism to phosphorylate MDM2 causing stabilization of MDM2 and subsequent reduction of p53.Citation24 There are numerous previous reports showing that PI3K/mTOR pathway inhibitors impair p53´s functions.Citation25-Citation27 To further explore and clarify the inhibitory effect on p53 by mTOR inhibitors, we analyzed the regulation of p53 upon simultaneous induction of nucleolar stress by Act D and inhibition of mTOR. We used a low concentration (5 nM) of Act D that does not induce a DNA damage response but induces a nucleolar stress response.Citation28 Given that nucleolar stress may contribute to the therapeutic efficacy of RNA pol I inhibitors (for example Act D and CX-5461) it is of critical importance to study the interplay of these drugs with other compounds.Citation29
Results
Rapamycin blunts the p53 response to nucleolar stress induced by Actinomycin D
We started by treating U2OS osteosarcoma cells (wild type p53) with Act D (5 nM) or nutlin-3 alone or in combination with rapamycin. Nutlin-3 was used as a comparison because we reasoned that the effect of a small molecule that directly disrupts p53-MDM2 binding thereby causing p53 accumulation by default would be relatively insensitive to the inhibition of mTOR and also not be affected by ribosomal protein-MDM2 interaction. Nutlin-3 activates p53 by disruption of the p53-MDM2 protein-protein interaction and without inducing nucleolar stress.Citation30 Rapamycin was given as a pre-treatment or added at the same time as Act D or nutlin-3. Both Act D and nutlin-3 stabilized p53 and induced the p53 target gene p21 in U2OS cells (). We found that rapamycin impaired the induction of p21 protein in response to Act D. Rapamycin also reduced the levels of p21 in the case of nutlin-3 treatment but to a lesser extent. The reduction in p21 occurred regardless of whether the cells were pre-treated with rapamycin or if the drugs where added simultaneously. To reduce Act D-induced p53 protein levels in U2OS cells required at least one hour pre-treatment with rapamycin (data not shown). Next, we used the U343MGa Cl2:6 glioma cell line (wt p53) to extend these findings to another cell line. Single treatment with Act D or nutlin-3 stabilized p53 and induced p21 also in the glioma cells (Fig. S1A). Rapamycin impaired induction of p53 and p21 in U343MGa Cl2:6 cell cultures treated with Act D and did also reduce the levels of p53 and p21 in cells exposed to nutlin-3. The reduction in p53 levels in U343MGa Cl2:6 cells took place regardless of whether the cells were pre-treated with rapamycin or if the drugs where added at the same time (Fig. S1A). The effect of rapamycin on nutlin-induced p53 and p21 was however most evident in the pre-treatment setting.
Figure 1. Rapamycin blunts the p53 response to Act D. (A) U2OS cells were treated with single administrations of Act D (5 nM), nutlin-3 (10 μM) or rapamycin (100 nM) or in combinations as indicated in the figure. Cells were either pre-treated (pre.) with rapamycin for 6 hours before adding Act D or nutlin-3. Act D and nutlin-3 were also added simultaneously (simult.) with rapamycin. Cell extracts were prepared after 18 hours of incubation with the drugs and the relative levels of p53 and p21 determined by immunoblotting. β-actin served as a loading control. (B) Morphology of U2OS cells treated with Act D, rapamycin (R), and nutlin-3 and combinations before harvest for protein analysis. (C) Cell viability in U2OS cultures was measured by the MTT assay for the different treatment combinations. Equal numbers of cells were seeded in 6-well plates at the start of the experiment. The next day, control cells were mock-treated, while experimental cells were pre-treated with rapamycin (100 nM) for 6 hours and thereafter Act D (5 nM) and nutlin-3 (10 μM) respectively was added to the cells for 18 hours. MTT assay was carried out and absorbance was measured and expressed in arbitrary units (a.u). Shown is the mean ± SD derived from 3 independent experiments each conducted in triplicate. The paired t-test was used to determine any statistical significance between rapamycin and rapamycin + Act D treated cell cultures (* p < 0.05). (D) Effect of Act D, nutlin-3 and rapamycin on cell proliferation. Shown is the mean ± SD based on 3 independent experiments each performed in triplicate. The number of cells on control dishes was set to 100%. The paired t-test was used to calculate any statistical significance between nutlin-3 and nutlin-3 + rapamycin treated cells (* p < 0.05). (E) Effect of Act D, nutlin-3, rapamycin or combinations of the drugs on the cell cycle profile of U2OS cells according to FACS-PI analysis. (F) Percentage of S-phase cells according to FACS-PI for the different treatments (mean ± SD, **p < 0.01 ).
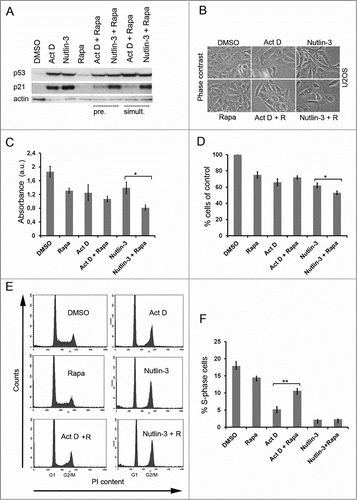
The different effect of rapamycin on Act D versus nutlin-3 with regard to p21 suggested that U2OS cells may respond differently to combinations of these drugs. Visual inspection indicated that U2OS cell cultures treated with both nutlin-3 and rapamycin had fewer cells and had acquired a more flat morphology than the cells in cultures co-treated with Act D and rapamycin (). We therefore measured the viability of the cells by the 3-[4,5-dimethylthiazol-2-yl]-2,5 diphenyl tetrazolium bromide (MTT) assay. All 3 compounds, Act D, rapamycin and nutlin-3 inhibited U2OS cell proliferation approximately to the same extent, ∼30%, as measured after 24 hours (). Interestingly, the combination of nutlin-3 and rapamycin suppressed cell growth more than the combination of Act D and rapamycin (0.81 ± 0.08 a.u. vs. 1.01 ± 0.08 a.u., p<0 .05, a.u – arbitrary units). Analysis of proliferation by cell counting confirmed that co-treatment with Act D and rapamycin had no additive or synergistic growth suppressive effect compared with Act D alone (). In fact, a slight increase in the number of cells was noted in cells treated with both Act D and rapamycin but this did not reach statistical significance. In contrast, co-treatment of cells with nutlin-3 and rapamycin resulted in significantly fewer cells compared with nutlin-3 single treatment (53.7 ± 2.3% versus 62.3 ± 3.1% of control, p<0 .05) (). To further study the biological consequences of the impaired induction of p21 we examined the cell cycle profile of U2OS cells treated with different combinations of rapamycin, Act D and nutlin-3. Applied as single agents, both nutlin-3 and Act D inhibited progression through the cell cycle resulting in a prominent accumulation of cells in G1 and G2/M phases, and lower amounts of cells in S-phase, while the effect of rapamycin single treatment was much less pronounced (). Interestingly, rapamycin and Act D co-treatment significantly increased the percentage of cells in S phase when compared to Act D single treated cells (10.7 ± 0.7 vs. 5.2 ± 0.8%, p<0 .01) (). No significant effects on S-phase, G1, or G2/M fractions were seen in the case of rapamycin and nutlin-3 co-treated U2OS cells versus nutlin-3 single treatment. To determine if rapamycin modulates the activity of other p53 regulated genes besides p21, we also analyzed the protein levels of WIG1 (also known as ZMAT3/PAG608), PUMA and MDM2. Act D treatment markedly elevated the level of MDM2. The induction of MDM2 by nucleolar stress was reduced by rapamycin although single treatment with rapamycin elevated the basal levels of MDM2 (see ). Rapamycin did not affect levels of WIG1 and marginally reduced the levels of PUMA (Fig. S1B). We conclude that rapamycin significantly affected the cellular stress response to Act D by reducing levels of p21 and this was correlated to an altered cell cycle profile.
Figure 2. Rapamycin impairs the p53 response to nucleolar stress. (A) U2OS cells growing on coverslips in 6-well plates were exposed to mycophenolic acid (MPA, 10 μM), 5-fluorouracil (5-FU, 25 μM), doxorubicin (Dox, 1μM), or Act D (5 nM) overnight. Cells were immunostained for nucleolin (red), p53 (green) and counterstained with DAPI to visualize the nuclei (blue) in the upper panel. Objective 100x. In the lower panel 5-FU treated cells were stained for NPM1/B23 and fibrillarin. Objective 63x. (B) U2OS cells were pre-treated with rapamycin (100 nM) or DMSO (control) followed by addition of 5-FU (25 μM), MPA (10 μM) or Dox (1 μM). Protein extracts were made from the cells. Levels of p53 and p21 proteins were determined by immunoblotting. β-actin served as a loading control. (C) As in panel B but U343MGa Cl2:6 cells were used instead. (D) U2OS cells were treated with DMSO (control), 5nM Act D, 25 μM 5-FU, or 1 μM DOX alone or in combination with rapamycin (100 nM as simultaneous treatment) for a total of 18 hours and then pulsed with BrdU for another 6 hours. Coverslips were fixed and immunostained for BrdU incorporation. Data represent a triplicate experiment with at least 200 cells scored per experiment and treatment combination. Shown is percent BrdU positive cells (mean ± SD, *p < 0.05, n.s. – non-significant).
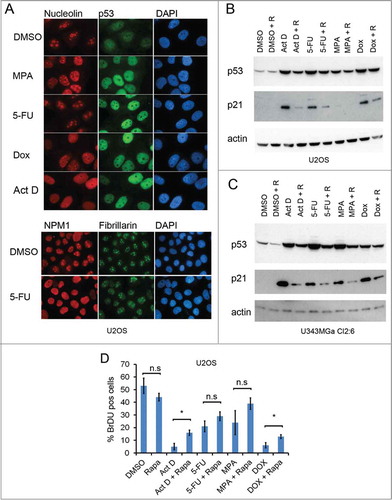
Figure 3. Synthetic mTOR inhibitors blunt the p53 response to nucleolar stress. (A) U2OS cells were treated overnight with temsirolimus (100 nM), PP242 (200 nM), LY294.002 (500 nM) or rapamycin (100 nM) and thereafter fixed and stained for nucleolin (red) and p53 (green). The DMSO vehicle was used as a control. Cells were counterstained with DAPI to visualize the nuclei. Objective 100x. (B) Cultures of U2OS cells were pre-treated with rapamycin for 6 hours (duplicate samples) at concentrations between 5 nM and 500 nM as indicated in the figure. One of the sample sets was then exposed to medium containing Act D (5 nM) and all samples were incubated for another 18 hours. Relative levels of p53, p21 and p-S6K1 (Thr389) were determined by immunoblotting. (C) Similar to B, but U343MGa Cl2:6 cells were used instead. (D) Cultures of U2OS cells were treated with temsirolimus (duplicate samples) at concentrations between 50 nM and 10 μM as indicated for 6 hours. The second set of temsiroliumus treated samples was then also given Act D (5 nM) for the following 18 hours while the other set was exposed to DMSO (control vehicle). Protein extracts were made from each sample and the relative levels of p53, p21, total S6K1, and p-S6K1 (Thr389) were monitored. (E) Similar to panel B, but PP242 was used instead of temsirolimus. (F) U2OS cells were treated with Act D (5 nM) or nutlin-3 (10 μM) alone or in combinations with temsirolimus (100 nM), LY294.002 (500 nM) or PP242 (200 nM). The cells were pre-treated with the mTOR inhibitors for 6 hours before adding Act D or nutlin-3. Relative levels of p53 and p21 were determined by immunoblotting.
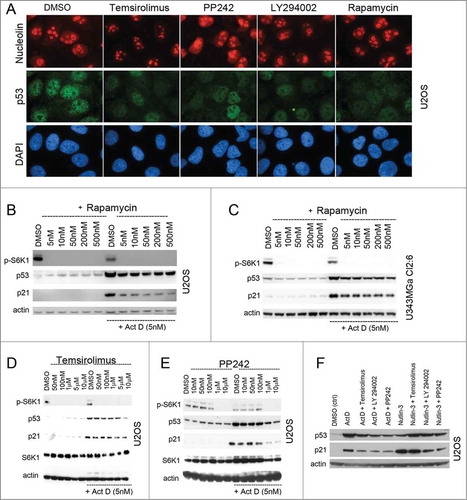
Figure 4. Natural compound inhibitors of the mTOR pathway and their effect on the levels of p53 and p21 alone or following nucleolar stress. (A) U2OS cells were pre-treated with rapamycin and natural compound inhibitors for 6 hours in duplicate samples and thereafter one of these sample sets was treated with Act D and incubated for an additional 18 hours. Cells were harvested, protein lysates prepared, and the relative levels of p53, p21, S6K1, and p-S6K1 (Thr389) were determined by immunoblotting. β-actin served as a loading control. Concentrations of compounds were as follows; rapamycin 2.74 μM; wortmannin 0.4 μM; caffeine 1 mM; resveratrol 25 μM; curcumin 20 μM; EGCG 25 μM; and Act D 5 nM. (B) Morphology of U2OS cells treated with the indicated compounds. (C) U2OS cells were treated for 18 hours with a low (5 nM) or high (1 μM) concentration of Act D and subsequently immunofluorescence stained for cleaved caspase-3. (D) Quantification of cleaved caspase-3 positive cells in different treatments. Approximately 1000 cells in 3 different low power fields were evaluated for each treatment and results are presented as % cleaved caspase-3 positive cells (mean ± SD). (E) U343MGa Cl2:6 glioma cells were pre-treated with rapamycin or various natural compounds for 6 hours and then actinomycin D (5 nM) was added as indicated. Cells were harvested, proteins extracted and the levels of p53 and p21 relative to the DMSO control were determined by immunoblotting. Concentrations of the compounds used were as follows; rapamycin 2.74 μM; wortmannin 0.4 μM; caffeine 1 mM; resveratrol 25 μM; curcumin 20 μM; EGCG 25 μM; dexamethasone 1 mM; and actinomycin D 5 nM. Dexamethasone (Dex) was included in this experiment as a possible regulator of p53.Citation73
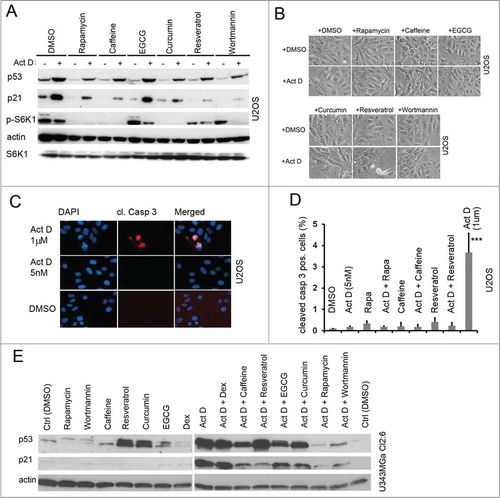
Figure 5. Caffeine inhibits the p53 response to nucleolar stress. (A) U2OS cells were pre-treated for 12 hours with caffeine at concentrations between 50 μM and 3 mM in duplicate. One set of caffeine treated samples was then given Act D (5 nM) and then all samples were incubated for another 18 hours. Relative levels of p53 and p21 were determined by immunoblotting. Level of tubulin was used as a loading control. (B) U2OS cells were treated with combinations of caffeine (3 mM) and Act D (5 nM) or 5-FU (25 μM). Relative levels of p53 and p21 were determined by immunoblotting with β-actin as a loading control. (C) Cultures of U343MGa Cl2:6 cells were pre-treated with caffeine (duplicate samples) at concentrations between 50 μM and 5 mM as indicated in the figure. One of the sample sets was then exposed to medium containing Act D (5 nM) and all samples were incubated for another 18 hours. Relative levels of p53, p21 and p-S6K1 (Thr389) were determined by immunoblotting.
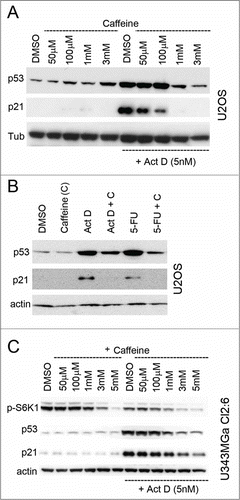
Figure 6. Silencing of RPL11 mimics the effect of rapamycin on the p53/21 response to nucleolar stress. (A) Combined siRNA/Act D experiment conducted in a sequential fashion. At zero time point U2OS cells were transfected with siRNA directed against RPL11 or siCtrl (final concentration 20 nM). After 18 hours the cells were treated with Act D (5 nM) and some of the samples as indicated were at this time transfected with siRNA targeting MDM2 (siMDM2). After an additional 18 hours of incubation the cells were harvested and extracted of proteins and level of MDM2, p21, p53, β-actin and RPL11 determined by immunoblotting (36 hours after time zero). (B) U2OS cells were transfected with siRNA-1 targeting RPL11 or siCtrl overnight. Cells were thereafter treated with nutlin-3 (10 μM) or Act D (5 nM) for an additional 18 hours. The blotting membrane was probed for RPL11, MDM2, p53, p21, and β-actin. (C) Real-time quantitative PCR (qRT-PCR) was employed to measure relative p21 mRNA levels (a.u, arbitrary units). U2OS cells were treated with rapamycin, rapamycin + Act D, or transfected with siRNA targeting RPL11 (siRPL11–1) and total RNA was prepared. Expression of p21 mRNA was normalized to that of GAPDH mRNA for each sample. (D) Similar to C, but U343MGa Cl2:6 cells were used.
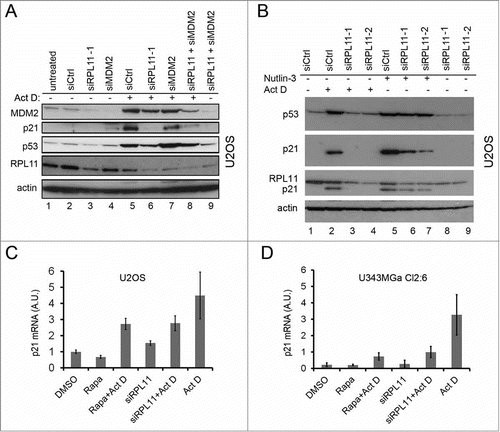
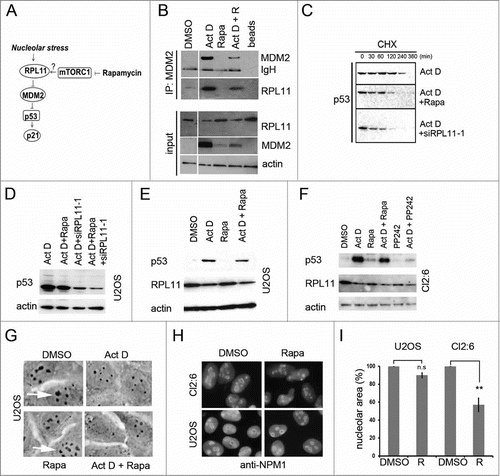
Figure 7. Regulation of RPL11 and MDM2 levels by rapamycin. (A) Schematic drawing of the interplay between mTOR and p53 pathways, indicating the potential role of mTOR in regulating MDM2 function through increased RPL11 synthesis in situations of nucleolar stress. (B) MDM2-RPL11 co-immunoprecipitation revealed a reduced complex formation of MDM2-RPL11 in cells treated with rapamycin and Act D (5nM) compared to cells treated with Act D only. Mouse monoclonal anti-MDM2 (SMP14) was used to immunoprecipitate MDM2 overnight and a rabbit polyclonal was used to detect RPL11 by immunoblotting. MDM2 was detected with SMP14. The DMSO control lane was cut from a distant part of the same gel blot and same exposure lenghts. (C) A CHX half-life assay was conducted to analyze the degradation rate of p53 in cells treated with Act D alone or in combination with either rapamycin or RPL11 siRNA. CHX (50 μg/ml final concentration) was added to the medium for the time points indicated. Exposures of the p53 blots were chosen to facilitate comparison of p53 degradation by showing a p53 signal at the zero time point as similar as possible in the 3 different blots. (D) Levels of p53 in U2OS cells treated with Act D only or Act D in combination with rapamycin (R, 100 nM), RPL11 siRNA, or RPL11 siRNA in a combination with rapamycin. (E) U2OS cells were treated with Act D (5 nM), rapamycin (2.74 μM), or a combination of Act D and rapamycin. Levels of p53 and RPL11 were determined by immunoblotting relative to β-actin loading control. (F) U343MGa Cl2:6 cells were treated with Act D (5 nM), rapamycin (2.74 μM), or a combination of Act D and rapamycin. PP242 (200 nM) was also included alone or in combination with Act D. Levels of p53 and RPL11 were determined by immunoblotting relative to β-actin loading control. (G) Phase contrast images of U2OS cells depicting the nucleolar morphology. Nucleoli are indicated with white arrows. (H) U2OS and Cl2:6 cells respectively growing on coverslips in 6-well plates were exposed to rapamycin for 30 hours. Cells were immunostained for NPM1/B23 and counterstained with DAPI to visualize the nuclei. (I) Quantification of nucleolar areas in U2OS and Cl2:6 cells treated with rapamycin. The average total nucleolar area per cell is shown as % of the control cell area. Nucleoli from at least 30 cells were evaluated for each treatment and cell type (**, p<0 .01).
Rapamycin blunts the p53 response to nucleolar stress induced by chemotherapeutic agents
We next addressed the question of whether the blunted p53 response is a general effect of rapamycin in a situation of nucleolar stress or if this is seen only when rapamycin is combined specifically with Act D. Hence, rapamycin was tested together with other chemotherapeutic drugs known to induce nucleolar stress, namely doxorubicin (DOX), 5-fluorouracil (5-FU) and mycophenolic acid (MPA).Citation31-Citation33 To first confirm the effects on the nucleolus as consistent with nucleolar stress, we stained cells both for p53 and the major nucleolar protein nucleolin/C23 (). Act D, DOX and MPA induced a dramatic change in the nucleolar morphology as revealed by nucleolar shrinkage and translocation of nucleolin into the nucleoplasm and a robust increase in nuclear p53 immunoreactivity (, upper panel). In the case of 5-FU, translocation of nucleolin to the nucleoplasm was not observed. However, 5-FU treatment induced translocation of the nucleolar protein NPM1/B23 to the nucleoplasm and also affected the localization of fibrillarin within the nucleoli (, lower panel). When combining these nucleolar stress inducing drugs with rapamycin we consistently detected reduced levels of p53 and p21 proteins by immunoblotting in both U2OS and U343MGa Cl2:6 cell lines ( ,C). To investigate if rapamycin treatment attenuates bromodeoxyuridine (BrdU) incorporation in U2OS cells treated with nucleolar stress inducing agents we performed a BrdU labeling assay. U2OS cells were treated with DMSO (control), 5nM Act D, 25 μM 5-FU, or 1 μM DOX alone or in combination with rapamycin (100 nM as a simultaneous treatment) for a total of 18 hours and then pulsed with BrdU for another 6 hours. Rapamycin significantly increased the number of BrdU positive cells in U2OS cell cultures treated with Act D and DOX. Changes in the case of 5-FU and MPA did not reach statistical significance, although a trend with increased BrdU labeling of cells upon co-treatment with Rapamycin was noted (). Thus, rapamycin´s ability to blunt the p53 response and affect the cell cycle is not restricted to nucleolar stress induced by Act D.
Synthetic inhibitors of the mTOR pathway blunt the p53 response to nucleolar stress
To further investigate the effect of mTOR inhibition on the p53 response to nucleolar stress, we tested synthetic inhibitors of mTOR (temsirolimus, PP242, and LY294.002) in combination with Act D or nutlin-3. Temsirolimus (CCI-779) is a rapamycin derivative, while LY294.002 is a morpholine derivative of quercetin and an inhibitor of PI3Ks as well as mTOR at higher concentrations.Citation34 PP242 is a potent selective ATP-competitive inhibitor of mTORC1 and mTORC2. PP242 inhibits mTORC1/2 with a high degree of selectivity relative to the PI3Ks.Citation35 To first investigate the effects of these mTOR inhibitors on the nucleolus we stained cells for both p53 and nucleolin. There was slightly less nuclear p53 immunoreactivity in cells treated with rapamycin, PP242, temsirolimus, or LY294.002 only compared to control and nucleoli remained intact (). As expected, rapamycin blocked phosphorylation of the mTOR target protein S6K1 (Thr389) at nanomolar concentrations and reduced the levels of Act D induced p53 and p21 in U2OS and also in U343MGa Cl2:6 ( and C). Both PP242 and temsirolimus inhibited S6K1 phosphorylation but at strikingly different concentrations ( and E). After pre-incubating U2OS cells with temsirolimus or PP242 using a wide range of concentrations we exposed the cells to Act D (5 nM) as before. Both temsirolimus and PP242 reduced the levels p53 and p21 in Act D treated cells. PP242 suppressed the levels of p53 and p21 more efficiently than did rapamycin and temsirolimus once inhibition of S6K1 phosphorylation was complete. Nonetheless, reduction in p53 and p21 correlated with the loss of S6K1 phosphorylation in each case ( and E). We next used PP242, temsirolimus and LY294.002 and compared their effects on Act D and nutlin-3 induced activation of p53 and p21 in U2OS cells side-by-side. These mTOR inhibitors efficiently reduced the levels of p53 and p21 in cells exposed to Act D while having marginal effects on p53 and p21 levels in cells exposed to nutlin-3 (). We conclude that several synthetic direct inhibitors of mTOR inhibited the nucleolar stress induced p53/p21 response as hypothesized.
Natural compounds that inhibit the mTOR pathway blunt the p53 response to nucleolar stress
We next aimed to determine if the p53 response to nucleolar stress was affected by natural compounds that may inhibit mTOR. These included besides rapamycin also wortmannin, caffeine, resveratrol, epigallocatechin-3-gallate (EGCG), and curcumin.Citation36-Citation42 We evaluated the compounds individual effects on p53 and p21, and used phosphorylation of S6K1 at residue Thr389 as a read-out for mTOR activity. We did this by incubating U2OS cells using a wide span of concentrations for each compound (data not shown). On basis of those results and literature searches we selected suitable concentrations of the compounds and we used them alone or in combination with Act D in a comparative experiment. We found that several of the inhibitors, similar to rapamycin, to some extent decreased the amount of total p53 in Act D treated cells, while the effect of EGCG was minor (). Thus, pre-treatment with the compounds impaired p53 mediated p21 induction by Act D (5 nM), with the exception of EGCG. To determine how these compounds affected the activity of the mTOR pathway, we again analyzed phosphorylation of S6K1. Rapamycin, caffeine and curcumin completely blocked phosphorylation of S6K1 while EGCG, resveratrol and wortmannin treated cells displayed residual Thr389 phosphorylation (). Act D had a minor inhibitory effect on S6K1 phosphorylation on its own. Even more so, Act D in combination with wortmannin led to efficient suppression of S6K1 phosphorylation (). It is known previously that activated p53 suppresses phosphorylation of S6K1 and global protein synthesis.Citation23 The levels of p21 may drop sharply in cells undergoing apoptosis. Therefore we monitored the cells for signs of cell death during treatment including staining for cleaved caspase-3, emergence of floating cells or condensation of DNA. However, all of the compounds at the concentrations specified were well tolerated by U2OS cells that remained viable (). In contrast, treatment of the cells with a high concentration of Act D (1 μm) induced a highly significant (p<0 .001) increase in the number of cleaved caspase-3 positive cells (3.6 ± 0.9% vs. 0.1% in control) (). There was no significant increase in the percentage of apoptotic cells for any of the other treatment combinations (, and data not shown). To exclude potential cell-type specific effects, p53 and p21 levels were also analyzed in U343MGa Cl2:6 glioma cells. We found that the p53 response to Act D as measured by p21 induction was suppressed by rapamycin, wortmannin, caffeine, and resveratrol whereas a marginal suppression was observed in the cases of curcumin and EGCG (). Notably, there was an increase in the basal level of p53 in Cl2:6 cells exposed to resveratrol and curcumin as single treatments (). Resveratrol can induce p53 in other cell types however it is inefficient in inducing p53 in U2OS.Citation43,44 Resveratrol did not completely inhibit S6K1 phosphorylation and only partially blocked p21 induction in the setting of nucleolar stress (). In summary, the dampening effects on p53/p21 induction were generally seen with rapamycin, wortmannin and caffeine. Curcumin, resveratrol and EGCG displayed subtle and/or cell type specific effects on the p53 response to nucleolar stress.
Of particular interest was the effect of caffeine on p53 and the nucleolar stress response. Caffeine inhibits several PI3-like kinases but preferentially inhibits mTOR, and coffee intake may cause a 4–8% inhibition of mTORC1 activity in humans.Citation45 We found that millimolar concentrations of caffeine effectively prevented p53 and p21 accumulation induced by Act D (). Physiological concentrations of caffeine in the range of 50–100 μM also impaired p21 induction in U2OS cells, but had little effect on p53 levels (). In addition, caffeine impaired p53 accumulation by 5-FU (). We could confirm the effect of a high concentration of caffeine on the levels of p53 and p21 in U343MGa Cl2:6 cells and there was an effect on S6K1 phosphorylation. However, a negative effect on p21 at physiological caffeine concentrations was not observed in U343MGa Cl2:6 cells (). Nonetheless, our results in U2OS cells indicate that caffeine may negatively affect the activity of the p53 pathway at concentrations that are physiologically relevant.
Rapamycin mimics RPL11 depletion
Fluctuations in the levels of ribosomal proteins and/or in RNA pol I transcriptional activity is an attractive and potentially unifying model to explain physiological and stress induced changes in p53 protein levels.Citation46-Citation48 Rapamycin is known to suppress the translation of 5´TOP mRNAs, including ribosomal protein mRNAs, by inhibiting the mTOR-S6K1 pathway.Citation19 RPL11 mRNA translation is de-repressed in cells suffering ribosomal/nucleolar stress.Citation49,50 Treatment of cells with rapamycin may therefore lead to reduced synthesis of RPL11, alleviated inhibition of MDM2, and de-stabilization of p53, as previously reported (see ).Citation14,46 Hence, we examined the effects on RPL11 in the setting of combined Act D induced nucleolar stress and inhibition of mTOR. To begin with, if rapamycin decreases the levels of RPL11, knockdown of RPL11 should mimic rapamycin. We therefore performed a combined and sequential siRNA/Act D treatment experiment. U2OS cells were transfected with siRNA directed against RPL11 or siCtrl and after 18 hours the cells were treated with Act D (5 nM). At this time some of the samples, as indicated, were also transfected with MDM2 siRNA. After an additional 18 hours of incubation the cells were harvested. Depletion of RPL11 resulted in reduced levels of p53 and a markedly attenuated p21 induction reminiscent of rapamycin´s effect on p53 and p21 (, lane 5 versus lane 6). The MDM2 siRNA reduced MDM2 protein with around 50% and this did not cause a marked accumulation of p53 protein but a slight increase in p21 (Fig. 6A, lane 1 vs. lane 4). MDM2 siRNA had minor effect on MDM2 levels in Act D treated cells indicating that MDM2 protein once induced by p53 in response to nucleolar stress was relatively stable. In another experiment, we transfected cells with 2 different siRNA targeting RPL11 followed by treatment of the cells with 5 nM Act D or 10 μM nutlin-3. Each of the 2 RPL11 siRNAs efficiently inhibited p53 accumulation in Act D treated cells, and the p53-dependent induction of p21 was impaired (, lane 2-4). In contrast, the effect on p53 protein levels when RPL11 was depleted in nutlin-3 treated cells was marginal, although the level of p21 was reduced (, lane 5-8). We conclude that RPL11 was not required for stabilization of p53 by nutlin-3 but may impact on p21 expression. A preferential inhibitory effect on p21 would be consistent with recruitment of RPL11 at promoter sites of p53-regulated genes following nucleolar stress and/or a role of RPL11 in the recruitment of transcriptional co-activators.Citation51 Rapamycin impairs p21 mRNA translation and marginally decreases the half-life of p21 protein but we wanted to see if rapamycin also reduced p21 mRNA transcription.Citation52 Quantitative RT-PCR analysis of p21 mRNA levels was performed using RNA isolated from U2OS cells treated with rapamycin alone or in combination with Act D. In cells treated only with Act D, there was an increase in p21 mRNA level by 4.5 ± 1.5 fold relative to the DMSO treated control (). Rapamycin reduced the induction of p21 mRNA in cells treated with Act D with 40% (2.7 ± 0.35 fold increase over control) similar to the effect of RPL11 depletion (2.8 ± 0.5 fold increase over control) (). An even more pronounced inhibition of p21 mRNA induction in Act D treated cells was confirmed to occur also in the U343MGa Cl2:6 cells when either transfected with siRPL11 or treated with rapamycin ().
Differential effects on RPL11 levels by rapamycin
Increased binding of RPL11 to MDM2 is usually seen in cells exposed to Act D ().Citation17 We found that rapamycin treatment diminished the cellular abundance of the MDM2-RPL11 complex when anti-MDM2 antibodies were used for immunoprecipitation (). If rapamycin blocks RPL11 we would expect to see changes in p53 stability. Much so, rapamycin de-stabilized p53 in a setting of nucleolar stress, however rapamycin was less efficient in doing so in comparison to cells depleted of RPL11 using siRNA (). In a side-by-side comparison, using Act D treated U2OS cells, it was apparent that depletion of RPL11 suppressed p53 levels more efficiently than did rapamycin treatment (). It has been suggested that a degradation resistant pool of RPL11 and RPL5 remains stably bound to MDM2.Citation14 We observed that long term (18 hours) Act D treatment lowered the steady-state levels of detergent soluble RPL11 in U2OS and U343MGa Cl2:6 cell cultures ( Figs. and , , and ). We did not observe such a marked reduction in RPL5 under the same conditions (Fig. S1B). A decrease in the level of RPL11 protein in cells treated with Act D has also been observed by others.Citation53–Citation55 The decline in RPL11 is possibly due to the degradation of surplus ribosomal proteins that cannot be incorporated into ribosomal particles since rRNA production is inhibited by Act D. Single treatment with rapamycin also affected the levels of RPL11, but to different extent. In U2OS cells, treatment with a high concentration of rapamycin did not reduce RPL11 ( ,E), whereas a marked reduction was seen in U343MGa Cl2:6 (). We noted that the average area size of nucleoli in U2OS cells was not affected by rapamycin (90.0 ± 2.65% of control, p>0 .05) ( H, and I). This was in contrast to the much reduced nucleolar area in U343MGa Cl2:6 cells treated with rapamycin (56.7 ± 7.4% of control, p<0 .01). One potential explanation for the reduced levels of RPL11 in U343MGa Cl2:6 cells could be the smaller nucleolar size and/or a reduced rate of ribosome biogenesis. In summary, rapamycin had different effects on the level of RPL11. The reduced level of RPL11 is likely to contribute to the blunting of the p53 response in U343MGa Cl2:6 cells.
Increased MDM2 levels in rapamycin treated cells
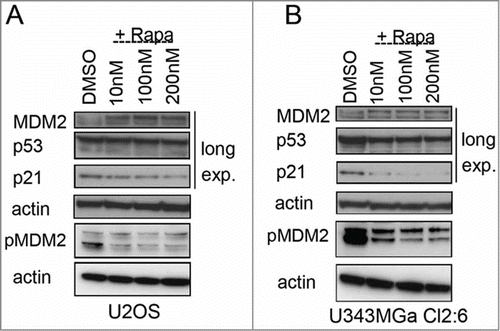
There are other potential mechanisms whereby rapamycin could impair the p53 response. Reduced p53 mRNA translation may explain the blunted p53 response.Citation52 We measured p53 synthesis but it was unimpaired in cells co-treated with Act D and different inhibitors of mTOR (Fig. S2). Another potential mechanism whereby rapamycin blunts p53 may involve the p38MAPK-AKT-mTOR-S6K1 signaling network that is activated in response to genotoxic stress.Citation22 Phosphorylated and active S6K1 binds, and phosphorylates MDM2 and inhibits its E3 ligase activity thereby stabilizing p53. We therefore investigated the role of S6K1 as a possible mediator of p53 stabilization upon nucleolar stress. Depletion of S6K1 led to an increase in p53 by itself and did not attenuate the p53 response to Act D (Fig. S3). We noted however that the basal level of MDM2 in cells treated only with rapamycin was modestly increased (). To investigate this further we analyzed levels of MDM2 using a wider range of rapamycin concentrations. We found that MDM2 levels were increased 1.5 fold by rapamycin in both U2OS cells and U343MGa Cl2:6 cells ( ,B). In contrast, phosphorylation of MDM2 at Ser 166 was decreased suggesting that the increase in MDM2 protein is not linked to an increased phosphorylation of MDM2. Taken together, blunting of the p53 response may involve increased levels of MDM2 and decreased levels of RPL11.
Figure 8. Altered levels of total and phosphorylated MDM2 in rapamycin treated cells. (A) Levels of MDM2, p-Ser166 MDM2, p53, and p21 proteins in U2OS cells exposed to rapamycin (10 nM – 200 nM) for 18 hours. (B) MDM2, p-Ser166 MDM2, p53, and p21 protein levels in U343MGa Cl2:6 cells exposed to rapamycin (10 nM – 200 nM) for 18 hours (long exp., = long exposure). Total and p-Ser166 MDM2 levels were monitored on 2 different blots but using the same cell lysates.
Discussion
The interplay between p53 and mTOR in cancer and aging continues to fascinate.Citation21 A better understanding of how mTOR and p53 pathways are connected is needed in order to improve the use of mTOR inhibitors in anti-cancer therapy. Here we investigated the outcomes of simultaneous inhibition of mTOR and activation of p53 by nucleolar stress. Nucleolar stress is often triggered by chemotherapeutic drugs (e.g. by Act D, MPA and 5-FU) and may contribute to the therapeutic efficacy of these drugs.Citation29 We found that inhibitors of the mTOR pathway impaired p53 stabilization and induction of p21 in cells treated with a low concentration of Act D. The concentrations of drugs that we used in this study are in general low and predominantly cytostatic, non-toxic for U2OS cells. In our experiments, we did not observe any synergistic cell growth inhibitory effects when combining rapamycin and a low concentration of Act D in U2OS cells. In fact, adding rapamycin to Act D treated U2OS cells increased the proportion of cells in S phase, number of BrdU positive cells, and decreased the number of G2/M cells compared to the levels seen in Act D treated cells. This correlated with a slight increase in cell number in cultures co-treated with Act D and rapamycin versus those cell cultures exposed only to Act D. Synergistic induction of apoptosis may occur upon treatment of cells with high concentrations of cytotoxic agents in combination with PI3K/mTOR inhibitors given that p21 may act as an indirect pro-survival factor.Citation52 This apoptosis may however also involve a p53-independent component, as rapamycin reportedly has a negative effect on p53 induced pro-apoptotic proteins.Citation25,56
Inhibition of the p53 response by mTOR inhibitors is presumably a general phenomenon and occurs in response to DNA damage, oncogenic stress and nucleolar stress as supported by previous literature. It is known that inhibition of mTOR pathway blunts the p53 transcriptional response to genotoxic stress (DNA damage). For instance, an attenuated p53 response to DNA damage occurred when combining PI3K/mTOR inhibitors with the DNA damaging agent Adriamycin.Citation27 The cellular senescence response was lost in prostate tumors retaining wt p53 when rapamycin was combined with γ-irradiation.Citation57 Moreover, LY294.002 blunted the doxorubicin induced p53-dependent apoptotic response caused by DNA damage.Citation25 Caffeine was shown to prevent p53 induction by a wide range of chemotherapeutic agents when used in millimolar concentration.Citation58 Several years ago we found that caffeine and wortmannin prevented p53 stabilization by oncogenic c-Myc in normal human diploid fibroblasts.Citation59
It was recently shown that the AKT kinase is phosphorylated and activated by Act D.Citation56,60 Indeed, the AKT inhibitor MK-2206 and similar compounds attenuated activation of the p53 pathway by Act D.Citation56,60 Inhibitors of AKT also reduce mTOR activity since AKT functions upstream of mTOR. An important event in the activation of the p53 response to nucleolar stress may then rely on increased AKT signaling that feeds onto mTOR. AKT is known to phosphorylate MDM2 at Ser-166. In this study, we therefore monitored the phosphorylation of MDM2 at Ser-166 in response to rapamycin. Interestingly the level of Ser-166 phosphorylation was decreased despite increased basal levels of MDM2. This finding suggests a complex pattern of p53-PI3K/AKT/mTOR pathway interactions.
How can we explain the negative effect of rapamycin and other mTOR inhibitors on the p53 response to nucleolar stress? An attractive potential mechanism is related to the RPL11-MDM2-p53 pathway.Citation7 Indeed, we found that silencing of RPL11 or rapamycin treatment led to de-stabilization of p53 in Act D treated cells and both rapamycin and siRPL11 resulted in reduced p53-dependent transcriptional activation of p21. Importantly, stabilization of p53 in nutlin-3 treated U2OS cells was relatively unaffected by RPL11 depletion or rapamycin. There was also reduced binding of RPL11 to MDM2 in Act D and rapamycin co-treated cells. Paradoxically the detergent soluble fraction of RPL11 was dramatically reduced by 18 hours also in Act D single treated cells so additional studies are required to establish the mechanisms and dynamics involved in RPL11-mediated regulation of MDM2 in response to nucleolar stress.
We noted that rapamycin appeared less efficient compared with depletion of RPL11 using siRNA, and although rapamycin reduced RPL11 levels in Cl2:6 cells, the failure of rapamycin to do so in U2OS cells pointed us toward additional mechanisms that may contribute to p53 de-stabilization. We found that the levels of MDM2, as detected with the monoclonal antibody SMP14, were increased 1.5 fold by rapamycin. While there are a number of studies describing a selective decrease in MDM2 mRNA translation by rapamycin treatment, our finding is in line with those by Genolet et al., who reported that extended rapamycin exposure under conditions of high serum (10%) resulted in an increase in the steady-state levels of endogenous MDM2 protein in the cell lines MRC-5 and HEK293T due to increased mRNA translation.Citation61 The authors suggested that this effect could represent a drug-induced cellular response to reduce p53s negative regulation of mTOR. It is conceivable that the increase in MDM2 is involved in the suppression of p53 by rapamycin, besides the reduction in RPL11. Reduced levels of RPL11 and increased levels of MDM2 may however not be the only mechanisms involved. Phosphorylation of p53 Ser46 is induced in response to Act D and phosphorylation of Ser46 is reduced by rapamycin co-treatment.Citation56 Binding of S6K1 directly to MDM2 may also play a role in p53 control.Citation22 Thus, a number of different mechanisms triggered by rapamycin treatment may converge and blunt the p53 pathway.
Interference with the p53 response by mTOR inhibitors could be of relevance in different settings. Inhibitors of the mTOR pathway have been ascribed anti-aging effects in mice, flies and worms.Citation21,35,62 One might wonder how much of these effects can be attributed to the aborted p53 response per se, this given the much debated role of p53 in mammalian aging.Citation63–Citation65 It is in this context interesting to note that resveratrol, LY294.002, and curcumin promoted somatic cell reprogramming.Citation66 Recall that p53 is a negative regulator of cellular reprogramming. If the blunting of the p53 response by mTOR inhibitors contributes to the anti-aging effects of those compounds should therefore be investigated. Perhaps one of the most important findings in this study relates to the effect of caffeine. Caffeine is a relatively potent mTOR inhibitor.Citation45,67,68 Drinking one cup of coffee may result in a plasma concentration of 1–10 μM caffeine in humans.Citation69 While the lethal levels are in the range of 200 μM and above, high levels of caffeine may in heavy consumers reach 70 μm.69 In our experiments, p53 stabilization and induction of p21 was completely blocked by a millimolar concentration of caffeine. However, caffeine impaired p21 induction by Act D in U2OS cells also in the range of 50 to 100 μM. This result indicates that caffeine may negatively affect the activity of the p53 pathway at concentrations that are physiologically relevant. Moreover, certain exposed normal cell populations in vivo are presumably more sensitive to drugs than the cell lines we have used in this study.Citation39 Our results suggest that the effects on the p53 pathway in vivo by high intake of caffeine containing beverages should be relevant to test, e g, in patients undergoing chemotherapy.
One might also wonder if the anti-aging effect of mTOR inhibitors comes at the price of higher risk of cancer. On one hand, increased cancer incidence was not reported in mice fed with rapamycin.Citation70 Moreover, caffeine as well as rapamycin have been reported to inhibit cellular transformation in vitro.Citation35 On the other hand, compounds that inhibit mTOR including resveratrol, curcumin, and caffeine have been ascribed antioxidant properties, and it was recently described how the antioxidants vitamin E and N-acetylcysteine accelerated lung cancer growth by inhibiting the p53 DNA damage response.Citation71 It is not far-fetched to speculate that mTOR inhibitors may affect tumor growth by modulation of the p53 pathway in a cell and context-dependent manner. In summary, this study and related publications highlight the complexity and potential problems with the use of mTOR inhibitors when they are combined with certain cytostatic compounds including Actinomycin D.
Material and Methods
Cell culture
Osteosarcoma cell line U2OS (wt p53) were obtained from American Type Culture Collection (Manassas, VA, USA). Glioma cell line U343MGa Cl2:6 (wt p53) has been described and characterized.Citation72 Cells were cultured in Iscove's Modified Dulbecco's medium (IMDM) containing 10% fetal bovine serum and antibiotics (100 μg of penicillin and 50 μg of streptomycin sulfate/mL) at 37°C, 5% CO2 in a humidified incubator.
Chemicals
Chemicals including DMSO where purchased from Sigma-Aldrich unless otherwise stated. Final concentrations of compounds are given in the text or figure legends. The drugs and their respective stock solutions stored at -20°C were as follows: Act D (1mM in DMSO or 1mg/ml in ethanol), nutlin-3 (10mM, DMSO), rapamycin (2.74mM, DMSO), wortmannin (4mM, DMSO), caffeine (0.4mM-6.0mM dissolved in medium), resveratrol (50mM, DMSO), curcumin (10mM, ethanol), epigallocatechin gallate (EGCG, 5mM, DMSO), doxorubicin hydrochloride (0.1M, DMSO), 5-fluorouracil (5-FU, 25mM, DMSO), mycophenolic acid (MPA, 10mM, methanol), temsirolimus (CC1–779, 10mM, DMSO), PP242 hydrate (10mM, DMSO), LY-294,002 hydrochloride (10mM, DMSO), cycloheximide (CHX, 50mg/ml, ethanol), Z-leu-leu-leu-al (MG132, 10mM, DMSO).
Cell proliferation, FACS and apoptosis analysis
The MTT (3-[4,5-dimethylthiazol-2-yl]-2,5 diphenyl tetrazolium bromide) assay (Sigma-Aldrich) was used to measure relative fraction of viable cells. Equal numbers of cells were seeded in 6-well plates in triplicates and treated as indicated and thereafter incubated with MTT and absorbance measured. For cell counting, equal numbers of cells were seeded in 6-well plates at the start of the experiment. The next day, control cells were mock-treated, while experimental cells were pre-treated with rapamycin for 6 hours and thereafter Act D or nutlin-3 was added to the cells for another 24 hours. After a total of 30 hours, the attached cells were washed, trypsinized, and counted using a hemocytometer. Bromodeoxyuridine (BrdU, Sigma-Aldrich) incorporation assays were conducted in U2OS cells to estimate DNA replication. Drug treated cells were incubated in the presence of 10 μM BrdU for 6 hours. Cells were then fixed with formalin and treated with 2M HCl containing 1% Triton X-100. The cells were stained with monoclonal anti-BrdU antibody (clone BU33, Sigma-Aldrich). BrdU-positive cells were counted in at least 3 low power magnification fields for each treatment and data presented as percent BrdU-positive cells. Apoptosis was assessed by staining for cleaved caspase-3. Cell cycle profiles were obtained on a FACScan™II flow cytometer (Becton Dickinson BD, Franklin Lakes, NJ) and analyzed using the BD CellQuestPro™ software. For the FACS analysis attached cells where trypsinized, fixed in ethanol and treated with RNase. Fixed cells were stained with propidium iodide (PI).
Statistical analysis
Experiments were usually conducted in 3 independent experiments, each in triplicate and results presented as the mean ± standard deviation (SD) unless otherwise stated. Student's t-test was used to evaluate the differences in the data between 2 groups. Statistical probability (p) was set at *p < 0.05, **p < 0.01 and ***p < 0.001. Means were considered significantly different at p < 0.05. Mean, SD and t-test were calculated in Microsoft Excel.
RNA interference
Oligofectamine was used to transfect cells in 6-well plates with siRNA according to the manufacturer´s instructions (Life Technologies). RPL11 siRNA-1 Sense: 5’ GGUGCGGGAGUAUGAGUUAdTdT 3´ Antisense: 5´ UAACUCAUACUCCCGCACCdTdT 3´ RPL11 siRNA-2 Sense: 5´ GCAUUGGUAUCUACGGCCUdTdT 3´ Antisense: 5´ AGGCCGUAGAUACCAAUGCdTdT 3´. MDM2 siRNA-1: Sense 5´AGUCUHUUGGUGCACAAAAdTdT 3´ and Antisense 5´UUUUGUGCACCAACAGACUdTdT 3´.
Quantitative real-time PCR
Total cellular RNA was extracted with TRIzol® reagent (Life Technologies). Real-time quantitative reverse transcriptase-polymerase chain reaction (qRT-PCR) was performed to monitor p21 expression. The Power SYBR® Green RNA-to-CT™ 1-Step kit was used in conjunction with an Applied Biosystems 7500 Real-Time PCR system. GAPDH was used as the internal standard reference.
Western blotting and co-immunoprecipitation
For analysis of detergent soluble proteins we used the Nonidet P-40 (NP-40) lysis buffer (50 mM Tris-HCl, pH 7.5, 150 mM NaCl, 0.5% NP-40, 50 mM NaF, 1 mM NaVO3, 1 mM dithiothreitol, 1× protease inhibitor cocktail and 1 mM phenylmethylsulfonyl fluoride). Western blotting and MDM2-RPL11 co-immunoprecipitation was conducted as describedCitation53.
Immunofluorescence
Procedures for immunofluorescence staining and microscopy analysis have been published.Citation53 The Image J program (http://rsbweb.nih.gov/ij/) was used to analyze average nucleolar area.
Antibodies
The following primary antibodies were used: mouse mAb anti-β-actin (clone AC15, Sigma-Aldrich), rabbit pAb anti-β-tubulin (ab6046), rabbit pAb anti-p21 (ab7960, Abcam), rabbit pAb anti-p53 (FL393, sc-6243, Santa Cruz), mouse mAb anti-p53 (clone DO1, Sigma-Aldrich), mouse mAb anti-RPL11 (clone 3A4A7, cat# 37–3000, Invitrogen), mouse mAb anti-MDM2 (clone SMP14, Sigma-Aldrich), rabbit anti-MDM2 pSer166 (#3521, Cell Signaling), rabbit mAb anti-p70S6K phospho-Thr389 (clone 108D2, Cell Signaling), rabbit mAb anti-p70S6K (clone 49D7, Cell Signaling), rabbit anti-cleaved caspase-3 at Asp175 (#9661, Cell Signaling), rabbit anti-RPL5 (ab86863, Abcam), rabbit anti-ZMAT3 (WIG1/PAG608) (AV50793, Sigma-Aldrich), mouse anti-NPM1/B23 (ab10530/FC82291, Abcam), rabbit anti-fibrillarin (ab5821, Abcam), and rabbit anti-PUMA (ab9643, Abcam).
Protein synthesis and protein half-life assay
To measure protein synthesis, U2OS cells growing in p60 dishes were starved in methionine/cysteine free medium (Life Technologies) supplemented with 10% dialyzed FCS for 30 minutes. Synthesis of p53 was measured in U2OS cells that were labeled with 0.4 mCi L-[35S] methionine and L-[35S] cysteine Easy Tag EXPRESS (Perkin–Elmer) for 15 minutes as indicated. Labeling was followed by immediate cell lysis. Cell lysates containing equal amounts of proteins were immunoprecipitated with rabbit anti-p53 antibody FL393 or IgG control antibody overnight at 4°C. This was followed by 30 minutes incubation with Dynabeads (GE Healthcare Life Sciences). After 3 extensive washes of the beads using 0.5% NP-40 lysis buffer the immunoprecipitated material was resolved by 4–12% SDS-PAGE and visualized by autoradiography. The turnover of protein was assessed by protein-synthesis inhibitor cycloheximide (CHX) assay.
Disclosure of Potential Conflicts of Interest
No potential conflicts of interest were disclosed.
955743_Supplementary_Materials.zip
Download Zip (792.4 KB)Acknowledgment
We thank Karl Holmberg Olausson for critical reading of the manuscript.
Funding
This work was supported by Åke Wiberg stiftelse (ML); Karolinska Institutet (ML); Magnus Bergvall's stiftelse (ML); King Gustaf V's Jubilee Foundation (ML) and the Swedish research council (K2012–99X-21969–01–3 to ML). MN was supported by grants from the Swedish Cancer Society; the Cancer Society in Stockholm; the Swedish research council; and the Stockholm County Council (SLL).
Supplemental Material
Supplemental data for this article can be accessed on the publisher's website.
References
- Bywater MJ, Pearson RB, McArthur GA, Hannan RD. Dysregulation of the basal RNA polymerase transcription apparatus in cancer. Nat Rev Cancer 2013; 13:299-314; PMID:23612459; http://dx.doi.org/10.1038/nrc3496
- Narla A, Ebert BL. Ribosomopathies: human disorders of ribosome dysfunction. Blood 2010; 115:3196-205; PMID:20194897; http://dx.doi.org/10.1182/blood-2009-10-178129
- Vousden KH, Prives C. Blinded by the Light: The Growing Complexity of p53. Cell 2009; 137:413-31; PMID:19410540; http://dx.doi.org/10.1016/j.cell.2009.04.037
- Wade M, Li YC, Wahl GM. MDM2, MDMX and p53 in oncogenesis and cancer therapy. Nature Rev Cancer 2013; 13:83-96; http://dx.doi.org/10.1038/nrc3430
- Deisenroth C, Zhang Y. Ribosome biogenesis surveillance: probing the ribosomal protein-Mdm2-p53 pathway. Oncogene 2010; 29:4253-60; PMID:20498634; http://dx.doi.org/10.1038/onc.2010.189
- Miliani de Marval PL, Zhang Y. The RP-Mdm2-p53 pathway and tumorigenesis. Oncotarget 2011; 2:234-8; PMID:21406728
- Zhang Y, Lu H. Signaling to p53: ribosomal proteins find their way. Cancer Cell 2009; 16:369-77; PMID:19878869; http://dx.doi.org/10.1016/j.ccr.2009.09.024
- Zhou X, Liao JM, Liao WJ, Lu H. Scission of the p53-MDM2 loop by ribosomal proteins. Genes & Cancer 2012; 3:298-310; PMID:23150763; http://dx.doi.org/10.1177/1947601912455200
- Boyd MT, Vlatkovic N, Rubbi CP. The nucleolus directly regulates p53 export and degradation. J Cell Biol 2011; 194:689-703; PMID:21893597; http://dx.doi.org/10.1083/jcb.201105143
- Dai MS, Lu H. Inhibition of MDM2-mediated p53 ubiquitination and degradation by ribosomal protein L5. J Biol Chem 2004; 279:44475-82; PMID:15308643; http://dx.doi.org/10.1074/jbc.M403722200
- Jin A, Itahana K, O'Keefe K, Zhang Y. Inhibition of HDM2 and activation of p53 by ribosomal protein L23. Mol Cell Biol 2004; 24:7669-80; PMID:15314174; http://dx.doi.org/10.1128/MCB.24.17.7669-7680.2004
- Lohrum MA, Ludwig RL, Kubbutat MH, Hanlon M, Vousden KH. Regulation of HDM2 activity by the ribosomal protein L11. Cancer Cell 2003; 3:577-87; PMID:12842086; http://dx.doi.org/10.1016/S1535-6108(03)00134-X
- Zhang Y, Wolf GW, Bhat K, Jin A, Allio T, Burkhart WA, et al. Ribosomal protein L11 negatively regulates oncoprotein MDM2 and mediates a p53-dependent ribosomal-stress checkpoint pathway. Mol Cell Biol 2003; 23:8902-12; PMID:14612427; http://dx.doi.org/10.1128/MCB.23.23.8902-8912.2003
- Bursac S, Brdovcak MC, Pfannkuchen M, Orsolic I, Golomb L, Zhu Y, Katz C, Daftuar L, Grabušić K, Vukelić I, et al. Mutual protection of ribosomal proteins L5 and L11 from degradation is essential for p53 activation upon ribosomal biogenesis stress. Proc Natl Acad Sci U S A 2012; 109:20467-72; PMID:23169665; http://dx.doi.org/10.1073/pnas.1218535109
- Donati G, Peddigari S, Mercer CA, Thomas G. 5S Ribosomal RNA is an essential component of a nascent ribosomal precursor complex that regulates the Hdm2-p53 checkpoint. Cell Reports 2013; 4:87-98; PMID:23831031; http://dx.doi.org/10.1016/j.celrep.2013.05.045
- Sloan KE, Bohnsack MT, Watkins NJ. The 5S RNP Couples p53 homeostasis to ribosome biogenesis and nucleolar stress. Cell Reports 2013; 5:237-47; PMID:24120868; http://dx.doi.org/10.1016/j.celrep.2013.08.049
- Macias E, Jin A, Deisenroth C, Bhat K, Mao H, Lindstrom MS, Zhang Y. An ARF-independent c-MYC-activated tumor suppression pathway mediated by ribosomal protein-Mdm2 Interaction. Cancer Cell 2010; 18:231-43; PMID:20832751; http://dx.doi.org/10.1016/j.ccr.2010.08.007
- Boulon S, Westman BJ, Hutten S, Boisvert FM, Lamond AI. The nucleolus under stress. Mol Cell 2010; 40:216-27; PMID:20965417; http://dx.doi.org/10.1016/j.molcel.2010.09.024
- Jefferies HB, Fumagalli S, Dennis PB, Reinhard C, Pearson RB, Thomas G. Rapamycin suppresses 5'TOP mRNA translation through inhibition of p70s6k. EMBO J 1997; 16:3693-704; PMID:9218810; http://dx.doi.org/10.1093/emboj/16.12.3693
- Sengupta S, Peterson TR, Sabatini DM. Regulation of the mTOR complex 1 pathway by nutrients, growth factors, and stress. Mol Cell 2010; 40:310-22; PMID:20965424; http://dx.doi.org/10.1016/j.molcel.2010.09.026
- Hasty P, Sharp ZD, Curiel TJ, Campisi J. mTORC1 and p53: clash of the gods? Cell Cycle 2013; 12:20-5; PMID:23255104; http://dx.doi.org/10.4161/cc.22912
- Lai KP, Leong WF, Chau JF, Jia D, Zeng L, Liu H, He L, Hao A, Zhang H, Meek D, et al. S6K1 is a multifaceted regulator of Mdm2 that connects nutrient status and DNA damage response. EMBO J 2010; 29:2994-3006; PMID:20657550; http://dx.doi.org/10.1038/emboj.2010.166
- Feng Z. p53 regulation of the IGF-1/AKT/mTOR pathways and the endosomal compartment. Cold Spring Harbor Perspectives in Biology 2010; 2:a001057; PMID:20182617; http://dx.doi.org/10.1101/cshperspect.a001057
- Mayo LD, Donner DB. A phosphatidylinositol 3-kinase/Akt pathway promotes translocation of Mdm2 from the cytoplasm to the nucleus. Proc Natl Acad Sci U S A 2001; 98:11598-603; PMID:11504915; http://dx.doi.org/10.1073/pnas.181181198
- Bar J, Lukaschuk N, Zalcenstein A, Wilder S, Seger R, Oren M. The PI3K inhibitor LY294002 prevents p53 induction by DNA damage and attenuates chemotherapy-induced apoptosis. Cell Death Differ 2005; 12:1578-87; PMID:15933740; http://dx.doi.org/10.1038/sj.cdd.4401677
- Kojima K, Shimanuki M, Shikami M, Samudio IJ, Ruvolo V, Corn P, Hanaoka N, Konopleva M, Andreeff M, Nakakuma H. The dual PI3 kinase/mTOR inhibitor PI-103 prevents p53 induction by Mdm2 inhibition but enhances p53-mediated mitochondrial apoptosis in p53 wild-type AML. Leukemia 2008; 22:1728-36; PMID:18548093; http://dx.doi.org/10.1038/leu.2008.158
- Suvasini R, Somasundaram K. Essential role of PI3-kinase pathway in p53-mediated transcription: Implications in cancer chemotherapy. Oncogene 2010; 29:3605-18; PMID:20418912; http://dx.doi.org/10.1038/onc.2010.123
- Choong ML, Yang H, Lee MA, Lane DP. Specific activation of the p53 pathway by low dose actinomycin D: a new route to p53 based cyclotherapy. Cell Cycle 2009; 8:2810-8; PMID:19657224; http://dx.doi.org/10.4161/cc.8.17.9503
- Burger K, Muhl B, Harasim T, Rohrmoser M, Malamoussi A, Orban M, Kellner M, Gruber-Eber A, Kremmer E, Hölzel M, et al. Chemotherapeutic drugs inhibit ribosome biogenesis at various levels. J Biol Chem 2010; 285:12416-25; PMID:20159984; http://dx.doi.org/10.1074/jbc.M109.074211
- Vassilev LT, Vu BT, Graves B, Carvajal D, Podlaski F, Filipovic Z, Kong N, Kammlott U, Lukacs C, Klein C, et al. In vivo activation of the p53 pathway by small-molecule antagonists of MDM2. Science 2004; 303:844-8; PMID:14704432; http://dx.doi.org/10.1126/science.1092472
- Avitabile D, Bailey B, Cottage CT, Sundararaman B, Joyo A, McGregor M, Gude N, Truffa S, Zarrabi A, Konstandin M, et al. Nucleolar stress is an early response to myocardial damage involving nucleolar proteins nucleostemin and nucleophosmin. Proc Natl Acad Sci U S A 2011; 108:6145-50; PMID:21444791; http://dx.doi.org/10.1073/pnas.1017935108
- Sun XX, Dai MS, Lu H. 5-fluorouracil activation of p53 involves an MDM2-ribosomal protein interaction. J Biol Chem 2007; 282:8052-9; PMID:17242401; http://dx.doi.org/10.1074/jbc.M610621200
- Sun XX, Dai MS, Lu H. Mycophenolic acid activation of p53 requires ribosomal proteins L5 and L11. J Biol Chem 2008; 283:12387-92; PMID:18305114; http://dx.doi.org/10.1074/jbc.M801387200
- Demidenko ZN, Shtutman M, Blagosklonny MV. Pharmacologic inhibition of MEK and PI-3K converges on the mTOR/S6 pathway to decelerate cellular senescence. Cell cycle 2009; 8:1896-900; PMID:19478560; http://dx.doi.org/10.4161/cc.8.12.8809
- Lamming DW, Ye L, Sabatini DM, Baur JA. Rapalogs and mTOR inhibitors as anti-aging therapeutics. J Clin Invest 2013; 123:980-9; PMID:23454761; http://dx.doi.org/10.1172/JCI64099
- Ballou LM, Lin RZ. Rapamycin and mTOR kinase inhibitors. J Chem Biol 2008; 1:27-36; PMID:19568796; http://dx.doi.org/10.1007/s12154-008-0003-5
- Beevers CS, Chen L, Liu L, Luo Y, Webster NJ, Huang S. Curcumin disrupts the Mammalian target of rapamycin-raptor complex. Cancer Res 2009; 69:1000-8; PMID:19176385; http://dx.doi.org/10.1158/0008-5472.CAN-08-2367
- Cortez D. Caffeine inhibits checkpoint responses without inhibiting the ataxia-telangiectasia-mutated (ATM) and ATM- and Rad3-related (ATR) protein kinases. J Biol Chem 2003; 278:37139-45; PMID:12847089; http://dx.doi.org/10.1074/jbc.M307088200
- Demidenko ZN, Blagosklonny MV. At concentrations that inhibit mTOR, resveratrol suppresses cellular senescence. Cell Cycle 2009; 8:1901-4; PMID:19471118; http://dx.doi.org/10.4161/cc.8.12.8810
- Reinke A, Chen JC, Aronova S, Powers T. Caffeine targets TOR complex I and provides evidence for a regulatory link between the FRB and kinase domains of Tor1p. J Biol Chem 2006; 281:31616-26; PMID:16923813; http://dx.doi.org/10.1074/jbc.M603107200
- Sun ZJ, Chen G, Zhang W, Hu X, Liu Y, Zhou Q, Zhu LX, Zhao YF. Curcumin dually inhibits both mammalian target of rapamycin and nuclear factor-kappaB pathways through a crossed phosphatidylinositol 3-kinase/Akt/IkappaB kinase complex signaling axis in adenoid cystic carcinoma. Mol Pharmacol 2011; 79:106-18; PMID:20959361; http://dx.doi.org/10.1124/mol.110.066910
- Van Aller GS, Carson JD, Tang W, Peng H, Zhao L, Copeland RA, Tummino PJ, Luo L. Epigallocatechin gallate (EGCG), a major component of green tea, is a dual phosphoinositide-3-kinase/mTOR inhibitor. Biochem Biophys Res Commun 2011; 406:194-9; PMID:21300025; http://dx.doi.org/10.1016/j.bbrc.2011.02.010
- Zajkowicz A, Rusin M. The activation of the p53 pathway by the AMP mimetic AICAR is reduced by inhibitors of the ATM or mTOR kinases. Mechanisms of ageing and development 2011; 132:543-51; PMID:21945951; http://dx.doi.org/10.1016/j.mad.2011.09.002
- Zheng JP, Ju D, Jiang H, Shen J, Yang M, Li L. Resveratrol induces p53 and suppresses myocardin-mediated vascular smooth muscle cell differentiation. Toxicol Lett 2010; 199:115-22; PMID:20797428; http://dx.doi.org/10.1016/j.toxlet.2010.08.010
- Wanke V, Cameroni E, Uotila A, Piccolis M, Urban J, Loewith R, De Virgilio C. Caffeine extends yeast lifespan by targeting TORC1. Mol Microbiol 2008; 69:277-85; PMID:18513215; http://dx.doi.org/10.1111/j.1365-2958.2008.06292.x
- Donati G, Bertoni S, Brighenti E, Vici M, Trere D, Volarevic S, Montanaro L, Derenzini M. The balance between rRNA and ribosomal protein synthesis up- and downregulates the tumour suppressor p53 in mammalian cells. Oncogene 2011; 30:3274-88; PMID:21399665; http://dx.doi.org/10.1038/onc.2011.48
- Donati G, Montanaro L, Derenzini M. Ribosome biogenesis and control of cell proliferation: p53 is not alone. Cancer Res 2012; 72:1602-7; PMID:22282659; http://dx.doi.org/10.1158/0008-5472.CAN-11-3992
- Lindstrom MS, Deisenroth C, Zhang Y. Putting a finger on growth surveillance: insight into MDM2 zinc finger-ribosomal protein interactions. Cell cycle 2007; 6:434-7; PMID:17329973; http://dx.doi.org/10.4161/cc.6.4.3861
- Fumagalli S, Di Cara A, Neb-Gulati A, Natt F, Schwemberger S, Hall J, Babcock GF, Bernardi R, Pandolfi PP, Thomas G. Absence of nucleolar disruption after impairment of 40S ribosome biogenesis reveals an rpL11-translation-dependent mechanism of p53 induction. Nature Cell Biology 2009; 11:501-8; PMID:19287375; http://dx.doi.org/10.1038/ncb1858
- Fumagalli S, Ivanenkov VV, Teng T, Thomas G. Suprainduction of p53 by disruption of 40S and 60S ribosome biogenesis leads to the activation of a novel G2/M checkpoint. Genes Dev 2012; 26:1028-40; PMID:22588717; http://dx.doi.org/10.1101/gad.189951.112
- Mahata B, Sundqvist A, Xirodimas DP. Recruitment of RPL11 at promoter sites of p53-regulated genes upon nucleolar stress through NEDD8 and in an Mdm2-dependent manner. Oncogene 2012; 31:3060-71; PMID:22081073; http://dx.doi.org/10.1038/onc.2011.482
- Beuvink I, Boulay A, Fumagalli S, Zilbermann F, Ruetz S, O'Reilly T, Natt F, Hall J, Lane HA, Thomas G. The mTOR inhibitor RAD001 sensitizes tumor cells to DNA-damaged induced apoptosis through inhibition of p21 translation. Cell 2005; 120:747-59; PMID:15797377; http://dx.doi.org/10.1016/j.cell.2004.12.040
- Lindstrom MS, Nister M. Silencing of ribosomal protein S9 elicits a multitude of cellular responses inhibiting the growth of cancer cells subsequent to p53 activation. PloS ONE 2010; 5:e9578; PMID:20221446; http://dx.doi.org/10.1371/journal.pone.0009578
- Liu R, Iadevaia V, Averous J, Taylor PM, Zhang Z, Proud CG. Impairing the production of ribosomal RNA activates mammalian target of rapamycin complex 1 signalling and downstream translation factors. Nucleic Acids Res 2014; 2:5083-96; PMID:24526220; http://dx.doi.org/10.1093/nar/gku130
- Sundqvist A, Liu G, Mirsaliotis A, Xirodimas DP. Regulation of nucleolar signalling to p53 through NEDDylation of L11. EMBO Rep 2009; 10:1132-39; PMID:19713960; http://dx.doi.org/10.1038/embor.2009.178
- Krzesniak M, Zajkowicz A, Matuszczyk I, Rusin M. Rapamycin prevents strong phosphorylation of p53 on serine 46 and attenuates activation of the p53 pathway in A549 lung cancer cells exposed to actinomycin D. Mechanisms of Ageing and Dev 2014; 139:11-21; PMID:24915467; http://dx.doi.org/10.1016/j.mad.2014.06.002
- Alimonti A, Nardella C, Chen Z, Clohessy JG, Carracedo A, Trotman LC, Cheng K, Varmeh S, Kozma SC, Thomas G, et al. A novel type of cellular senescence that can be enhanced in mouse models and human tumor xenografts to suppress prostate tumorigenesis. J Clin Invest 2010; 120:681-93; PMID:20197621; http://dx.doi.org/10.1172/JCI40535
- Renton A, Llanos S, Lu X. Hypoxia induces p53 through a pathway distinct from most DNA-damaging and stress-inducing agents. Carcinogenesis 2003; 24:1177-82; PMID:12807744; http://dx.doi.org/10.1093/carcin/bgg044
- Lindstrom MS, Wiman KG. Myc and E2F1 induce p53 through p14ARF-independent mechanisms in human fibroblasts. Oncogene 2003; 22:4993-5005; PMID:12902982; http://dx.doi.org/10.1038/sj.onc.1206659
- Chen CS, Ho DR, Chen FY, Chen CR, Ke YD, Su JG. AKT mediates actinomycin D-induced p53 expression. Oncotarget 2014; 5:693-703; PMID:24525337
- Genolet R, Rahim G, Gubler-Jaquier P, Curran J. The translational response of the human mdm2 gene in HEK293T cells exposed to rapamycin: a role for the 5'-UTRs. Nucleic Acids Research 2011; 39:989-1003; PMID:20876686; http://dx.doi.org/10.1093/nar/gkq805
- Johnson SC, Rabinovitch PS, Kaeberlein M. mTOR is a key modulator of ageing and age-related disease. Nature 2013; 493:338-45; PMID:23325216; http://dx.doi.org/10.1038/nature11861
- Liu D, Xu Y. p53, oxidative stress, and aging. Antioxidants Redox Signaling 2011; 15:1669-78; PMID:21050134; http://dx.doi.org/10.1089/ars.2010.3644
- Qian Y, Chen X. Senescence regulation by the p53 protein family. Methods Mol Biol 2013; 965:37-61; PMID:23296650; http://dx.doi.org/10.1007/978-1-62703-239-1_3
- Tucci P. Caloric restriction: is mammalian life extension linked to p53? Aging 2012; 4:525-34; PMID:22983298
- Chen T, Shen L, Yu J, Wan H, Guo A, Chen J, Long Y, Zhao J, Pei G. Rapamycin and other longevity-promoting compounds enhance the generation of mouse induced pluripotent stem cells. Aging Cell 2011; 10:908-11; PMID:21615676; http://dx.doi.org/10.1111/j.1474-9726.2011.00722.x
- Miwa S, Sugimoto N, Yamamoto N, Shirai T, Nishida H, Hayashi K, Kimura H, Takeuchi A, Igarashi K, Yachie A, et al. Caffeine induces apoptosis of osteosarcoma cells by inhibiting AKT/mTOR/S6K, NF-kappaB and MAPK pathways. Anticancer Res 2012; 32:3643-9; PMID:22993301
- Rallis C, Codlin S, Bahler J. TORC1 signaling inhibition by rapamycin and caffeine affect lifespan, global gene expression and cell proliferation of fission yeast. Aging Cell 2013; 12:563-73; PMID:23551936; http://dx.doi.org/10.1111/acel.12080
- Fredholm BB, Battig K, Holmen J, Nehlig A, Zvartau EE. Actions of caffeine in the brain with special reference to factors that contribute to its widespread use. Pharmacological reviews 1999; 51:83-133; PMID:10049999
- Harrison DE, Strong R, Sharp ZD, Nelson JF, Astle CM, Flurkey K, Nadon NL, Wilkinson JE, Frenkel K, Carter CS, et al. Rapamycin fed late in life extends lifespan in genetically heterogeneous mice. Nature 2009; 460:392-5; PMID:19587680
- Sayin VI, Ibrahim MX, Larsson E, Nilsson JA, Lindahl P, Bergo MO. Antioxidants accelerate lung cancer progression in mice. Science translational medicine 2014; 6:221ra15; PMID:24477002; http://dx.doi.org/10.1126/scitranslmed.3007653
- Nister M, Heldin CH, Westermark B. Clonal variation in the production of a platelet-derived growth factor-like protein and expression of corresponding receptors in a human malignant glioma. Cancer Res 1986; 46:332-40; PMID:2998609
- Ge H, Ni S, Wang X, Xu N, Liu Y, Wang L, Wang L, Song D, Song Y, Bai C. Dexamethasone reduces sensitivity to cisplatin by blunting p53-dependent cellular senescence in non-small cell lung cancer. PloS ONE 2012; 7:e51821; PMID:23272171; http://dx.doi.org/10.1371/journal.pone.0051821