
 ?Mathematical formulae have been encoded as MathML and are displayed in this HTML version using MathJax in order to improve their display. Uncheck the box to turn MathJax off. This feature requires Javascript. Click on a formula to zoom.
Abstract
Time-lapse live cell imaging is a powerful tool for studying the responses of cells to drugs. Zoledronic acid (ZOL) is the most potent aminobiphosphonate able to induce cell growth inhibition at very low concentrations. The lack of clear evidence of ZOL-induced anti-cancer effects is likely due to its unfavorable pharmacokinetic profile. The use of nanotechnology-based formulations allows overcoming these limitations in ZOL pharmaco-distribution. Recently, stealth liposomes (LIPOs) and new self-assembly PEGylated nanoparticles (NPs) encapsulating ZOL were developed. Both the delivery systems showed promising anticancer activity in vitro and in vivo.
In this work, we investigated the cytostatic effect of these novel formulations (LIPOs and NPs) compared with free ZOL on 2 different prostate cancer cell lines, PC 3 and DU 145 and on prostate epithelial primary cells EPN using time lapse video-microscopy (TLVM). In PC3 cells, free ZOL showed a significant anti-proliferative effect but this effect was lower than that induced by LIPOs and NPs encapsulating ZOL; moreover, LIPO-ZOL was more potent in inducing growth inhibition than NP-ZOL. On the other hand, LIPO-ZOL slightly enhanced the free ZOL activity on growth inhibition of DU 145, while the anti-proliferative effect of NP-ZOL was not statistically relevant. These novel formulations did not induce anti-proliferative effects on EPN cells. Finally, we evaluated cytotoxic effects on DU145 where, LIPO-ZOL induced the highest cytotoxicity compared with NP-ZOL and free ZOL. In conclusion, ZOL can be transformed in a powerful anticancer agent, if administered with nanotechnology-based formulations without damaging the healthy tissues.
Abbreviations
| blankLIPOs | = | empty pegylated liposomes |
| CaP | = | calcium/phosphate |
| FPPS | = | farnesyl pirophosphate synthase |
| LIPOs | = | stealth liposomes |
| LIPO-ZOL | = | stealth liposomes encapsulating ZOL |
| NBPs | = | bisphosphonates |
| NPs | = | nanoparticles |
| TAM | = | tumor associated macrophages |
| TLVM | = | time lapse videomicroscopy |
| ZOL | = | zoledronic acid |
Introduction
There are cellular processes that are very dynamic and last for days. An example of these processes might be the responses of cell populations in vitro to drugs.Citation1 This type of cellular dynamics and functions (e.g. cell migration, proliferation, apoptosis) can be visualised and quantitatively analyzed through time-lapse video microscopy thus allowing to obtain biochemical and biophysical information about different cell populations at precise time-space windows.Citation2-Citation4 Automated analysis software and dedicated tools were developed after the implementation of time-lapse video microscopy for quantitative analysis, including cell counting, proliferation quantification, wound healing and multiple cell tracking.Citation5 All these can provide useful methods to characterize and quantify complex biological phenomena. Furthermore, many images may be recorded and the resultant image sequence portrays the true nature of cellular processes.Citation6,7,8
Table 1. Maximum specific growth rate (h−1) and doubling time (h) of PC 3 and DU 145 Data shown are means ± SD.
ZOL is the most potent aminobiphosphonate, able to induce cell growth inhibition at very low concentrations.Citation9,10 Many authors hypothesize that a direct anti-tumor activity should be responsible for the positive effect of ZOL on bone metastases. The lack of clear evidence of ZOL-induced anti-cancer effects is likely due to its unfavourable pharmacokinetic profile. In fact, it accumulates almost exclusively in the bone and has a short serum half-life (only 15 min) not reaching active anti-tumor concentrations.Citation11 The use of nanotechnology-based formulations allows overcoming these limitations in ZOL pharmaco-distribution.Citation12-Citation14 Previously, we developed stealth liposomes, a delivery system largely used for anticancer drugs, encapsulating ZOL.Citation14 Alternatively, we designed new delivery system for BPs, consisting in new self-assembly PEGylated nanoparticles (NPs) based on calcium/phosphate NPs and cationic liposomes encapsulating ZOL.Citation12 Both the developed delivery systems showed promising anticancer activity in vitro and in vivo. Moreover, in a comparative study NPs showed an higher anti-cancer activity in nude mice xenografted with prostate cancer PC3 cells than that one induced by LIPO-ZOL while PC3 tumor xenografts were almost completely resistant to the anti-cancer effects induced by free ZOL.Citation13
In this work, LIPOs and NPs containing ZOL and free ZOL, were tested on 2 different prostate cancer cell lines, PC 3 and DU 145 and on prostate epithelial primary cells EPN using time lapse videomicroscopy (TLVM) in order to evaluate both cytostatic and cytotoxic effect of these novel formulations compared with free ZOL.
Results
Proliferation curves of PC 3 and DU 145
In order to adequately evaluate in vitro antitumour activity of ZOL and statistically analyze the anti-tumor activity of the 2 recently developed delivery systems, 2 prostate cancer cell lines, PC 3 and DU 145 were used. An additional proliferation assay was performed on an epithelial cell line derived from human prostate gland (EPN) in order to investigate if the 2 formulations could induce cytostatic effects also on normal cells. Experiments were performed at the same time assessing 6 different conditions: (1) untreated (CTR); (2) free ZOL (ZOL); (3) pegylated liposomes encapsulating ZOL (LIPOs); (4) empty liposomes (blankLIPOs); (5) pegylated nanoparticles encapsulating ZOL (NPs); (6) empty nanoparticles (blankNPs). Images of PC 3 and DU 145 cells at passage II and III are shown in . The phase contrast image (10× magnitude), obtained with time-lapse inverted phase microscope, showed the morphology of not treated PC 3 and DU 415 cells (, respectively). Both cell lines are epithelial-like, polygonal shaped with more regular dimensions, and they grow attached to a surface in discrete patches. DU 145 cells were smaller, rounded cells, while PC 3 cells were larger, with more cytoplasmic extensions; for these reasons cell seeding for cytostatic and cytotoxicity assays is different among the 2 cell types, with a decrease in number of cells seeded per well for PC3 experiments.
Figure 1. Morphological comparison of PC 3 (A) and DU 145 (B) cell lines. Both cells lines showed epithelial morphology and adherence to plastic culture plates; DU 145 cells were smaller, rounded cells, while PC 3 cells were larger, with more cytoplasmic extensions. Scale bar, 100 μm.
Figure 2. Proliferation curves for PC 3 and DU 145 cells lines. The curves were obtained analyzing, by counting, 3 different untreated wells for each of the 3 experiments. Data shown are means ± SEM.
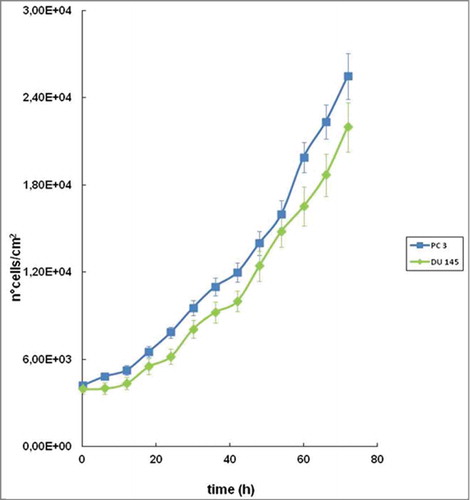
Using time-lapse video microscopy and its related tools, a proliferation curve for each cell line was assessed in order to understand and standardize the conditions of cell seeding and correctly evaluate cytostatic or cytotoxic effect of the formulations under study. It is evident in that PC 3 had a higher growth rate compared to DU 145 and final cell density is also significantly higher at 72 h (); however, approaching the 70th h from the plating both the growth curve showed a characteristic decline but the plateau was not reached and therefore the confluence was not complete ().
Figure 3. Representative time-lapse images of PC3 cells for a qualitative comparison of ZOL delivery systems. Pictures were taken at 24 h intervals over 72 h. LIPOs and NPs formulation act strongly decreasing cell proliferation rate, if compared with free ZOL. Scale bar, 100 μm.
Evaluation of in vitro cytostatic effect of ZOL or ZOL-encapsulating nanocarriers on prostate adenocarcinoma PC 3 and DU145 cell lines
As described in “Materials and Methods,” PC 3 cells were seeded into 24-well culture plates; empty or ZOL encapsulating nanocarriers were added to the cells after 24 h. Through the image analysis software, panels were generated where it could be observed the qualitative effects of ZOL and its formulations on cell proliferation. In , the anti-proliferative effect of encapsulated ZOL (LIPOs and NPs) compared to untreated control (CTR) and blank nano-vehicles can be observed. In details, free ZOL induced a reduction of cell proliferation compared to CTR, nonetheless both ZOL-encapsulating LIPOs and NPs formulations appeared to induce a higher growth inhibitory effect.
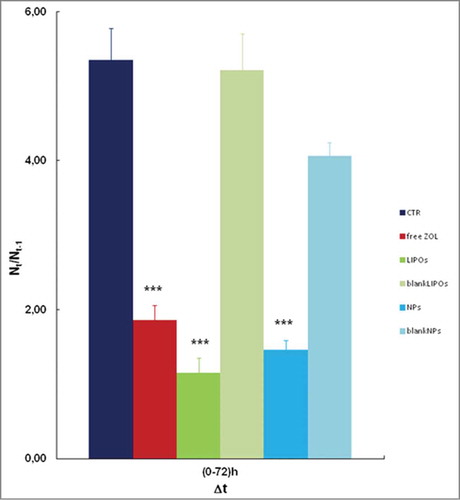
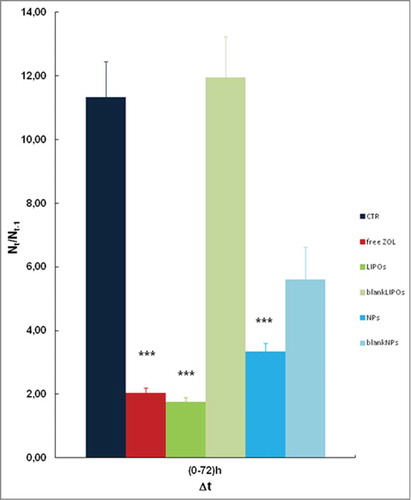
A quantitative result was obtained by analyzing all the objects (at least 5 per each well, and 3 wells contained the same medium/stimuli). An analysis among the different experimental conditions can be outlined with the use of histograms () in which we reported the fold-increases (as described in Material and Methods) in presence of free ZOL and LIPOs and NPs formulations. The density of untreated cells was 5-fold increased after 72 h and a similar increase was obtained in cells treated with blank LIPOs, whereas a small but significant reduction (30%) was found for blank NPs. Interestingly, free ZOL caused a 65% growth inhibition after 3 days of incubation, but NPs and LIPOs containing ZOL significantly improved this result achieving about 70 and 75% of growth inhibition, respectively. Although the anti-proliferative effects induced by the 2 nano-delivery systems did not differ significantly, cell growth inhibition caused by NPs and LIPOs compared to free ZOL was statistically significant (p= 0.001).
Figure 4. Data represent the fold increase of the number of cells under different stimuli. LIPOs and NPs formulations enhanced the anti-proliferative effect of ZOL, compared with free ZOL and CTR. Each condition was assayed in the same experiment in triplicate and the average of the results of 3 independent experiments were reported. Data shown are means ± SEM;***p < 0.001 (CTR versus free ZOL, LIPOs, and NPs).
Similarly to the experiments performed on PC3 cell line, free ZOL or LIPOs and NPs encapsulating ZOL, were added to DU145 cell line.
Free ZOL and the different formulations induced growth inhibition, but LIPOs appeared again to induce a stronger effect ().
Figure 5. Representative time-lapse images of DU 145 cells for a qualitative comparison of ZOL delivery systems. Pictures were taken at 24 h intervals over 72 h. LIPOs seemed to act as the stronger anti-proliferative agent if compared to NPs and free ZOL. Scale bar, 100 μm.
Also in this set of experiments, after the image acquisition, we focused on quantitative and statistical analysis. shows that LIPOs has the stronger anti-proliferative effect compared to free ZOL and NPs. The statistical analysis proves that free ZOL induced a 80% of growth inhibition; LIPOs and NPs induced a 83% and a 65% of growth inhibition, respectively whereas the empty liposomes did not affect cell growth and empty NPs reduced growth of about 45% (). Interestingly, LIPOs slightly enhanced the ZOL activity on this cell line, while there was not statistically relevant effect with NPs.
Figure 6. Data represent the fold increase of the number of cells under different stimuli. LIPOs enhanced the anti-proliferative effect of ZOL compared to free ZOL and NPs formulation. Each condition was assayed in the same experiment in triplicate and the average of the results of 3 independent experiments were reported. Data shown are means ± SEM;***p < 0.001 (CTR vs. free ZOL, LIPOs, and NPs).
Evaluation of in vitro cytostatic effects of encapsulated ZOL on epithelial EPN cell line derived from human prostate
The LIPOs and NPs formulations encapsulating ZOL were also added to EPN cell line, similarly to the previous experiments. The proliferation rate in EPN cells was lower than in PC3 and DU145; in fact, EPN cell density was about 2.5-fold increased after 72 h from the seeding whereas DU145 and PC3 cell density was about 12-fold and 5.5-fold increased, respectively. In this experimental model, all the ZOL formulations (either free or encapsulated) had not significant effects on cell growth ( and ). These results suggest that the anti-cancer agents used in the present study had more pronounced cell growth inhibition on actively proliferating cells (that is a signature of tumors) likely sparing the normal counterpart.
Evaluation of in vitro cytotoxic effect of encapsulated ZOL on prostate carcinoma: DU 145 cell line
Beside the studies presented on the anti-proliferative effect of ZOL and its formulations, which is of great interest but gives no information on toxicity extent, another experimental set up was designed in order to evaluate the putative cytotoxic effect of ZOL-encapsulating formulations. In fact, confluent layers of DU 145, which showed the highest rate of growth inhibition compared with PC3, were subjected to the reported stimuli doses, as described in “Materials and Methods” section; during incubation, death, detachment and lysis of cells were observed through time-lapse video microscopy. The experiments were lasting for 96–120 h. The images collected, were examined using Image-Pro® Plus 5.1 and the data were elaborated to obtain a value of lysis area (%).
Similarly to the previously described experiments, panel generated by the software permitted a qualitative evaluation of the effect of the different stimuli, in addition a quantitative robust statistical analysis was accomplished for each set of experiments.
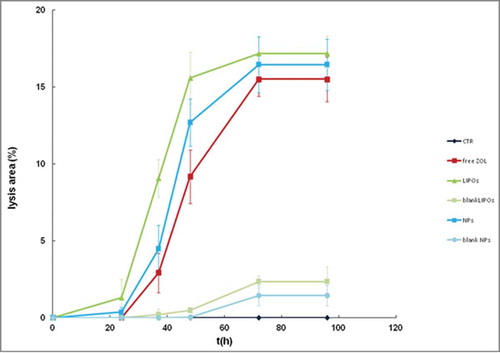
In the experiment, the qualitative observation found a similar outcome for free ZOL and NPs whereas a higher effect was evidenced for LIPOs using DU145 cell line (). These qualitative observations were confirmed by quantitative analyses reported in ; the graph shows the cytotoxic effect over time. The rate of cell lyses and detachment was steeper within the first 24 h of treatment. However, LIPOs showed the highest cytotoxicity compared to free ZOL and NPs. The latter and free ZOL exhibited similar cytotoxicity at shorter incubation times. This effect is evident and measurable only during a limited time interval approaching a plateau within 90 h; however treated samples resulted completely detached within about 120 h, while control samples were still attached as a partial monolayer.
Figure 7. Representative time-lapse images of EPN cells for a qualitative comparison of ZOL delivery systems. Pictures were taken at 24 h intervals. Scale bar, 100 μm.
Figure 8. Data represent the fold increase of the number of cells under different stimuli. There are no significative differences between the treatments and the control. The data represent an average of triplicate repeats; data shown are means ± SD.
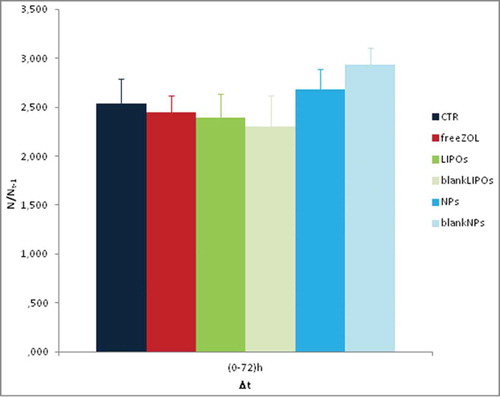
Figure 9. Representative time-lapse images show the progression of cytotoxic effect on a monolayer of DU 145 throughout the entire experiment. Cells treated with LIPOs were lysed more than other. Scale bar, 100 μm. For the kinetic analysis of the data please see also movies added to the present manuscript as supplemental files available on the web site of the journal. Legend: CTR3.avi: Untreated cells; AZ9.avi: ZOL-treated DU145 cells; Lip17.avi: LIPO-ZOL-treated DU145 cells; Nano33.avi: NP-ZOL-treated DU145 cells.
Figure 10. Kinetics of lysis. The graph reported the lysis area appearing on a confluent monolayer of DU 145 cells. LIPOs formulation showed the stronger effect compared to free ZOL and NPs (%). In the cytotoxicity assays, cell treatments were assessed in triplicate and the averaged results of 3 independent experiments are reported.
Discussion
Advanced TLVM stations can easily collect thousands of high-resolution images of cells from a single experiment and permit quantitative parallel screening on the same cell population using diverse chemicals compounds and/or doses.
Computerized image analysis plays an important role in transforming qualitative perception to quantitative evaluation of parameters. ZOL belongs to the nitrogen containing bisphosphonates (NBPs), agents of choice for the treatment of bone metastases. ZOL inhibits the farnesyl pirophosphate synthase (FPPS), the upstream enzyme involved in the cholesterol synthesis chain, with consequent inhibition of cell proliferation,Citation15 differentiation,Citation16 adhesionCitation17 and tumorigenesis.Citation18,19 Due to these pharmacodynamic effects, ZOL has widely demonstrated a direct anti-proliferative action on human tumor cells in vitro.Citation20 Unfortunately, ZOL has a very short plasma half-life and tends to accumulate in the bone, which results in far below therapeutically effective concentrations that reach tumor tissues.Citation21,22 Therefore, new approaches aimed at increasing ZOL plasma half-life and achieve effective concentrations of ZOL in different districts, such as tumors, must be designed.Citation19 To address this problem, previously we proposed 2 nanotechnological strategies, LIPO-ZOL and NP-ZOL, for the delivery of ZOL in solid tumors. LIPO-ZOL and NP-ZOL were prepared by completely different approaches. The self-assembling methodCitation12 assured a ZOL encapsulation efficiency of about 12-fold greater than that obtained with LIPO-ZOL. In order to improve the ZOL actual loading, a 20-times higher ZOL theoretical loading was used in LIPO-ZOL. This was not possible for NP-ZOL, where the theoretical loading was limited by the ZOL solubility in water.Citation13 Both the formulations induced a strong and significant inhibition of the tumor growth in in vivo models of prostate adenocarcinoma, as previously described.Citation13
In this work the 2 different nanotechnology-based delivery systems for ZOL were compared with free ZOL. Our aim was to demonstrate and evaluate the cytostatic and cytotoxic effect of the 2 nanotechnological formulations on prostate adenocarcinoma cells, using time-lapse video microscopy, in a faster and non invasive way with respect to all the procedures involving animals. In fact, studying the effect of chemotherapy using in vitro models can lead to several benefits including reduction of pre-clinical studies on genetically engineered mice and possibly faster implementation of clinical trials.
As far as the cytostatic effect, we evaluated the effects of free ZOL and the different formulations on growth inhibition of PC3 and DU145 cells. PC3 and DU145 cells behave differently; the treatment of PC3 with both LIPOs and NPs elicited a marked anti-proliferative effect (75% and 70% of growth inhibition, respectively); these effects were statistically significant if compared to untreated group (p < 0.001 in both case) and to free ZOL (p = 0.001); free ZOL induced a potent growth inhibition (65%) especially if compared to the untreated group (p < 0.001) but the anti-proliferative effect was lower than LIPOs and NPs; PC 3 were relatively insensitive to blank LIPOs (p > 0.05) and poorly sensitive to blank NPs (30% of growth inhibition) ( and ). On the other hand, LIPOs slightly enhanced the free ZOL activity on DU145 while the anti-proliferative effects of NPs was not statistically relevant; the empty liposomes did not affect cell growth and empty NPs reduced growth of about 45% ( and ). An additional experiment of cytostatic assay was conducted testing the 2 formulations on EPN, healthy cell line derived from human prostate; in vitro proliferation assay confirmed that these novel formulations did not induce aggressive, anti-proliferative effects on healthy component of human prostate ( and ). Exploring cell incubation stage also cytotoxic effects, death, detachment and cell lysis can be recorded. The rate of cell lyses and detachment was steeper within the first 24 h of treatment. LIPOs showed the highest cytotoxicity compared to free ZOL and NPs ( and ). The latter and free ZOL exhibited similar outcome at shorter incubation times. This effect is evident and measurable only during a limited time interval approaching a plateau within 90 h.
Therefore, this work demonstrates that ZOL, a third generation aminobisphosphonate, can be transformed in a powerful anticancer agent, if administered with nanotechnology-based formulations without damaging the healthy tissues. The improved cytotoxic effect of LIPOs and NPs may be due to an enhanced uptake of the formulations by tumors.
Conclusion
In conclusion, LIPOs shows a marked anti-proliferative effect and acts better than NPs and free ZOL on both prostate cancer cell lines. Moreover, LIPOs also exhibits the highest lytic effect, inducing an alteration in cell shape as well as causing evident cell detaching on DU145.
Materials and Methods
Materials
DMEM and FBS were purchased from FlowLaboratories (Milan, Italy). Tissue culture plasticware was from Becton Dickinson (Lincoln Park, NJ). ZOL was provided by Novartis (Novartis Oncology, Basel, Switzerland).
Cell lines
PC 3 and DU 145 primary prostate cancer cell lines were provided by American Type Tissue Culture Collection (ATCC, Rockville, MD). PC 3 cell line is a primary line initiated from a bone metastasis of a grade IV prostatic adenocarcinoma. DU 145 cell line is a primary line but it was established from a brain metastasis of prostatic carcinoma. EPN is a novel epithelial cell line derived from human prostate tissue and provided by Prof. V. Nigro (Department of Biochemistry, Biophysics and General Pathology, Second University of Naples). PC3, DU145 and EPN were grown in Dulbecco's Modified Eagle Medium (DMEM) both supplemented with 10% (v/v) heat inactivated fetal bovine serum (FBS), 20 mM HEPES, 100 U/ml penicillin, 100 μg/ml streptomycin, 1% L-glutamine and 1% sodium piruvate in a humidified incubator containing 5% CO2 at 37 °C.
Preparation of stealth liposomes encapsulating ZOL
The stealth liposomes encapsulating ZOL (LIPO-ZOL) were prepared by a modified reverse-phase evaporation technique. The lipid mixture composed of EPC/Chol/DSPE-PEG (1:0.32:0.30 weight ratio) was dissolved in a mixture chloroform/methanol (2:1 v/v). The organic solution was added to a 50 ml round-bottom flask, and the solvent was removed under reduced pressure by a rotary evaporator under nitrogen atmosphere. The resulting lipid film was dissolved in 3 ml diethyl ether and the solution was emulsified, by sonication for 30 min in a bath-type sonicator (Branson 3510, Danbury, USA), with 1 ml of ammonium chloride buffer at pH 9,5 containing 75 mM ZOL and 58 mM lactose in presence of glass beads (Sigma). The resulting emulsion was then placed on the rotary evaporator (Laborota 4010 digital, Heidolph, Schwabach, Germany) and the organic solvent was removed under reduced pressure at 30 °C in nitrogen atmosphere. When viscous gel was obtained, the vacuum was broken and the gel was vortexed for about 1 min. Then, the dispersion was placed at rotary evaporator under vacuum for about 15 min. The liposome suspension was then extruded using a thermobarrel extruder system (Northern Lipids Inc., Vancouver, BC, Canada) passing repeatedly the suspension under nitrogen through polycarbonate membrane (Nucleopore Track Membrane 25 mm, Whatman, Brentford, UK) with 0.4 μm pore size. Not encapsulated ZOL was removed and liposomes prepared and stored as previously described.Citation14
Preparation of self-assembling NPs encapsulating ZOL
Self-assembling NPs encapsulating ZOL were prepared starting from a ZOL aqueous solution, calcium/phosphate nanoparticles (CaP NPs) and cationic liposomes. An aqueous solution of calcium chloride (18 mM) was added, dropwise and under magnetic stirring, to an aqueous solution on dibasic hydrogen phosphate (10.8 mM). The pH of both solutions was adjusted beforehand to 9.5 with NaOH. The resulting suspension was filtered through a 0.22 μm filter (0.22 μm pore size, polycarbonate filters, MF-Millipore, Microglass Heim, Italy) and then stored at 4 °C before use. To complex ZOL with CaP NPs (CaPZ NPs), an aqueous solution containing the aminobisphosphonate (50 mg/ml) was mixed with the CaP NP dispersion, at a volume ratio of 50:1, respectively. Cationic liposomes consisting of DOTAP/chol/DSPE-PEG (1:1:0.5) were prepared by hydration of a thin lipid film followed by extrusion. Briefly, the lipid mixture were dissolved in 1 ml of a mixture chloroform/methanol (2:1 v/v), the resulting solution was added to a 50 ml round-bottom flask, and the solvent was removed under reduced pressure by a rotary evaporator (Laborota 4010 digital, Heidolph, Schwabach, Germany) under nitrogen atmosphere. Then, the lipid film was hydrated with 1 ml of 0.22 μm and NP prepared as previously described.Citation12
Cytostatic and cytotoxicity assays by time-lapse videomicroscopy
Time-lapse experiments for cytostatic and cytotoxicity assays were performed using 24-well tissue plates. Each well was seeded with cells (PC 3, DU 145 and EPN only for cytostatic test) to a final density of about 10,000 cells per well in cell proliferation experiment to better evaluate growth rate decrease in presence of IC50 of the stimuli. Whereas in cytotoxicity assays about 200,000 cells per well were seeded to permit to analyze the lyses areas spreading when either ZOL or delivered ZOL entered the cells (acted on the cells). In all cases, cell cultures were maintained at 37 °C and 5% CO2 for 24 h to permit either cell adhesion or the formation of a confluent monolayer, depending on the phenomenon to be observed. The day after, the culture medium was re-fed with (i) a fresh medium (control, CTR), or (ii) conditioned medium containing empty pegylated liposomes (blankLIPOs), (iii) conditioned medium containing pegylated liposomes encapsulating ZOL (LIPOs),or (iv) conditioned medium containing empty pegylated nanoparticles (blank NPs); (v) conditioned medium containing pegylated nanoparticles encapsulating ZOL (NPs). All conditions were performed in triplicate. After the selection of 4–5 representative fields of view for each well, images to be analyzed for proliferation were collected every 50 min over a period of 72 h; while images for cytotoxicity assays were recorded with the same delay time for 120 h.
Image analysis with Image-Pro® Plus 5.1
The recorded image analysis of cytostatic and cytotoxicity assays were made using Image-Pro® Plus 5.1, a platform for cell image analysis. This software includes a full range of qualitative and quantitative analysis tools.
By default, Image-Pro® Plus expresses all spatial measurements in terms of pixels but output data can be automatically rescaled in micron provided the correct micron/pixel calibration ratio, that depends on the optic. The microscope acquired (1024 × 1344) pixels (pxl) images using a 10× objective (illumination normalized between 0 and 1). The conversion factor μm/pxl for 10× objective is 1.06 μm/pxl, thus, the total area of each images is 1.3 × 105 μm2. Post-processing Look Up Table routines available in the software allows to enhance the image quality to perform a better analysis and limit misleading background variations.
A proliferation curve for the cells lines used can be automatically generated through the software, if a sound calibration is assessed. In fact a manual counting is firstly necessary to correlate the pixel/squared micrometers area respect to the cells in a certain number of observed field of view, and then it was possible to detect the number of cells/surface. The proliferation curves were obtained by plotting the number of cells per cm2 over time. Holding these data, it has been possible to calculate the maximum specific growth rate and the doubling time, using the following formulas:
where Nt is the number of cells at a defined time interval; N0 is the number of cells at time 0; Δt is the temporal interval of observation.
With the same tools proliferation assays were made. In detail, cell counting was made by manually marking the cell position in each frame through a sequence of consecutive images predefined temporally to show the development of cell numbers over time.
The experimental data of proliferation assay were presented calculating the fold increase:
Lysis, instead, was evaluated using a manual measuring tool, a polygon, to create a closed trace of which area is automatically measured. The percentage of lysis area was calculated using the formula:
The total lysis area was obtained summing up the single collected values in a view-field, while the total area of the image was calculated using the calibration factors.
Disclosure of Potential Conflicts of Interest
No potential conflicts of interest were disclosed.
955989_Supplementary_Materials.zip
Download Zip (53.8 MB)Funding
MC was supported from the Italian Ministry of Education, University and Research (MIUR) with a project (FIRB-ACCORDI DI PROGRAMMA 2011) entitled “Application of High-Throughput Technology Platforms for the Characterization of New Biomarkers and Molecular Targets in Nanovectors for the Diagnosis and Treatment of Human Cancer” Moreover, MC was also partially supported by from Regione Campania in a project entitled “Laboratori Pubblici Hauteville.”
References
- Aman A, Piotrowski T Cell migration during morphogenesis. Dev Biol 2010; 341: 20-33; PMID:19914236; http://dx.doi.org/10.1016/j.ydbio.2009.11.014
- Errington RJ, Chappell SC, Khan IA, Marquez N, Wiltshire M, Griesdoorn VD, Smith PJ. Time-lapse microscopy approaches to track cell cycle and lineage progression at the single-cell level. Curr Protoc Cytom 2013; Chapter 12:Unit12.4; PMID:23546776; http://dx.doi.org/10.1002/0471142956
- Nakasone ES, Askautrud HA, Egeblad M. Live imaging of drug responses in the tumor microenvironment in mouse models of breast cancer. J Vis Exp 2013; 24(73):e50088; PMID:23542634
- Klein J, Leupold S, Biegler I, Biedendieck R, Münch R, Jahn D. TLM-Tracker: software for cell segmentation, tracking and lineage analysis in time-lapse microscopy movies.Bioinformatics 2012; 28(17):2276-7; PMID:22772947; http://dx.doi.org/10.1093/bioinformatics/bts424
- Huth J, Buchholz M, Kraus JM, Mølhave K, Gradinaru C, v Wichert G, Gress TM, Neumann H, Kestler HA. TimeLapseAnalyzer: multi-target analysis for live-cell imaging and time-lapse microscopy. Comput Methods Programs Biomed 2011; 104(2):227-34; PMID:21705106; http://dx.doi.org/10.1016/j.cmpb.2011.06.002
- Hardarson T, Hanson C, Claesson M, Stenevi U. Time-lapse recordings of human corneal epithelial healing. Acta Ophthalmol Scand 2004; 82(2 Suppl):184-8; PMID:15043538; http://dx.doi.org/10.1111/j.1600-0420.2004.00250.x
- Perfetto B, Stellavato A, Melito A, De Gregorio V, Cammarota M, Giuliano M. A time-lapse approach to examine chromium and nickel effects on wound healing in vitro. J Immunotoxicol 2012; 9 (4 Suppl): 392-400; PMID:22632163; http://dx.doi.org/10.3109/1547691X.2012.682662
- Baum CL, Arpey CJ. Normal cutaneous wound healing: clinical correlation with cellular and molecular events. Dermatol Surg 2005; 31:674-86; PMID:15996419; http://dx.doi.org/10.1097/00042728-200506000-00011
- Tassone P, Tagliaferri P, Viscomi C, Palmieri C, Caraglia M, D'Alessandro A, Galea E, Goel A, Abbruzzese A, Boland CR, et al. Zoledronic acid induces antiproliferative and apoptotic effects in human pancreatic cancer cells in vitro. Br J Cancer 2003; 88(12):1971-8; PMID:12799645; http://dx.doi.org/10.1038/sj.bjc.6600986
- Caraglia M, D'Alessandro AM, Marra M, Giuberti G, Vitale G, Viscomi C, Colao A, Prete SD, Tagliaferri P, Tassone P, et al. The farnesyl transferase inhibitor R115777 (Zarnestra) synergistically enhances growth inhibition and apoptosis induced on epidermoid cancer cells by Zoledronic acid (Zometa) and Pamidronate. Oncogene 2004; 23(41):6900-13; PMID:15286715; http://dx.doi.org/10.1038/sj.onc.1207814
- Caraglia M, Marra M, Naviglio S, Botti G, Addeo R, Abbruzzese A. Zoledronic acid: an unending tale for an antiresorptive agent. Expert Opin Pharmacother 2010; 11(1):141-54. Review; PMID:20001436
- Salzano G, Marra M, Porru M, Zappavigna S, Abbruzzese A, La Rotonda MI, Leonetti C, Caraglia M, De Rosa G. Self-assembly nanoparticles for the delivery of bisphosphonates into tumors. Int J Pharm 2011; 403(1-2):292-7; PMID:21055454; http://dx.doi.org/10.1016/j.ijpharm.2010.10.046
- Marra M, Salzano G, Leonetti C, Porru M, Franco R, Zappavigna S, Liguori G, Botti G, Chieffi P, Lamberti M, et al. New self-assembly nanoparticles and stealth liposomes for the delivery of zoledronic acid: a comparative study. Biotechnol Adv 2012; 30(1):302-9. Epub 2011 Jun 30; PMID:21741464; http://dx.doi.org/10.1016/j.biotechadv.2011.06.018
- Marra M, Salzano G, Leonetti C, Tassone P, Scarsella M, Zappavigna S, Calimeri T, Franco R, Liguori G, Cigliana G, et al. Nanotechnologies to use bisphosphonates as potent anticancer agents: the effects of zoledronic acid encapsulated into liposomes. Nanomedicine 2011; 7(6):955-64. Epub 2011 Mar 29; PMID:21453789
- Aparicio A, Gardner A, Tu Y, Savage A, Berenson J, Lichtenstein A. In vitro cytoreductive effects on multiple myeloma cells induced by bisphosphonates. Leukemia 1998; 12:220-9; PMID:9519785; http://dx.doi.org/10.1038/sj.leu.2400892
- Senaratne SG, Pirianov G, Mansi JL, Arnett TR, Colston KW. Bisphosphonates induce apoptosis in human breast cancer cell lines. Br J Cancer 2000; 82:1459-68; PMID:10780527; http://dx.doi.org/10.1054/bjoc.1999.1131
- Lee MV, Fong EM, Singer FR, Guenette RS. Bisphosphonate treatment inhibits the growth of prostate cancer cells. Cancer Res 2001; 61:2602-8; PMID:11289137
- Schafer WR, Rine J. Protein prenylation: genes, enzymes, targets, and functions. Annu Rev Genet 1992; 26:209-37; PMID:1482112; http://dx.doi.org/10.1146/annurev.ge.26.120192.001233
- Caraglia M, Santini D, Marra M, Vincenzi B, Tonini G, Budillon A. Emerging anti-cancer molecular mechanisms of aminobisphosphonates. Endocr Relat Cancer 2006; 13:7-26; PMID:16601276; http://dx.doi.org/10.1677/erc.1.01094
- Caraglia M, D′Alessandro AM, Marra M, Giuberti G, Vitale G, Viscomi C, Colao A, Prete SD, Tagliaferri P, Tassone P, et al. The farnesyl transferase inhibitor R115777 (Zarnestra) synergistically enhances growth inhibition and apoptosis induced on epidermoid cancer cells by Zoledronic acid (Zometa) and Pamidronate. Oncogene 2004; 23:6900-13; PMID:15286715
- Chen T, Berenson J, Vescio R, Swift R, Glichick A, Goodin S, LoRusso P, Ma P, Ravera C, Deckert F, et al. Pharmacokinetics and pharmacodynamics of zoledronic acid in cancer patients with bone metastases. J Clin Pharmacol 2002; 42:1228-36; PMID:12412821; http://dx.doi.org/10.1177/009127002762491316
- Skerjanec A, Berenson J, Hsu C, Major P, Miller WH Jr, Ravera C, Schran H, Seaman J, Waldmeier F. The pharmacokinetics and pharmacodynamics of zoledronic acid in cancer patients with varying degrees of renal function. J Clin Pharmacol 2003; 43:154162; PMID:12616668; http://dx.doi.org/10.1177/0091270002239824