
Abstract
Neuroblastoma is one of the most prevalent pediatric extracranial solid tumors and is often diagnosed after dissemination has occurred. Despite recent advances in multimodal therapies of this malignancy, its therapeutic efficacy remains poor. Novel treatment strategies are thus in great need. Herein, we demonstrate that histone deacetylase 6 (HDAC6), a member of the deacetylase family that is localized predominantly in the cytoplasm, is involved in neuroblastoma dissemination. HDAC6 expression in neuroblastoma tissue samples varied with the site of the tumor. HDAC6 showed little impact on the proliferation of neuroblastoma cells. Instead, downregulation of HDAC6 expression by RNA interference or inhibition of its catalytic activity by the pharmacological inhibitor tubacin significantly decreased the migration of 3 human malignant neuroblastoma cell lines and reduced the invasion ability of one of the 3 cell lines, but only slightly affected the migration and invasion of human normal brain glial cells. Our data further revealed that the regulation of neuroblastoma cell migration by HDAC6 was mediated by its effects on cell polarization and adhesion. These findings suggest a role for HDAC6 in neuroblastoma dissemination and a potential of using HDAC6 inhibitors for the treatment of this malignancy.
Abbreviations
| calcein-AM | = | calcein-acetoxymethyl |
| DAPI | = | 4′, 6-diamidino-2-phenylindole |
| HDAC6 | = | histone deacetylase 6 |
| MTT | = | 3-(4, 5-dimethyl-2-thiazolyl)-2, 5-diphenyl-2H-tetrazolium bromide |
| SRB | = | sulforhodamine B |
Introduction
Neuroblastoma, one of the most prevalent extracranial solid tumor in pediatric patients, is derived from the sympathetic nervous system with the adrenal glands as the most common sites of origin.Citation1 Previous studies have demonstrated that neuroblastoma has a high tendency to disseminate to bone, bone marrow, liver, non-contiguous lymph nodes and other organs.Citation2 Malignant neuroblastoma accounts for approximately 15% of pediatric cancer deaths worldwide.Citation3 Despite the combination of surgery, chemotherapy and radiotherapy, the therapeutic efficacy of malignant neuroblastoma remains poor.Citation4,5 More than 70% of the patients already have metastatic lesions at the time of diagnosis.Citation6,7 Thus, understanding the regulation of neuroblastoma dissemination process may be critical for the development of new and efficient strategies for the treatment of this killer of children.
Tumor cells disseminate to adjacent and distant tissues through cell invasion and migration. Targeting tumor cell invasion and migration has been demonstrated to be potential strategies for the treatment of tumors.Citation8,9 The process of cell migration can be typically parsed into 5 successive steps: cell polarization, protrusion of the leading edge, adhesion at the leading edge, deadhesion at the trailing edge, and translocation of the cell body.Citation10,11 Each step can be a target for limiting tumor spread.
Cell motility plays a pivotal role in tumor dissemination. HDAC6, a unique member of the HDAC family, has been reported to be involved in the regulation of cell motility.Citation12, Citation13 As the deacetylase of α-tubulin and cortactin, HDAC6 takes an important part in both microtubule- and actin-dependent cell movement.Citation12,13 Early studies have elucidated that HDAC6 enhances cell motility of various cancer cell lines and promotes tumor progression.Citation14-Citation17 However, the effects of HDAC6 on neuroblastoma cell motility remain to be determined. Given that HDAC inhibitors have broad application prospects in clinical cancer treatment, it is of great significance and urgency to decipher the roles of HDAC6 in neuroblastoma dissemination, which may provide new therapy options for neuroblastoma.
In this study, we show that the expression level of HDAC6 in neuroblastoma tissue samples varies with the site of the tumor. Downregulation of HDAC6 expression or inhibition of its catalytic activity has little effect on neuroblastoma cell proliferation but apparently attenuates the migration of 3 human malignant neuroblastoma cell lines and suppresses the invasion of one of the 3 cell lines. We further demonstrate that HDAC6 exerts its effects on neuroblastoma cell migration by modulating cell polarization and adhesion. Our data thus suggest that targeting HDAC6 in neuroblastoma cells may stop the cancer in its tracks and improve the outcome of clinical treatment.
Results
The expression level of HDAC6 in neuroblastoma tissue samples varies with the site of the tumor
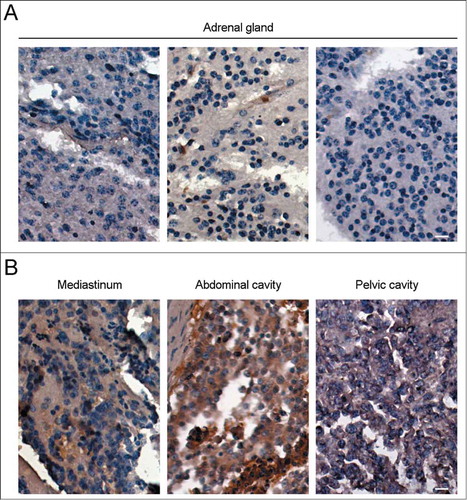
To explore the roles of HDAC6 in neuroblastoma, we firstly examined its expression level in neuroblastoma tissue samples by immunohistochemistry. As shown in , the level of HDAC6 in neuroblastoma tissue samples varied with the site of the tumor. Though neuroblastoma most commonly starts in adrenal glands,Citation1 adrenal neuroblastoma showed relatively low expression of HDAC6 (). In contrast, HDAC6 levels in neuroblastoma from other tissues, including mediastinum, abdominal cavity, and pelvic cavity, were significantly higher (). Despite that these parts could be the primary sites of neuroblastoma, there is still another possibility that neuroblastoma in these parts may be derived from adrenal neuroblastoma via metastasis, which will be an indication of the pivotal roles of HDAC6 in neuroblastoma dissemination. Since the tissue arrays contain no information about the primary site of the neuroblastoma samples, we could not draw that conclusion yet. The speculation above was thus investigated via human malignant neuroblastoma cells in the following sections.
Figure 1. The expression level of HDAC6 in neuroblastoma tissue samples varies with the site of the tumor. Immunohistochemistry of HDAC6 expression in neuroblastoma from adrenal glands (A) and 3 other sites (B), including mediastinum, abdominal cavity, and pelvic cavity. Scale bars, 10 μm.
Downregulation of HDAC6 expression or inhibition of its activity has little effect on neuroblastoma cell proliferation
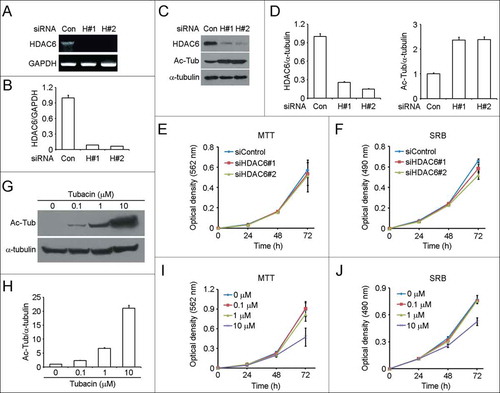
We investigated the effects of HDAC6 on the proliferation of human malignant neuroblastoma SH-SY5Y cells through downregulation of its expression by RNA interference or inhibition of its catalytic activity by the pharmacological inhibitor tubacin. Both the 2 HDAC6 siRNAs, one targeting the coding region (siHDAC6#1) and the other targeting the untranslated region (siHDAC6#2), could effectively downregulate the mRNA () and protein level of HDAC6 (). As expected, acetylated α-tubulin was increased in response to HDAC6 knockdown (). By MTT and SRB assays,Citation18,19 we found that decrease of HDAC6 expression did not affect SH-SY5Y cell proliferation (). We next examined the effects of tubacin on SH-SY5Y cell proliferation. Immunoblot analysis showed that tubacin inhibited the catalytic activity of HDAC6 in a dose-dependent manner (). Cells treated with 0.1 μM tubacin for 4 h already exhibited a significant increase in the level of acetylated α-tubulin (). The acetylation level of α-tubulin increased with the concentration of tubacin (). By cell proliferation assays, we found that tubacin had little effect on SH-SY5Y cell proliferation except when cells were incubated with 10 μM tubacin for 72 h (). This inhibitory effect is probably due to cell apoptosis induced by the prolonged incubation with the high concentration of tubacin. These results together suggest that HDAC6 is not involved in the regulation of SH-SY5Y cell proliferation.
Figure 2. Downregulation of HDAC6 expression or inhibition of its activity has little effect on SH-SY5Y cell proliferation. (A) RT-PCR analysis of HDAC6 mRNA levels in SH-SY5Y cells transfected with control or 2 different HDAC6 siRNAs for 72 h. (B) Experiments were performed as in (A), and HDAC6 mRNA levels were quantified and normalized to the control group. (C) Immunoblot analysis of HDAC6, acetylated α-tubulin (Ac-Tub), and α-tubulin levels in SH-SY5Y cells transfected with control or HDAC6 siRNAs for 72 h. (D) Experiments were performed as in (C), and the levels of HDAC6 (left panel) and acetylated α-tubulin (right panel) were quantified and normalized to the control group, respectively. (E and F) SH-SY5Y cells were transfected with control or HDAC6 siRNAs, and cell proliferation was analyzed by MTT assay (E) or SRB assay (F). (G) SH-SY5Y cells were treated with tubacin at the indicated concentrations for 4 h, and the levels of acetylated α-tubulin and α-tubulin were examined by immunoblotting. (H) Experiments were performed as in (G), and the levels of acetylated α-tubulin were quantified and normalized to the control group. (I and J) SH-SY5Y cells were cultured in complete medium containing different concentrations of tubacin as indicated, and cell proliferation was analyzed by MTT assay (I) or SRB assay (J).
Downregulation of HDAC6 expression or inhibition of its activity impedes neuroblastoma cell migration
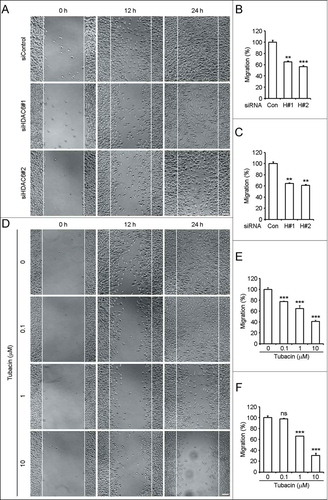
HDAC6 has been well characterized to be involved in the regulation of cell motility,Citation12,13 we thus examined the role of HDAC6 in neuroblastoma cell migration. By wound healing assay, we found that decrease of HDAC6 expression by siRNAs significantly impeded SH-SY5Y cell migration (). The quantified results of cell migration ability were obtained by counting migrated cells 12 h () and 24 h () after scratching. HDAC6 siRNAs decreased SH-SY5Y cell migration by almost 40% (). To investigate whether the catalytic activity of HDAC6 is required for SH-SY5Y cell migration, we treated cells with different concentrations of tubacin and performed the wound healing assay. As shown in , tubacin treatment suppressed SH-SY5Y cell migration in a dose-dependent manner. The inhibitory effects of tubacin on SH-SY5Y cell migration () were in concert with its inhibition of α-tubulin deacetylation (). That is, SH-SY5Y cell migration ability is inversely correlated to the acetylation level of α-tubulin.
Figure 3. Downregulation of HDAC6 expression or inhibition of its activity impedes SH-SY5Y cell migration. (A) SH-SY5Y cells transfected with control or HDAC6 siRNAs were scratched, and phase-contrast images of the wound were taken 0, 12, and 24 h later. Scale bar, 50 μm. (B and C) Experiments were performed as in (A), and the ability of SH-SY5Y cell migration was reflected by counting the cells that had migrated to the wound area 12 h (B) and 24 h (C) after scratching. The amount of migrated cells was normalized to the control group. n = 10 fields per group. Two-tailed Student's t-test for all graphs. *P < 0.05, **P < 0.01, ***P < 0.001, compared with the control; ns, not significant. Data represent means ± SD (D) SH-SY5Y cells were pretreated with tubacin at the indicated concentrations for 4 h. Wound healing assay was carried out as in (A) except that the complete culture medium added after scratching was supplied with the corresponding concentrations of tubacin as indicated. Scale bar, 50 μm. (E and F) Experiments were performed as in (D), and the ability of SH-SY5Y cell migration was reflected by counting the cells that had migrated to the wound area 12 h (E) and 24 h (F) after scratching. The amount of migrated cells was normalized to the control group. n = 9 fields per group. Two-tailed Student's t-test for all graphs. *P < 0.05, **P < 0.01, ***P < 0.001, compared with the control; ns, not significant. Data represent means ± SD.
Moreover, we also investigated the effects of HDAC6 on additional 2 human malignant neuroblastoma cell lines, BE(2)-M17 and SK-N-SH cells. As shown in Figure S1A and B, decrease of HDAC6 expression by RNA interference moderately inhibited the migration ability of BE(2)-M17 cells 12 h after scratching. The inhibitory effects of HDAC6 downregulation on BE(2)-M17 cell migration were significant 24 h after scratching (P = 0.0055 and P = 0.0062 compared to the control, respectively) (Fig. S1A and C). Tubacin inhibited BE(2)-M17 cell migration in a dose-dependent manner (Fig. S1D-F). Tubacin treatment at 10 μM dramatically impaired the migration ability of BE(2)-M17 cells (P < 0.001) (Fig. S1E and F). As for the effects of HDAC6 on SK-N-SH cells, similar results were obtained in the wound healing assay (Fig. S2). That is, downregulation of HDAC6 expression by siRNAs notably inhibited SK-N-SH cell migration (Fig. S2A-C). Tubacin at the concentrations not lower than 1 μM showed significant inhibitory effects on the migration ability of SK-N-SH cells (Fig. S2D-F).
To assess the side effects of HDAC6 downregulation or inhibition on human normal cells which are distributed in the nervous system, we examined whether the loss of HDAC6 affects the cell migration ability of HEB cells, a human normal brain glial cell line. As shown in Figure S3A, the migration ability of HEB cells was only slightly suppressed by HDAC6 siRNAs. The inhibitory effect of HDAC6 downregulation on HEB cell migration was not as significant as that on the 3 neuroblastoma cell lines (Fig. S3B and C). Inhibition of HDAC6 catalytic activity by tubacin treatment only resulted in a slight decrease of the migration ability of HEB cells (Fig. S3D-F). Collectively, these data demonstrate that downregulation of HDAC6 expression or inhibition of HDAC6 activity dramatically impedes neuroblastoma cell migration with only slight inhibitory effect on normal brain glial cells. HDAC6 may act as a positive regulator of neuroblastoma cell migration.
Downregulation of HDAC6 expression or inhibition of its activity suppresses the invasion of SH-SY5Y cells
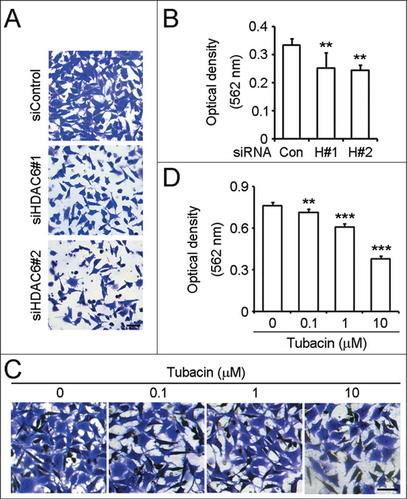
We next examined the effects of HDAC6 on neuroblastoma cell invasion. By trans-matrigel invasion assay, we found that downregulation of HDAC6 expression dramatically impaired the ability of SH-SY5Y cell invasion (). Compared to the control group, the invasion ability of cells transfected with HDAC6 siRNAs was decreased by nearly 30% (). Inhibition of the catalytic activity of HDAC6 by the pharmacological inhibitor tubacin significantly suppressed SH-SY5Y cell invasion ( ). As shown in , the invasion ability of SH-SY5Y cells treated with 10 μM tubacin for 24 h was reduced by approximately 50% without affecting SH-SY5Y cell viability (). So these data indicate that SH-SY5Y cell invasion ability is regulated by HDAC6.
Figure 4. Downregulation of HDAC6 expression or inhibition of its activity suppresses SH-SY5Y cell invasion. (A) SH-SY5Y cells transfected with control or HDAC6 siRNAs were seeded onto the inside of the transwell insert precoated with matrigel, and the insert was placed in a 24-well plate containing complete culture medium. After 24 h, cells invaded to the underside of the insert were stained with crystal violet solution. Scale bar, 50 μm. (B) Experiments were performed as in (A), and the ability of SH-SY5Y cell invasion was reflected by measuring the optical density of the extract by 10% acetic acid at 562 nm wavelength. n = 4 individual experiments per group. Two-tailed Student's t-test for all graphs. *P < 0.05, **P < 0.01, ***P < 0.001, compared with the control; ns, not significant. Data represent means ± SD (C) SH-SY5Y cells were pretreated with tubacin at the indicated concentrations for 4 h. Trans-matrigel invasion assay was performed as in (A) except that both the upper and the lower medium were supplied with the corresponding concentrations of tubacin as indicated. Scale bar, 50 μm. (D) Experiments were performed as in (C), and the ability of SH-SY5Y cell invasion was analyzed as in (B).
However, by the same assay, we failed to detect the effects of HDAC6 on the trans-matrigel invasion abilities of BE(2)-M17 and SK-N-SH cells. 5 × 10⁴ BE(2)-M17 or SK-N-SH cells suspended in serum-free medium were added to the inside of the transwell insert precoated with matrigel, and the insert was then placed in a 24-well plate containing complete culture medium. Cells were allowed to invade for 24 h in a humidified atmosphere with 5% CO2 at 37°C. However, very few cells had invaded through the insert membrane even in the control groups. The optical densities were too low to reflect the effects of HDAC6 on the invasion of BE(2)-M17 or SK-N-SH cells.
We then evaluated the effects of HDAC6 on the invasion of HEB cells. As shown in Figure S4A and B, downregulation of HDAC6 expression by RNA interference had little effect on HEB cell invasion. Low concentration of tubacin treatment did not suppress HEB cell invasion (Fig. S4C and D). Moreover, the inhibitory effect of tubacin treatment at 10 μM on HEB cell invasion was not as significant as that on SH-SY5Y cells (P = 0.0386 vs. P < 0.0001) (Fig. S4D; ). Taken together, these findings reveal that downregulation of HDAC6 expression or inhibition of HDAC6 activity significantly suppresses the invasion ability of SH-SY5Y cells but only slightly affects that of HEB cells. Nevertheless, the roles of HDAC6 in neuroblastoma cell invasion need to be confirmed by testing its effects on other human neuroblastoma cell lines.
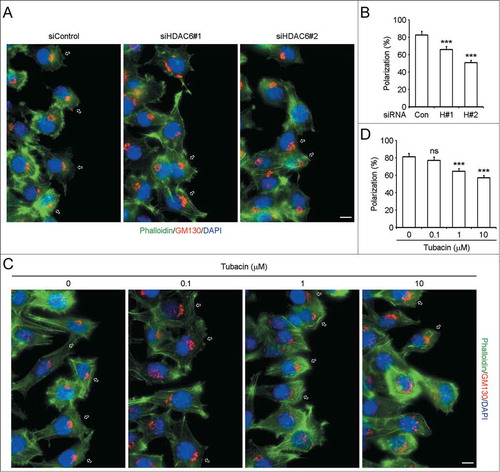
Downregulation of HDAC6 expression or inhibition of its activity disturbs SH-SY5Y cell polarization
To gain more insight into the effects of HDAC6 on neuroblastoma cell motility, we further explored the involvement of HDAC6 in SH-SY5Y cell polarization, which is the first step of cell migration.Citation10,11 SH-SY5Y cells transfected with control or HDAC6 siRNAs were scratched, and cells were fixed 3 h later and stained with anti-GM130 antibody, fluorescein-phalloidin, and DAPI to visualize Golgi apparatus, F-actin, and nuclei. In the control group, more than 80% of the cells at the wound margin exhibited a typical polarized morphology (indicated by hollow arrows) with the Golgi apparatus positioned between the nucleus and the leading edge (). In contrast, the polarized structure of cells transfected with HDAC6 siRNAs was disrupted to a certain degree (), and the percentage of polarized cells was markedly decreased (P < 0.0001) (). We also examined the effects of tubacin on SH-SY5Y cell polarization. As shown in , tubacin treatment interfered SH-SY5Y cell polarization in a concentration-dependent manner. Tubacin at the concentrations not lower than 1 μM significantly disturbs SH-SY5Y cell polarization (P < 0.001) (). These findings thus reveal that HDAC6 mediates cell polarization of SH-SY5Y cells.
Figure 5. Downregulation of HDAC6 expression or inhibition of its activity disturbs SH-SY5Y cell polarization. (A) SH-SY5Y cells transfected with control or HDAC6 siRNAs were scratched, and cells were fixed 3 h later and stained with anti-GM130 antibody, fluorescein-phalloidin, and DAPI to visualize Golgi apparatus (red), F-actin (green), and nuclei (blue), respectively. Hollow arrows indicate polarized cells. Scale bar, 10 μm. (B) Experiments were performed as in (A), and the percentage of polarized cells at the wound margin was quantified. n = 60 cells per group. Two-tailed Student's t-test for all graphs. *P < 0.05, **P < 0.01, ***P < 0.001, compared with the control; ns, not significant. Data represent means ± SD (C) SH-SY5Y cells were pretreated with tubacin at the indicated concentrations for 4 h. Cells were then scratched and incubated with complete culture medium containing the corresponding concentrations of tubacin for additional 3 h. Staining was carried out as in (A). Scale bar, 10 μm. (D) Experiments were performed as in (C), and the percentage of polarized cells at the wound margin was quantified. n = 50 cells per group. Two-tailed Student's t-test for all graphs. *P < 0.05, **P < 0.01, ***P < 0.001, compared with the control; ns, not significant. Data represent means ± SD.
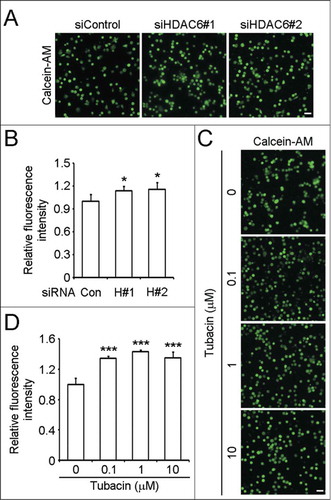
Downregulation of HDAC6 expression or inhibition of its activity enhances SH-SY5Y cell adhesion
We then investigated whether HDAC6 has a regulatory effect on neuroblastoma cell adhesion, which is also critical for cell migration.Citation10,11 SH-SY5Y cells transfected with control or HDAC6 siRNAs were labeled with calcein-AM and seeded in precoated plates to allow the occurrence of adhesion. By microscopy analysis and measuring the fluorescence intensities, we found that HDAC6 knockdown markedly enhanced SH-SY5Y cell adhesion (). As reported previously, adhesion turnover is a rate-limiting step of cell migration.Citation20 Abnormally enhanced adhesion impedes the deadhesion at the trailing edge during migration and slows down the migration rate. Thus the enhanced cell adhesion caused by HDAC6 siRNAs may contribute to their inhibitory effects on SH-SY5Y cell migration (). We also analyzed the influences of tubacin on SH-SY5Y cell adhesion. Compared to the control group, tubacin treatment increased the amount of adherent cells by more than 30% (). Altogether, these results indicate that HDAC6 regulates SH-SY5Y cell adhesion, and is critically required for adhesion turnover of SH-SY5Y cells.
Figure 6. Downregulation of HDAC6 expression or inhibition of its activity enhances SH-SY5Y cell adhesion. (A) SH-SY5Y cells transfected with control or HDAC6 siRNAs were labeled with calcein-AM, and seeded in precoated plates. Non adherent cells were washed away 1 h later, and images of adherent cells were taken. Scale bar, 100 μm. (B) Experiments were performed as in (A), and the fluorescence intensities of adherent cells were measured and normalized to the control group. n = 4 individual experiments per group. Two-tailed Student's t-test for all graphs. *P < 0.05, **P < 0.01, ***P < 0.001, compared with the control; ns, not significant. Data represent means ± SD (C) SH-SY5Y cells were pretreated with tubacin at the indicated concentrations for 4 h. Cell adhesion assay was carried out as (A) except that the culture medium used in the process of adhesion was supplied with tubacin at the corresponding concentrations. Scale bar, 100 μm. (D) Experiments were performed as in (C), and the fluorescence intensities of adherent cells were measured and normalized to the control group. n = 4 individual experiments per group. Two-tailed Student's t-test for all graphs. *P < 0.05, **P < 0.01, ***P < 0.001, compared with the control; ns, not significant. Data represent means ± SD.
Discussion
HDAC6, a unique member of the HDAC family, contains 2 fully functional catalytic domains and predominantly resides in the cytoplasm.Citation21 Previous work has demonstrated that HDAC6 is overexpressed in a variety of cancer cell lines and tumor samples,Citation14-Citation17 and the upregulation of HDAC6 correlates with the survival of tumor cells and cancer metastasis.Citation22 These studies indicate that HDAC6 may serve as a potential marker for the diagnosis and prognosis of certain cancers. Being predominantly cytoplasmic, HDAC6 reversibly regulates the acetylation of cytosolic proteins, among which α-tubulin and cortactin have been characterized to be the substrates of HDAC6.Citation12,13 By modulating the acetylation of α-tubulin and cortactin, HDAC6 participates in the regulation of microtubule- and actin-dependent cell movement.Citation12,13 Overexpression of HDAC6 promotes tumor dissemination by increasing tumor cell motility.Citation16,23,24
Several studies have linked HDAC inhibitors to neuroblastoma cells.Citation25-Citation33 HDAC inhibitors significantly inhibit neuroblastoma cell growth, induce cell cycle arrest, and trigger apoptosis.Citation25-Citation33 Particularly, HDAC6 has been reported to be one of the targets of HDAC inhibitors in triggering neuroblastoma cell apoptosis.Citation34 In neuroblastoma cells, HDAC6 is involved in Bax-dependent apoptosis by deacetylation of Ku70 and regulation of the interaction between Ku70 and Bax.Citation34 However, the effects of HDAC6 on neuroblastoma dissemination are unclear. Considering neuroblastoma is a malignant tumor with high rates of metastasis,Citation2,7 elucidation of the roles of HDAC6 in regulating neuroblastoma cell motility will be of great importance.
According to our study, HDAC6 expression in neuroblastoma tissue samples varies with the site of the tumor. Although neuroblastoma can occur at any site in the sympathetic nervous system, adrenal glands have been described as the most common sites of origin.Citation1 Intriguingly, we find that HDAC6 is highly expressed in neuroblastoma from mediastinum, abdominal cavity, and pelvic cavity, but not adrenal glands. Due to the lack of information about the primary sites of the tumor samples, we proposed 2 possible presumptions. The one is that neuroblastoma derived from mediastinum, abdominal cavity, and pelvic cavity is more malignant, and HDAC6 is upregulated to improve tumor cell survival. The other is that neuroblastoma in mediastinum, abdominal cavity, and pelvic cavity originates from adrenal neuroblastoma via metastasis, which indicates that HDAC6 is highly expressed in disseminated neuroblastoma. Considering previous studies have focused on the correlation between HDAC6 and neuroblastoma cell survival,Citation25-Citation33 we thus investigated the effects of HDAC6 on neuroblastoma cell motility.
Our findings indicate that HDAC6 regulates neuroblastoma cell migration and modulates the invasion of SH-SY5Y cells without affecting cell proliferation, which concurs with previous reports in other cell types.Citation35 Cell polarization and adhesion are critical steps for directional migration.Citation10,11 Our study reveals that HDAC6 regulates SH-SY5Y cell migration by modulating the establishment of cell polarity and adhesion turnover. Decrease of HDAC6 expression or inhibition of its activity leads to impaired polarized morphology, which impedes efficient migration. Besides, the ability of cell adhesion is enhanced, which further slows down the migration rate. Our data are in consistent with a previous study demonstrating that HDAC6 inhibition leads to an increase of focal adhesion accumulation and thus a decrease in cell motility.Citation24
The data presented here support the conclusion that HDAC6 acts as a positive regulator of neuroblastoma cell motility. It is easy to interpret our findings that downregulation of HDAC6 expression or inhibition of its catalytic activity dramatically impedes neuroblastoma cell migration and affects the invasion ability of neuroblastoma cells with slight side effects on normal cells in the nervous system. Thus targeting HDAC6 by specific inhibitors may be a potential and feasible anticancer strategy to therapeutically block neuroblastoma dissemination.
Considering that HDAC inhibitors in general are associated with toxicities,Citation36,37 it is of great importance to fully address the toxicity of a HDAC inhibitor before it can be used for clinical trials. Tubacin, a specific inhibitor of HDAC6,Citation35 has been demonstrated to be able to induce apoptosis of multiple myeloma cells in vitro,Citation38 prevent estradiol-stimulated estrogen receptor α-positive breast cancer cell motility,Citation23 inhibit transforming growth factor β-induced epithelial-to-mesenchymal transition,Citation39 and kill Epstein-Barr virus (EBV)-Burkitt lymphoma cells and EBV lymphoblastoid cells in vitro.Citation40 Nevertheless, the toxicity profile of tubacin is not yet known. According to the wound healing assay and trans-matrigel invasion assay, we find that human malignant neuroblastoma cells are more sensitive and vulnerable to the decrease of HDAC6 expression or catalytic activity when compared to the normal brain glial cells. It is tempting to speculate that there is an optimal concentration at which tubacin effectively blocks neuroblastoma dissemination with minimal side effects on normal cells. Combination of HDAC6 inhibitors and current multimodal therapies could provide a promising therapeutic strategy for the treatment of malignant neuroblastoma and improve the prognosis.
Materials and Methods
Antibodies and reagents
Antibodies against HDAC6 (Santa Cruz Biotechnology), acetylated α-tubulin (Sigma-Aldrich), α-tubulin and GM130 (Abcam), horseradish peroxidase-conjugated secondary antibodies (Amersham Biosciences), and rhodamine-conjugated secondary antibody (Jackson ImmunoResearch Laboratories) were obtained from the indicated sources. Fluorescein-phalloidin, 3-(4,5-dimethyl-2-thiazolyl)-2,5-diphenyl-2H-tetrazolium bromide (MTT), sulforhodamine B (SRB), calcein-acetoxymethyl (calcein-AM), and 4′,6-diamidino-2-phenylindole (DAPI) were purchased from Sigma-Aldrich.
Cell culture and transfection
A human normal brain glial cell line (HEB cells) and 3 human malignant neuroblastoma cell lines (SH-SY5Y, BE(2)-M17, and SK-N-SH cells) were purchased from the American Type Culture Collection (ATCC) and cultured in Dulbecco's Modified Eagle's Medium (DMEM) supplemented with 10% fetal bovine serum (FBS) in a humidified atmosphere with 5% CO2 at 37°C. HDAC6 and control (luciferase) siRNAs were chemically synthesized by RiboBio and transfected into cells with the Lipofectamine 2000 reagent (Invitrogen).
Drug treatment
Tubacin was obtained from Stuart Schreiber (Harvard Medical School) and dissolved in DMSO to create the stock solution (10 mM). Serial dilutions were carried out using DMEM. Cells were incubated with tubacin at different concentrations or equivalent volume of vehicle (DMSO) as control for durations as indicated respectively.
Immunohistochemistry
Tissue arrays (AD2081, MC803a, and MC809a) were purchased from US Biomax to detect HDAC6 expression levels in neuroblastoma samples. For immunohistochemistry, briefly, tissue array slides were deparaffinized in xylene and hydrated through graded ethanol/water dilutions. The slides were incubated with 3% H2O2 to inactivate endogenous peroxidases followed by antigen retrieval with EDTA antigen retrieval solution (Beyotime). Then the slides were blocked with 2% bovine serum albumin (Sigma-Aldrich) in PBS and incubated in succession with anti-HDAC6 antibody and horseradish peroxidase-conjugated secondary antibody. HDAC6 was visualized by using DAB horseradish peroxidase color development kit (Beyotime) following the manufacturer's instructions. The slides were then counterstained with hematoxylin to visualize the nuclei, dehydrated, and mounted in Pertex mounting media (Leica Biosystems). Images were obtained using a Leica DM3000 microscope.
RT-PCR
Total RNA was isolated from SH-SY5Y cells using the TRIzol reagent (Invitrogen) according to the manufacturer's instructions. The isolated RNA was reverse-transcribed into cDNA by reverse transcriptase (Promega). The regular PCR reaction was carried out using the above cDNA samples as templates to detect the mRNA levels of HDAC6 (forward primer, 5′-TCA GGT CTA CTG TGG TCG TT-3′; reverse primer, 5′-TCT TCA CAT CTA GGA GAG CC-3′) and GAPDH (forward primer, 5′-ATC ACT GCC ACC CAG AAG AC-3′; reverse primer, 5′-ATG AGG TCC ACC ACC CTG TT-3′) as control.
Immunoblotting
Cells were lysed in a buffer containing 1% Nonidet P40, 150 mM NaCl, 1 mM EDTA, and 50 mM Tris (pH 7.5). Protein samples were seperated by SDS-PAGE and transferred onto polyvinylidene difluoride membranes (Millipore). The membranes were blocked with 5% fat-free milk in Tris-buffered saline containing 0.1% Tween 20 and incubated with primary antibodies and then horseradish peroxidase-conjugated secondary antibodies. Specific proteins were visualized with enhanced chemiluminescence detection reagent following the manufacturer's instructions (Pierce Biotechnology).
Cell proliferation assays
1 × 10⁴cells per well were seeded in 96-well tissue culture plates. For MTT assay, MTT reagent in PBS was added to each well at different time points, and the cultures were incubated for additional 4 h. DMSO was added after the MTT solution was removed. The optical density was then determined at 562 nm wavelength. For SRB assay, cells were fixed at different time points with 10% trichloroacetic acid at 4°C for 1 h and stained with 0.4% SRB dissolved in 1% acetic acid. The cells were then washed with 1% acetic acid to remove unbound SRB. The protein-bound dye was extracted with 10 mM Tris (pH 10.5), and the optical density was determined at 490 nm wavelength. Experiments were carried out in triplicate.
Wound healing assay
Confluent monolayers of cells cultured in 24-well plates in serum-free medium were mechanically scratched with a 10-μL pipette tip to generate the wound. Cells were washed with PBS to remove the debris, and complete culture medium was then added to allow wound healing. Phase-contrast images of the wound were taken 0, 12 and 24 h after scratching. The ability of cell migration was reflected by counting the cells that had migrated to the wound area.
Trans-matrigel invasion assay
5 × 10⁴ cells suspended in serum-free medium were added to the inside of the transwell insert (Falcon) precoated with matrigel (BD Biosciences), and the insert was then placed in a 24-well plate containing complete culture medium. After 24 h, cells on the inside of the transwell insert were removed with a cotton swab, and cells on the underside of the insert were fixed with 4% paraformaldehyde and stained with crystal violet solution. Five randomly selected fields were photographed. The ability of cell invasion was reflected by measuring the optical density of the extract by 10% acetic acid at 562 nm wavelength.
Immunofluorescence microscopy
Cells grown on glass coverslips were fixed with 4% paraformaldehyde for 30 min at room temperature. Cells were treated with 0.5% Triton X-100 in PBS for permeabilization and blocked with 2% bovine serum albumin in PBS. Cell were then incubated in succession with anti-GM130 antibody and rhodamine-conjugated secondary antibody followed by staining with fluorescein-phalloidin for 30 min. Nuclei were stained with DAPI for 3 min. Coverslips were mounted with 90% glycerol in PBS, and images were obtained using an Axio Observer A1 fluorescence microscope (Carl Zeiss Inc.).
Cell adhesion assay
The capacity of cell adhesion was evaluated by calcein-AM assay. Briefly, cells were incubated with serum-free medium containing 2 μM calcein-AM at 37°C in the dark for 30 min to prepare labeled cells. Cells were then washed with PBS to remove excess calcein-AM, and were resuspended in complete culture medium. 3 × 10⁴ labeled cells were plated in each well of 96-well tissue culture plates precoated with matrigel, and incubated at 37°C for 1 h to allow cells to adhere. Each well was then gently washed with PBS to remove non adherent cells. Three randomly selected fields were photographed, and the fluorescence was measured at an excitation wavelength of 480 nm and an emission wavelength of 530 nm using the TriStar LB941 (Berthold Technologies).
Statistical analysis
Analysis of statistical significance was performed by 2-tailed Student's t-test using GraphPad Prism 5. *P < 0.05, **P < 0.01, ***P < 0.001, compared with the control; ns, not significant. Data represent means ± SD.
Disclosure of Potential Conflicts of Interest
No potential conflicts of interest were disclosed.
956632_Supplementary_Materials.zip
Download Zip (10.5 MB)Funding
This work was supported by grants from the National Natural Science Foundation of China (31171334 and 31371382), the Tianjin Natural Science Foundation (13JCZDJC30300), and the 111 Project of the Ministry of Education of China (B08011).
Supplemental Material
Supplemental data for this article can be accessed on the publisher's website.
References
- Brodeur GM, Pritchard J, Berthold F, Carlsen NL, Castel V, Castelberry RP, De Bernardi B, Evans AE, Favrot M, Hedborg F, et al. Revisions of the international criteria for neuroblastoma diagnosis, staging, and response to treatment. J Clin Oncol 1993; 11:1466-77; PMID:8336186
- Schor NF. New approaches to pharmacotherapy of tumors of the nervous system during childhood and adolescence. Pharmacol Ther 2009; 122:44-55; PMID:19318043
- Brodeur GM. Neuroblastoma: biological insights into a clinical enigma. Nat Rev Cancer 2003; 3:203-16; PMID:12612655
- Cotterill SJ, Pearson AD, Pritchard J, Kohler JA, Foot AB, European Neuroblastoma Study G, United Kingdom Children's Cancer Study G. Late relapse and prognosis for neuroblastoma patients surviving 5 years or more: a report from the European Neuroblastoma Study Group "Survey". Med Pediatr Oncol 2001; 36:235-8; PMID:11464893
- Maris JM. Recent advances in neuroblastoma. N Engl J Med 2010; 362:2202-11; PMID:20558371
- Aronson MR, Smoker WR, Oetting GM. Hemorrhagic intracranial parenchymal metastases from primary retroperitoneal neuroblastoma. Pediatr Radiol 1995; 25:284-5; PMID:7567239
- Ara T, DeClerck YA. Mechanisms of invasion and metastasis in human neuroblastoma. Cancer Metastasis Rev 2006; 25:645-57; PMID:17160711
- Palmer TD, Ashby WJ, Lewis JD, Zijlstra A. Targeting tumor cell motility to prevent metastasis. Adv Drug Deliv Rev 2011; 63:568-81; PMID:21664937
- Wells A, Grahovac J, Wheeler S, Ma B, Lauffenburger D. Targeting tumor cell motility as a strategy against invasion and metastasis. Trends Pharmacol Sci 2013; 34:283-9; PMID:23571046
- Lauffenburger DA. Cell motility. Making connections count. Nature 1996; 383:390-1; PMID:8837766
- Lauffenburger DA, Horwitz AF. Cell migration: a physically integrated molecular process. Cell 1996; 84:359-69; PMID:8608589
- Hubbert C, Guardiola A, Shao R, Kawaguchi Y, Ito A, Nixon A, Yoshida M, Wang XF, Yao TP. HDAC6 is a microtubule-associated deacetylase. Nature 2002; 417:455-8; PMID:12024216
- Zhang X, Yuan Z, Zhang Y, Yong S, Salas-Burgos A, Koomen J, Olashaw N, Parsons JT, Yang XJ, Dent SR, et al. HDAC6 modulates cell motility by altering the acetylation level of cortactin. Mol Cell 2007; 27:197-213; PMID:17643370
- Bradbury CA, Khanim FL, Hayden R, Bunce CM, White DA, Drayson MT, Craddock C, Turner BM. Histone deacetylases in acute myeloid leukaemia show a distinctive pattern of expression that changes selectively in response to deacetylase inhibitors. Leukemia 2005; 19:1751-9; PMID:16121216
- Sakuma T, Uzawa K, Onda T, Shiiba M, Yokoe H, Shibahara T, Tanzawa H. Aberrant expression of histone deacetylase 6 in oral squamous cell carcinoma. Int J Oncol 2006; 29:117-24; PMID:16773191
- Bazzaro M, Lin Z, Santillan A, Lee MK, Wang MC, Chan KC, Bristow RE, Mazitschek R, Bradner J, Roden RB. Ubiquitin proteasome system stress underlies synergistic killing of ovarian cancer cells by bortezomib and a novel HDAC6 inhibitor. Clin Cancer Res 2008; 14:7340-7; PMID:19010849; http://dx.doi.org/10.1158/1078-0432.CCR-08-0642
- Li D, Sun X, Zhang L, Yan B, Xie S, Liu R, Liu M, Zhou J. Histone deacetylase 6 and cytoplasmic linker protein 170 function together to regulate the motility of pancreatic cancer cells. Protein Cell 2013.
- Berridge MV, Herst PM, Tan AS. Tetrazolium dyes as tools in cell biology: new insights into their cellular reduction. Biotechnol Annu Rev 2005; 11:127-52; PMID:16216776; http://dx.doi.org/10.1016/S1387-2656(05)11004-7
- Vichai V, Kirtikara K. Sulforhodamine B colorimetric assay for cytotoxicity screening. Nat Protoc 2006; 1:1112-6; PMID:17406391; http://dx.doi.org/10.1038/nprot.2006.179
- Huttenlocher A, Palecek SP, Lu Q, Zhang W, Mellgren RL, Lauffenburger DA, Ginsberg MH, Horwitz AF. Regulation of cell migration by the calcium-dependent protease calpain. J Biol Chem 1997; 272:32719-22; PMID:9407041; http://dx.doi.org/10.1074/jbc.272.52.32719
- Verdel A, Curtet S, Brocard MP, Rousseaux S, Lemercier C, Yoshida M, Khochbin S. Active maintenance of mHDA2/mHDAC6 histone-deacetylase in the cytoplasm. Curr Biol 2000; 10:747-9; PMID:10873806; http://dx.doi.org/10.1016/S0960-9822(00)00542-X
- Aldana-Masangkay GI, Sakamoto KM. The role of HDAC6 in cancer. J Biomed Biotechnol 2011; 2011:875824; PMID:21076528; http://dx.doi.org/10.1155/2011/875824
- Saji S, Kawakami M, Hayashi S, Yoshida N, Hirose M, Horiguchi S, Itoh A, Funata N, Schreiber SL, Yoshida M, et al. Significance of HDAC6 regulation via estrogen signaling for cell motility and prognosis in estrogen receptor-positive breast cancer. Oncogene 2005; 24:4531-9; PMID:15806142; http://dx.doi.org/10.1038/sj.onc.1208646
- Tran AD, Marmo TP, Salam AA, Che S, Finkelstein E, Kabarriti R, Xenias HS, Mazitschek R, Hubbert C, Kawaguchi Y, et al. HDAC6 deacetylation of tubulin modulates dynamics of cellular adhesions. J Cell Sci 2007; 120:1469-79; PMID:17389687; http://dx.doi.org/10.1242/jcs.03431
- Coffey DC, Kutko MC, Glick RD, Swendeman SL, Butler L, Rifkind RA, Marks PA, Richon VM, La Quaglia MP. Histone deacetylase inhibitors and retinoic acids inhibit growth of human neuroblastoma in vitro. Med Pediatr Oncol 2000; 35:577-81; PMID:11107121; http://dx.doi.org/10.1002/1096-911X(20001201)35:6
- Coffey DC, Kutko MC, Glick RD, Butler LM, Heller G, Rifkind RA, Marks PA, Richon VM, La Quaglia MP. The histone deacetylase inhibitor, CBHA, inhibits growth of human neuroblastoma xenografts in vivo, alone and synergistically with all-trans retinoic acid. Cancer Res 2001; 61:3591-4; PMID:11325825
- Tang XX, Robinson ME, Riceberg JS, Kim DY, Kung B, Titus TB, Hayashi S, Flake AW, Carpentieri D, Ikegaki N. Favorable neuroblastoma genes and molecular therapeutics of neuroblastoma. Clin Cancer Res 2004; 10:5837-44; PMID:15355914; http://dx.doi.org/10.1158/1078-0432.CCR-04-0395
- Ouwehand K, de Ruijter AJ, van Bree C, Caron HN, van Kuilenburg AB. Histone deacetylase inhibitor BL1521 induces a G1-phase arrest in neuroblastoma cells through altered expression of cell cycle proteins. FEBS Lett 2005; 579:1523-8; PMID:15733867; http://dx.doi.org/10.1016/j.febslet.2005.01.058
- Subramanian C, Opipari AW, Jr., Bian X, Castle VP, Kwok RP. Ku70 acetylation mediates neuroblastoma cell death induced by histone deacetylase inhibitors. Proc Natl Acad Sci U S A 2005; 102:4842-7; PMID:15778293; http://dx.doi.org/10.1073/pnas.0408351102
- Subramanian C, Jarzembowski JA, Opipari AW, Jr., Castle VP, Kwok RP. CREB-binding protein is a mediator of neuroblastoma cell death induced by the histone deacetylase inhibitor trichostatin A. Neoplasia 2007; 9:495-503; PMID:17603632; http://dx.doi.org/10.1593/neo.07262
- Muhlethaler-Mottet A, Meier R, Flahaut M, Bourloud KB, Nardou K, Joseph JM, Gross N. Complex molecular mechanisms cooperate to mediate histone deacetylase inhibitors anti-tumour activity in neuroblastoma cells. Mol Cancer 2008; 7:55; PMID:18549473
- Francisco R, Perez-Perarnau A, Cortes C, Gil J, Tauler A, Ambrosio S. Histone deacetylase inhibition induces apoptosis and autophagy in human neuroblastoma cells. Cancer Lett 2012; 318:42-52; PMID:22186300
- Zhan Q, Tsai S, Lu Y, Wang C, Kwan Y, Ngai S. RuvBL2 is involved in histone deacetylase inhibitor PCI-24781-induced cell death in SK-N-DZ neuroblastoma cells. PLoS One 2013; 8:e71663; PMID:23977108
- Subramanian C, Jarzembowski JA, Opipari AW, Jr., Castle VP, Kwok RP. HDAC6 deacetylates Ku70 and regulates Ku70-Bax binding in neuroblastoma. Neoplasia 2011; 13:726-34; PMID:21847364
- Haggarty SJ, Koeller KM, Wong JC, Grozinger CM, Schreiber SL. Domain-selective small-molecule inhibitor of histone deacetylase 6 (HDAC6)-mediated tubulin deacetylation. Proc Natl Acad Sci U S A 2003; 100:4389-94; PMID:12677000
- Minucci S, Pelicci PG. Histone deacetylase inhibitors and the promise of epigenetic (and more) treatments for cancer. Nat Rev Cancer 2006; 6:38-51; PMID:16397526
- Karagiannis TC, El-Osta A. Will broad-spectrum histone deacetylase inhibitors be superseded by more specific compounds? Leukemia 2007; 21:61-5; PMID:17109024
- Hideshima T, Bradner JE, Wong J, Chauhan D, Richardson P, Schreiber SL, Anderson KC. Small-molecule inhibition of proteasome and aggresome function induces synergistic antitumor activity in multiple myeloma. Proc Natl Acad Sci U S A 2005; 102:8567-72; PMID:15937109
- Shan B, Yao TP, Nguyen HT, Zhuo Y, Levy DR, Klingsberg RC, Tao H, Palmer ML, Holder KN, Lasky JA. Requirement of HDAC6 for transforming growth factor-beta(1)-induced epithelial-mesenchymal transition. J Biol Chem 2008; 283:21065-73; PMID:18499657
- Kawada J, Zou P, Mazitschek R, Bradner JE, Cohen JI. Tubacin kills Epstein-Barr virus (EBV)-Burkitt lymphoma cells by inducing reactive oxygen species and EBV lymphoblastoid cells by inducing apoptosis. J Biol Chem 2009; 284:17102-9; PMID:19386607