
Abstract
Several microRNAs (miRNA) have been implicated in H. pylori related gastric cancer (GC). However, the molecular mechanism of miRNAs in gastric cancer has not been fully understood. In this study, we reported that miR-101 is significantly down-regulated in H. pylori positive tissues and cells and in tumor tissues with important functional consequences. Ectopic expression of miR-101 dramatically suppressed cell proliferation and colony formation by inducing G1-phase cell-cycle arrest. We found that miR-101 strongly reduced the expression of SOCS2 oncogene in GC cells. Similar to the restoring miR-26 expression, SOCS2 down-regulation inhibited cell growth and cell-cycle progression, whereas SOCS2 over-expression rescued the suppressive effect of miR-101. Mechanistic investigations revealed that miR-101 suppressed the expression of c-myc, CDK2, CDK4, CDK6, CCND2, CCND3, and CCNE2, while promoted tumor suppressor p14, p16, p21 and p27 expression. In clinical specimens, SOCS2 was over-expressed in tumors and H. pylori positive tissues and its mRNA levels were inversely correlated with miR-101 expression. Taken together, our results indicated that miR-101 functions as a growth-suppressive miRNA in H. pylori related GC, and that its suppressive effects are mediated mainly by repressing SOCS2 expression.
Abbreviations
| CDK | = | cyclin-dependent kinase |
| GC | = | gastric cancer |
| miRNA | = | microRNA |
| MOI | = | multiplicity of infection |
| mt | = | mutant |
| PVDF | = | polyvinylidene difluoride |
| qRT-PCR | = | quantitative real-time |
| UTR | = | untranslated regions |
| wt | = | wild-type |
Introduction
Gastric cancer (GC) is the fourth most common cancer and the second leading cause of cancer-related death worldwide.Citation1 Three major etiologic factors of GC include genetic susceptibility, environmental factors, and H. pylori infection, however, the molecular mechanism of its pathogenesis is not yet fully understood.Citation2 GC remains difficult to cure primarily because most of patients present with advanced disease. Even patients who present in the most favorable condition and who undergo surgical resection often die of recurrent disease.Citation3 Therefore, there is an urgent need to seek for novel biomarkers for the early diagnosis of gastric cancer and new targets for gastric cancer therapy.
MicroRNAs (miRNA) are a diverse class of small, non-protein-coding RNAs that function as critical gene regulators. Bioinformatic analyses indicate that each miRNA regulates hundreds of target genes which involved in both physiological and pathological events, such as proliferation, migration, differentiation, apoptosis, etc in development and pathogenesis.Citation4 To date, several human and H. pylori associated miRNAs have been shown to be dysregulated in GC, such as let-75 and miR-141,Citation6 which contribute to the development and progression of GC. These findings suggest the involvement of miRNAs in GC tumorigenesis. A recent study has shown that miR-101 is downregulated in H. pylori positive tissues compared with normal tissues by miRNA microarray analysis.Citation7 However, the role of miR-101 has not been documented in H. pylori-related GC.
In this study, we investigated the potential involvement of miR-101 in H. pylori related GC. We examined the expression level of miR-101 in human GC cells and tissues with or without H. pylori infection and tested its effects on cell growth, cell-cycle distribution, and colony formation. In addition, we also investigated a potential role of miR-101 on GC tumorigenesis in a nude mice model. Finally, we explored the underlying mechanism of miR-101 and its targeted gene SOCS2 functions. Our study will provide a better understanding of H. pylori related gastric cancer pathogenesis.
Results
MiR-101 was down-regulated in human H. pylori infected cells and clinical specimens
The patients’ information was listed in Supplementary Table 1 and 2. We examined the expression level of miR-101 in 50 pairs of H. pylori positive and negative tissues by qRT-PCR. We found that the average expression level of miR-101 was significantly lower in H. pylori infected tissues (, p < 0.01). Then we divided the 50 H. pylori infected patients into 3groups (superficial gastritis, atrophic gastritis and metaplasia) according to their gastric pathology. It showed that miR-101 expressed significantly lower when more severity of the gastric pathology (, p < 0.05). We also found that miR-101 expression was lower in H. pylori positive tumor tissues than negative tumor tissues (, p < 0.05) and in tumor tissues than controls (, p<0.05).
Figure 1. The expression of miR-101 was reduced in cell lines and clinical specimen. A, expression of miR-101 in H. pylori positive and negative tissues. B, expression of miR-101 in different severity of gastric pathology. C, expression of miR-101 in H. pylori positive and negative tumor tissues. D, expression of miR-101 in tumor tissues and normal tissues. E, expression of miR-101 in different MOI of H. pylori infected tissues. F, expression of miR-101 in 2 GC cell lines. (*p < 0.05; **p < 0.01 compared with control)
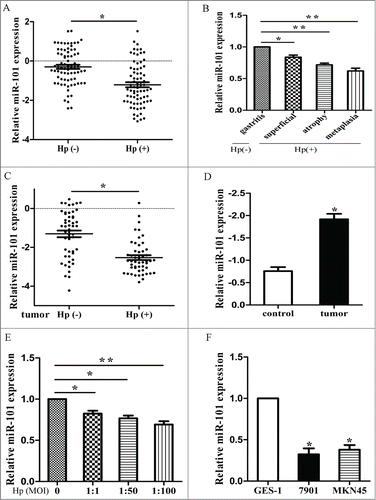
We further examined the expression level of miR-101 in vitro. We co-culture cells with different MOIs of H. pylori and found in consistent with the data obtained from tissues that after H. pylori infection, miR-101 expressed significantly lower compared with controls (, p < 0.05). We also found that miR-101 was lower in GC cell lines than in immortalized gastric epithelial cell GES-1 (, p < 0.05). These results together showed that miR-101 is dysregulated under H. pylori infection and in tumors.
MiR-101 induced growth inhibition in GC cells
To explore the effect of miR-101 on cell growth, 7901 and MKN45 cells were transiently transfected with miR-101 mimic or miR-101 inhibitor, respectively. As shown in , the miR-101 expression level in cells was significantly changed after mimic or inhibitor transfection. MTT assay displayed that miR-101 inhibited cell growth in 7901 and MKN45 cells, whereas miR-101 inhibitor promoted cell growth in both cells (, p<0.05). By contrast, the miR control or inhibitor control had no effect on cell growth, indicating that the effect caused by miR-101 was highly specific. Apoptosis assay showed that miR-101 expression change had no effect on cell apoptosis (Supplementary Fig. 1).
Figure 2. Enforced expression of miR-101 inhibited cell growth. A, expression of miR-101 after transfecting miR-101 mimics and inhibitor. B, effect of miR-101 on cell proliferation was measured by MTT assay after transfecting in 7901 and MKN45 cells. C, representative histograms for cell-cycle distribution of 7901 cells transfected with miRNAs for 48 hours. D, expression levels of miR-101 after 7901 and MKN45 cells were infected with LV-miR-101 at 5 different MOIs. E, representative pictures of colony formation assay of LV-miR-101-infected 7901 and MKN45 cells. Colonies were evaluated and values were reported as the ratio between LV-miR-101-infected cells and LV-control-infected cells. (*p < 0.05; **p < 0.01 compared with control)
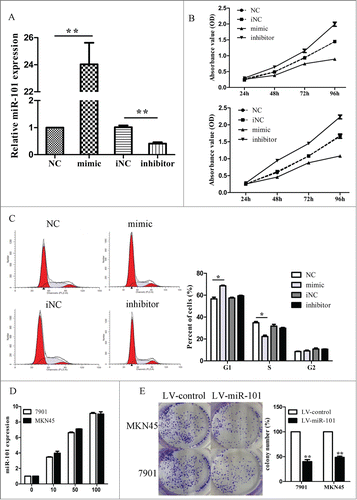
Following observation of miR-101–mediated growth inhibition, we transfected cells with miR-101 mimic or inhibitor and examined cell-cycle distribution. Compared with control, cells transfected with miR-101 displayed an increased percentage of cells in G1 phase and fewer cells in S phase (, Supplementary Table 4, p < 0.05), but the cell-cycle distribution had no significant difference between inhibitor control and miR101 inhibitor transfected cells. These results suggested that the growth-suppressive effect of miR-101 was partly due to a G1-phase arrest.
We next used lentiviral vectors to stably restore the expression of miR-101 in cells and examined cell growth rate and cell-cycle distribution. We showed that the expression levels of miR-101 were increased in a dose-dependent manner and reached a very high level at MOI 100 (, p < 0.01). Therefore, the same condition (MOI = 100) was applied for further experiments. The growth inhibition induced by LV-miR-101 infection was similar to that induced by miR-101 mimic transfection, and a G1-phase arrest was also observed in LV-miR-101 infected cells in a similar way (Supplementary Fig. 2). As demonstrated in colony formation assay, LV-miR-101–infected cells displayed much fewer and smaller colonies compared with LV-con–infected cells (, p < 0.05).
SOCS2 was a direct target of miR-101 in GC cells
To explore the mechanism of growth inhibition induced by miR-101, we investigated whether miR-101 could regulate SOCS2 expression in GC cells. SOCS2 was an oncogene which was reported to be up-regulated in various cancers, however, little is known its role in gastric cancer. We transfected cells with LV-miR-101 at 5 different MOIs of 0, 10, 20, 50, and 100 and then examined SOCS2 expression levels. As shown in , ectopic expression of miR-101 led to a dose-dependent decrease in SOCS2 mRNA and protein levels. At MOI 100, both the mRNA and protein levels of SOCS2 were decreased by approximately 60% to 70%. Moreover, inhibition of endogenous miR-101 by miR-101 inhibitor resulted in upregulated expression of SOCS2 (, p < 0.05).
Figure 3. SOCS2 was a direct target of miR-101 in GC cells. A, expression levels of SOCS2 after LV-miR-101 infection at different MOIs in 7901 and MKN45 cells. B, expression levels of SOCS2 after 7901 cells were transfected with miR-101 inhibitor after 48 hours. C, diagram of SOCS2 3’UTR-containing reporter constructs. D, luciferase reporter assays in 7901 cells, with cotransfection of wt or mt 3’UTR and miRNA as indicated. (*p < 0.05; **p < 0.01 compared with control)
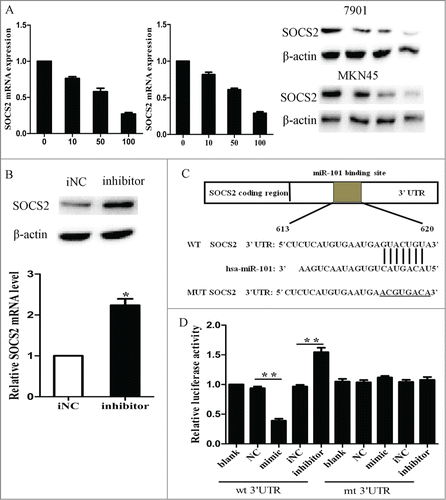
We further performed luciferase reporter assay to determine whether miR-101 could directly target the 3’ UTR of SOCS2 in GC cells. The target sequence of SOCS2 3’ UTR (wt 3’ UTR) or the mutant sequence (mt 3’ UTR) was cloned into a luciferase reporter vector (). Cells were then transfected with wt or mt 3’ UTR vector and miR-101 mimic. The results showed a significant decrease of luciferase activity when compared with miRNA control (, lane 2 and 3; p < 0.01). The activity of mt 3’UTR vector was unaffected by a simultaneous transfection with miR-101 (, lanes 7 and 8). Moreover, co-transfection with miR-101 inhibitor and wt 3’ UTR vector in cells led to a 1.fold5- increase of luciferase activity (, lanes 4 and 5; p < 0.05). Taken together, all these results strongly suggested that SOCS2 was a direct target of miR-101 in GC cells.
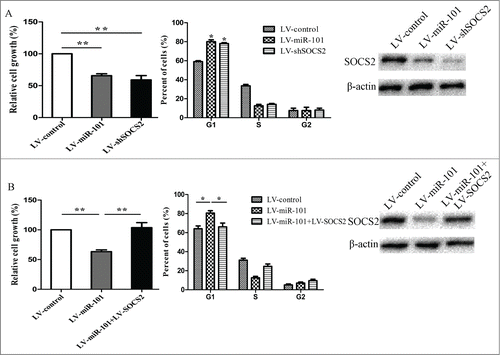
To elucidate whether the growth-suppressive effect of miR-101 was mediated by repression of SOCS2 in GC cells, we performed gain-of-function and loss-of-function studies. Firstly, we silenced SOCS2 by LV-shSOCS2 to investigate whether the reduced expression of SOCS2 could mimic the suppressive effect of miR-101. Cells were infected with LV-shSOCS2 or LV-miR-101 and then we examined cell growth rate and cell cycle distribution. As shown in , SOCS2 knockdown led to significant cell growth inhibition and cell-cycle arrest, similar to those induced by miR-101 (p < 0.05). Subsequently, we evaluated whether ectopic expression of SOCS2 could rescue the suppressive effect of miR-101. Cells were infected with LV-miR-101 for 72 hours and followed by infection with LV-SOCS2, which encoded the full-length coding sequence without the 3’ UTR region. We showed that ectopic expression of SOCS2 significantly rescued miR-101–induced cell growth inhibition and cell-cycle arrest (p < 0.01, ).
Figure 4. SOCS2 was involved in miR-101-induced growth inhibition in 7901 cells. A, 7901 cells were infected with LV-shSOCS2 or LV-miR-101. Cell growth rate and cell-cycle distribution were measured by MTT assay and flow cytometry. B, 7901 cells were infected with LV-miR-101 for 72 hours, followed by infection with LV-SOCS2, and MTT assay and cell-cycle analysis were then performed. (*p < 0.05; **p < 0.01 compared with control)
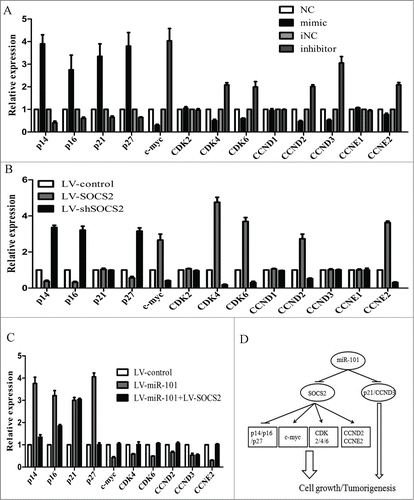
Cell-cycle regulators contributed to the growth inhibition induced by miR-101
Cell-cycle regulators are involved in the regulation of cell cycle and frequently deregulated in cancers. To reveal whether these regulators were involved in the growth inhibition of miR-101, we checked the mRNA and protein levels of 13 cell-cycle regulators in cells by qPCR and western blot including p14, p16, p21, p27, c-myc, cyclin-dependent kinase 2, 4, and 6 (CDK2, CDK4, CDK6), cyclin D1 to D3 (CCND1, CCND2, CCND3), cyclin E1 and E2 (CCNE1, CCNE2). We demonstrated that the mRNA levels of tumor suppressors (p14, p16, p21 and p27) were increased 3 to fold4- after miR-101 overexpression, whereas c-myc, CDK4, CDK6, CCND2, CCND3, CCNE2 were decreased. By contrast, miR-101 inhibitor treatment produced opposite results (). The expression levels of CDK2, CCND1 and CCNE1 were similar among groups. The protein gel blot results showed similar results. However, CDK2 protein expression was significantly decreased after miR-101 over-expression and increased when treated with miR-101 inhibitor. The results were provided as supplementary Figure 3A. To further elucidate whether these genes were directly regulated by miR-101 or indirectly by SOCS2, we examined their mRNA and protein expression levels in LV-SOCS2 or LV-shSOCS2 infected cells. For p14, p16, p27, c-myc, CDK4, CDK6, CCND2 and CCNE2, we found that the effects of SOCS2 up-regulation were consistent with those of miR-101 downregulation, and silence of SOCS2 or ectopic expression of miR-101 yielded similar results (). In addition, we showed that SOCS2 overexpression rescued the expression of those miR-101 effectors (). Interestingly, p21, CCND3 were only regulated by miR-101 but did not respond to SOCS2. Similar results were also found in western blot analysis, with CDK2 up-regulated in LV-SOCS2 transfected cells and decreased in LV-shSOCS2 transfected cells (Supplementary Fig. 3B and C). The results together demonstrated that CDK2 expression may through post-translational mechanism, which could also regulated by either miR-101 or SOCS2. A summary diagram that outlines this regulatory network is shown in .
Figure 5. Cell-cycle regulators contributed to the growth inhibition induced by miR-101. A, deregulated expression of 13 cell-cycle regulators in 7901 cells after miR-101 mimic or inhibitor transfection. B, Their deregulated expression in 7901 cells after LV-SOCS2 or LV-shSOCS2 infection. C, SOCS2 overexpression rescued the deregulated expression of miR-101 effectors in 7901 cells. D, a diagram of miR-101 signaling pathways for cll-cycle control in GC cells.
MiR-101 suppressed tumor growth of GC cells in nude mice
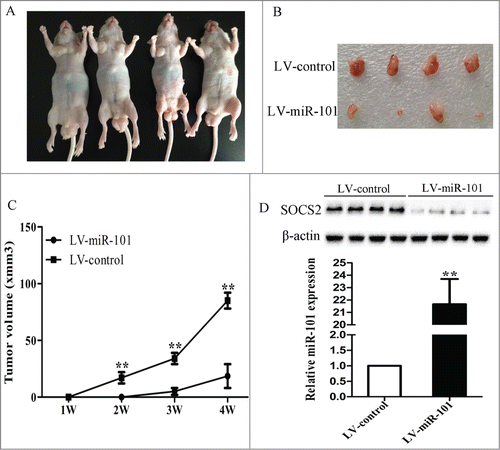
Cells were infected with LV-miR-101 and then were injected subcutaneously into the nude mice. The tumor became palpable between 5 and 7 d after inoculation, and all the mice developed tumors at the end of the experiment (). At 4 weeks after implantation, the average tumor volume of the LV-miR-101 treated group was markedly reduced as compared with control. The average tumor weight was also significantly reduced in the LV-miR-101 treated group ( and C). We also showed that tumors from LV-miR-101 treated group exhibit much higher miR-101 expression and lower SOCS2 protein level ().
Figure 6. MiR-101 suppressed tumor growth of GC cells in nude mice. A, 7901 cells were infected with LV-miR-101 and injected subcutaneously into nude mice. After 4 weeks, LV-miR-101-infected cells (right) produced smaller tumors than control cells (left). B, representative picture of tumors formed. C, growth curve of tumor volumes. D, expression levels of miR-101 and SOCS2 in tumors formed. (**p < 0.01 compared with control)
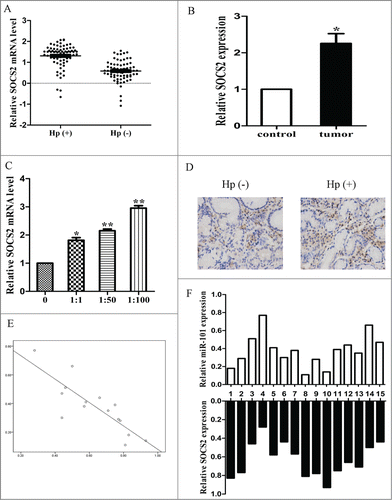
SOCS2 was upregulated in H. pylori positive specimens and inversely correlated with miR-101 levels
We further measured the mRNA levels of SOCS2 in 75 pairs of H. pylori positive and negative tissues. The results showed that the average expression level of SOCS2 was significantly higher in H. pylori positive specimens than in negative tissues (, p < 0.05). We also compared the SOCS2 expression level in tumor tissues and control and found that SOCS2 expression was higher in the tumors (, p < 0.05). We then examined the SOCS2 mRNA level in H. pylori infected cells and found that SOCS2 mRNA level was increased with H. pylori infection (, p < 0.05). The results from immunohistochemistry also suggested that SOCS2 protein level was higher in H. pylori infected tissues (). We correlated SOCS2 with miR-101 expression in the same positive specimens. As shown in and F, when SOCS2 mRNA levels were plotted against miR-101 expression, a significant inverse correlation was observed (2-tailed Spearman's correlation, r = −0.831, p = 0.000).
Figure 7. The expression of SOCS2 was upregulated in cell lines and clinical specimen. A, expression of SOCS2 in H. pylori positive and negative tissues. B, expression of SOCS2 in tumor tissues and normal tissues. C, expression of SOCS2 in different MOI of H. pylori infected tissues. D, The immunohistochemistry of SOCS2 in H. pylori positive and negative tissues. E, a statistically significant inverse correlation between miR-101 and SOCS2 levels in clinical specimen (Spearman's correlation analysis, r = −0.831, p=0.000) (*p < 0.05; **p < 0.01 compared with control).
Discussion
Gastric cancer is a worldwide disease with a high incidence, especially in Southeast Asia. The 5-year survival rate for gastric cancer is quite low.Citation8 Some of the gastric cancer patients were H. pylori related. Therefore, it is necessary to thoroughly investigate the pathogenesis and develop new targeted treatments for H. pylori related gastric cancer. Accumulating evidence has indicated that aberrant expression of miRNAs may be a common mechanism involved in the development of various cancers.Citation9 Investigation of cancer-specific miRNAs and their targets is necessary for further elucidation of their role in the pathogenesis of tumors, and may be important for the design of novel therapeutic targets.Citation10
Down-regulation of miR-101 has been previously reported in various types of human cancers, including gastric cancer,Citation11 breast cancer,Citation12 and ovarian carcinoma,Citation13 indicating that miR-101 potentially plays an important role during the development of cancer. Indeed, it has been reported that miR-101 acts as an EMT suppressor in ovarian carcinoma and suppress proliferation and invasion of the cancer cells.Citation13 Furthermore, miR-101 has also been reported to sensitize the A549 NSCLC cell line to CDDP via the activation of caspase 3-dependent apoptosis, which promote cancer cells death.Citation14 However, this was the first study to explore the underlying mechanism of H. pylori related gastric cancer. H. pylori infection might alter miRNAs expression through epigenetic regulations such as DNA methylation and histone modification. Further investigations are needed to figure out how H. pylori infection changed miR-101 expression. In this study, we detected miR-101 expression in tissues and cells with or without H. pylori infection by qRT-PCR. We found that miR-101 was downregulated in H. pylori related GC. To reveal the role of miR-101 in GC cells, we tested the effect of miR-101 on cell growth. Our results showed that miR-101 could inhibit cell growth and colony formation, induce a G1arrest in GC cells (), and suppress tumorigenesis in a murine model of GC xenograft (), suggesting its potential tumor suppressor role in GC. The data were similar to the findings in liver cancer and breast cancer, in which miR-101 was down-regulated, and ectopic expression of miR-101 suppressed cell proliferation and induced a G1-phase arrest.
SOCS2 belongs to the family of suppressor of cytokine signaling proteins and plays a master regulatory role in many important cellular processes.Citation15 Mounting evidence has shown that SOCS2 is overexpressed in multiple cancers and can enhance cell proliferation and neoplastic transformation.Citation16,17 However, the status and function of SOCS2 have never been documented in GC. Previous studies had demonstrated that H. pylori infection could lead to the activation of SOCS protein expression.Citation18 In our studies, we demonstrated that miR-101 inhibited SOCS2 expression in a dose-dependent manner, and confirmed that SOCS2 was a direct target of miR-101 in GC cells. To further reveal the functions of SOCS2 in GC, we found that knockdown of SOCS2 induced cell growth inhibition and a G1-phase arrest similar to the phenotypes induced by miR-101 restoration, and SOCS2 over-expression could rescue the growth suppressive effect of miR-101 (). These results suggested that the growth inhibitory effect of miR-101 was partly mediated by repressing SOCS2 expression.
It is well known that an average miRNA has approximately 100 target sites and regulates a large fraction of protein coding genes, which form a regulatory network.Citation19 To further explore the molecular mechanisms of growth inhibition induced by miR-101, we examined the expression of a panel of cell-cycle regulators upon miR-101 overexpression or SOCS2 downregulation. Our results showed that a group of cell cycle regulators were dysregulated, suggesting that miR-101 repressed SOCS2 expression, which, in turn, by mediating G1-S checkpoint regulators, inhibited the growth and tumorigenicity of GC cells. However, our results also showed that CDK2, CCND1 and CCNE1 were not the targets of either miR-101 or SOCS2. Interestingly, we also found that independent of SOCS2, p21, CCND3 were directly regulated by miR-101, indicating that it was a direct target of miR-101 in GC cells.
In addition to the oncogenic effects of SOCS2 in GC cells, we showed that SOCS2 was up-regulated in H. pylori infected tissues and cells, and SOCS2 expression level was higher in tumor tissues than control, which linked H. pylori infection and gastric cancer together. We also showed that SOCS2 was inversely correlated with miR-101 levels in H. pylori tissues. We suggested that the over-expression of SOCS2 in GC held significant promise for the advancement of cancer therapy, either in terms of improving diagnosis or predicting prognosis. Although this claim awaited further validation on larger sizes of samples, SOCS2-dysregulated levels might prove valuable as prognostic markers, especially as SOCS2 overexpression seemed to be strongly associated with the poor prognosis in both prostate and liver cancer.
Taken together, this study identified miR-101 as a growth suppressive miRNA in human H. pylori related GC, at least, partly through repression of SOCS2. Our data provide further evidence of a pivotal role of miRNAs in GC tumorigenesis. As miR-101 is downregulated in GC, reintroduction of this mature miRNA into the tumor tissue could provide a therapeutic strategy by reducing the expression of target genes. Although miRNA-based therapeutics are still in their infancy, our findings on miR-101 are encouraging and suggest that this miRNA could be a potential target for the treatment of H. pylori related gastric cancer in future.
Materials & Methods
Cell culture and miRNA transfection
An immortalized human gastric epithelial cell line GES-1 was cultured in RPMI 1640 (Gibco) medium supplemented with 15% fetal bovine serum (FBS), as described previously. The human GC cell lines MKN45 and 7901 were cultured in RPMI-1640 (Hyclone). The miR-101 mimic, a nonspecific miRNA control, miR-101 inhibitor, and a nonspecific antimiR control were all purchased from Genepharma (Shanghai, China). MiRNAs were transfected at a working concentration of 100 nmol/L using Lipofectamine 2000 reagent (Invitrogen).
Clinical specimens
Primary GC specimens and normal gastric specimens from gastroscope were obtained from Jiangsu Province Hospital (Nanjing Medical University, Nanjing, China). Both tumor and normal tissues were histologically confirmed by H&E (hematoxylin and eosin) staining. H. pylori infection was confirmed by rapid urease teat or histology. Informed consent was obtained from each patient, and the research protocols were approved by the Ethics Committee of Jiangsu Province Hospital.
Vector construction and lentivirus production
The DNA fragments corresponding to miR-101, SOCS2 and sh-SOCS2 were amplified from human genomic DNA and were listed in supplementary Table 1. Then, they were cloned into pLVTHM lentiviral vector. Virus packaging was performed in HEK293T cells using lipofectamine 2000. The 7901 cells were transduced with pLV-miR-101 or pLV-SOCS2 or pLV-shSOCS2. Forty-8 hours after infection, 2 mg/ml of puromycin was added to the media for 2 weeks to select the cells infected with the lentivirus. The empty lentiviral vector LV-control was used as a control.
MTT assay and cell-cycle analysis
Cells were plated in 96-well plates at 2×10³ per well in a final volume of 100 μL and transfected with miRNAs. After transfection, the cells were cultured for 24, 48, 72, and 96 hours. The effect of miR-101 on cell growth and viability was determined by MTT assay as described previously. For cell-cycle analysis, cells were plated in 6-well plates at 2×10⁵ per well and transfected with miRNAs. At 48 hours post-transfection, the cell-cycle distribution was analyzed by propidium iodide (PI) staining and flow cytometry as described.
RNA isolation, reverse transcription, and quantitative real-time PCR (qRT-PCR)
Total RNA was extracted using Trizol reagent (Tarkara, Japan). To quantitate miR-101 expression, total RNA was polyadenylated and reversely transcribed using miRNA FirstStrand cDNA Synthesis kit (Riobio). To measure the mRNA levels of SOCS2 and cell-cycle regulators, total RNA was reversely transcribed using Reverse Transcription System (Tarkara). Quantitative real-time PCR (qPCR) was performed using SYBR Green PCR master mix (Applied Biosystems) on an ABI Step-one System. The primers were listed in Supplementary Table S1. GAPDH or U6 was used as an endogenous control. All samples were normalized to internal controls and fold changes were calculated through relative quantification.
Western blot analysis
Protein lysates were separated by 10% SDS-PAGE, and electrophoretically transferred to PVDF (polyvinylidene difluoride) membrane (Millipore). Then, the membrane was incubated with rabbit monoclonal antibody against human SOCS2 (Cell Signaling Technology, CST, diluted 1:1000), p14 (CST, diluted 1:1000), p16 (CST, diluted 1:1000), p21 (CST, diluted 1:1000), p27 (CST, diluted 1:1000), c-myc (abcam, diluted 1:500), CDK2 (CST, diluted 1:1000), CDK4 (CST, diluted 1:1000), CDK6 (CST, diluted 1:1000), CCND1 (CST, diluted 1:1000), CCND2 (CST, diluted 1:1000), CCND3 (CST, diluted 1:1000), CCNE1 (CST, diluted 1:1000) and CCNE2 (CST, diluted 1:1000) followed by HRP (horseradish peroxidase)-labeled goat-antimouse IgG (Santa Cruz Biotechnology) and detected by chemiluminescence. β-actin was used as a protein loading control. The intensity of protein fragments was quantified with Image lab software.
MiRNA target validation
SOCS2 was identified as miR-101 target in Targetscan. 3’ UTR (untranslated regions) was amplified by PCR and cloned downstream of the firefly luciferase gene in pGL3 vector (Promega). The vector was named wild-type (wt) 3’UTR. Site-directed mutagenesis of the miR-101 binding site in SOCS2 3’ UTR was generated by Invitrogen and named mutant (mt) 3’ UTR. For reporter assays, wt or mt 3’ UTR vector and the control vector pRL-CMV (Renilla luciferase, Promega) were cotransfected. Luciferase activity was measured 36 hours after transfection using the Dual-Luciferase Reporter Assay System (Promega).
Tumor growth assay in vivo
Male BALB/c nude mice aged 4 to 6 weeks were purchased from Nanjing medical university. For tumor growth assay, 7901 cells were infected with LV-miR101 [MOI (multiplicity of infection) = 100] and a total of 5×10⁵ infected cells were injected subcutaneously into the nude mice. Tumor size was measured every week. Mice were sacrificed and tumors were dissected after a month. Protein and RNA were extracted from the tumors and detect the miR-101 and SOCS2 expression.
Immunohistochemistry
Formalin-fixed, paraffin-embedded gastric tissues were sectioned at 4-mm thickness and analyzed for SOCS2 (CST, 1:1,000 dilution) expression. Photographs were taken by microsope (Nikon, ECLIPSE 50i). The number of positive staining cells showing immunoreactivity of SOCS2 in 10 representative microscopic fields was counted, and the percentage of positive cells was also calculated. The percentage scoring of immunoreactive tumor cells was described as follows: 0 (0 %), 1 (1–10 %), 2 (11–50 %), and 3 (>50%). The intensity was scored as follows: 0 (negative), 1 (weak), 2 (moderate), and 3 (strong). The expression level of SOCS2 was measured by multiplying the percentage and the intensity score. High expression samples means tumors with a multiplied score exceeding 4 while the others were considered to be low expression.
Statistical analysis
SPSS 13.0 software was used for statistical analysis. Data were presented as mean±SEM of at least 3 independent experiments. Two-tailed Student's t test was used for comparisons of 2 independent groups. The relationship between SOCS2 and miR-101 expression was explored by Spearman's correlation. P values of < 0.05 were considered statistically significant.
Disclosure of Potential Conflicts of Interest
No potential conflicts of interest were disclosed.
987523_Supplementary_Materials.zip
Download Zip (4.4 MB)Funding
This work was supported by National Natural Science Foundation of China (No. 81270476), the Priority Academic Program Development of Jiangsu Higher Education Institutions (JX10231801) and Jiangsu postgraduate scientific research and innovation projects (CXZZ13_0574).
Supplemental Material
Supplemental data for this article can be accessed on the publisher's website.
References
- Siegel R, Naishadham D, Jemal A. Cancer statistics, 2013. CA Cancer J Clin 2013; 63(1):11-30; PMID:23335087; http://dx.doi.org/10.3322/caac.21166
- Graham DY. History of Helicobacter pylori, duodenal ulcer, gastric ulcer and gastric cancer. World J Gastroenterol 2014; 20(18):5191-5204
- Lordick F, Allum W, Carneiro F, Mitry E, Tabernero J, Tan P, Van Cutsem E, van de Velde C, Cervantes A. Unmet needs and challenges in gastric cancer: The way forward. Cancer Treat Rev 2014; 40(6):692-700; PMID:24656602; http://dx.doi.org/10.1016/j.ctrv.2014.03.002
- Mendell JT, Olson EN. MicroRNAs in stress signaling and human disease. Cell 2012; 148(6):1172-87; PMID:22424228; http://dx.doi.org/10.1016/j.cell.2012.02.005
- Motoyama K, Inoue H, Nakamura Y, Uetake H, Sugihara K, Mori M. Clinical significance of high mobility group A2 in human gastric cancer and its relationship to let-7 microRNA family. Clin Cancer Res 2008; 14(8):2334-40; PMID:18413822; http://dx.doi.org/10.1158/1078-0432.CCR-07-4667
- Zhou X, Xia Y, Su J, Zhang G. Down-regulation of miR-141 induced by helicobacter pylori promotes the invasion of gastric cancer by targeting STAT4. Cell Physiol Biochem 2014; 33(4):1003-12; PMID:24732377; http://dx.doi.org/10.1159/000358671
- Matsushima K, Isomoto H, Inoue N, Nakayama T, Hayashi T, Nakayama M, Nakao K, Hirayama T, Kohno S. MicroRNA signatures in Helicobacter pylori-infected gastric mucosa. Int J Cancer 2011; 128(2):361-70; PMID:20333682; http://dx.doi.org/10.1002/ijc.25348
- Huang ZB, Zhou X, Xu J, Du YP, Zhu W, Wang J, Shu YQ, Liu P. Prognostic value of preoperative serum tumor markers in gastric cancer. World J Clin Oncol 2014; 5(2):170-6; PMID:24829865; http://dx.doi.org/10.5306/wjco.v5.i2.170
- González CA, Sala N, Rokkas T. Gastric cancer: epidemiologic aspects. Helicobacter 2013; 18 Suppl 1:34-8; PMID:24011243; http://dx.doi.org/10.1111/hel.12082
- Song JH, Meltzer SJ. MicroRNAs in pathogenesis, diagnosis, and treatment of gastroesophageal cancers. Gastroenterology 2012; 143(1):35-47; PMID:22580099; http://dx.doi.org/10.1053/j.gastro.2012.05.003
- Wang HJ, Ruan HJ, He XJ, Ma YY, Jiang XT, Xia YJ, Ye ZY, Tao HQ. MicroRNA-101 is down-regulated in gastric cancer and involved in cell migration and invasion. Eur J Cancer 2010; 46(12):2295-303; PMID:20712078; http://dx.doi.org/10.1016/j.ejca.2010.05.012
- Wang R, Wang HB, Hao CJ, Cui Y, Han XC, Hu Y, Li FF, Xia HF, Ma X. MiR-101 is involved in human breast carcinogenesis by targeting Stathmin1. PLoS One 2012; 7(10):e46173; PMID:23071542; http://dx.doi.org/10.1371/journal.pone.0046173
- Guo F, Cogdell D, Hu L, Yang D, Sood AK, Xue F, Zhang W. MiR-101 suppresses the epithelial-to-mesenchymal transition by targeting ZEB1 and ZEB2 in ovarian carcinoma. Oncol Rep 2014; 31(5):2021-8; PMID:24677166
- Yin J, Wang M, Jin C, Qi Q. miR-101 sensitizes A549 NSCLC cell line to CDDP by activating caspase 3-dependent apoptosis. Oncol Lett 2014; 7(2):461-465; PMID:24396470
- Rico-Bautista E, Flores-Morales A, Fernández-Pérez L. Suppressor of cytokine signaling (SOCS) 2, a protein with multiple functions. Cytokine Growth Factor Rev 2006; 17(6):431-9; PMID:17070092; http://dx.doi.org/10.1016/j.cytogfr.2006.09.008
- Hoefer J, Kern J, Ofer P, Eder IE, Schäfer G, Dietrich D, Kristiansen G, Geley S, Rainer J, Gunsilius E, Klocker H, Culig Z, Puhr M. SOCS2 correlates with malignancy and exerts growth-promoting effects in prostate cancer. Endocr Relat Cancer 2014; 21(2):175-87; PMID:24280133; http://dx.doi.org/10.1530/ERC-13-0446
- Nagpal N, Ahmad HM, Molparia B, Kulshreshtha R. MicroRNA-191, an estrogen-responsive microRNA, functions as an oncogenic regulator in human breast cancer. Carcinogenesis 2013; 34(8):1889-99; PMID:23542418; http://dx.doi.org/10.1093/carcin/bgt107
- Cha B, Kim KH, Matsui H, Kim H. Expression of suppressors of cytokine signaling-3 in Helicobacter pylori-infected rat gastric mucosal RGM-1cells. Ann NY Acad Sci 2007; 1096:24-8; PMID:17405912; http://dx.doi.org/10.1196/annals.1397.066
- Yousef M, Trinh HV, Allmer J. Intersection of MicroRNA and gene regulatory networks and their implication in cancer. Curr Pharm Biotechnol 2014; 15:445-54; PMID:24846065