
Abstract
A-to-I RNA editing by adenosine deaminases acting on RNA is a post-transcriptional modification that is crucial for normal life and development in vertebrates. RNA editing has been shown to be very abundant in the human transcriptome, specifically at the primate-specific Alu elements. The functional role of this wide-spread effect is still not clear; it is believed that editing of transcripts is a mechanism for their down-regulation via processes such as nuclear retention or RNA degradation. Here we combine 2 neural gene expression datasets with genome-level editing information to examine the relation between the expression of ADAR genes with the expression of their target genes. Specifically, we computed the spatial correlation across structures of post-mortem human brains between ADAR and a large set of targets that were found to be edited in their Alu repeats. Surprisingly, we found that a large fraction of the edited genes are positively correlated with ADAR, opposing the assumption that editing would reduce expression. When considering the correlations between ADAR and its targets over development, 2 gene subsets emerge, positively correlated and negatively correlated with ADAR expression. Specifically, in embryonic time points, ADAR is positively correlated with many genes related to RNA processing and regulation of gene expression. These findings imply that the suggested mechanism of regulation of expression by editing is probably not a global one; ADAR expression does not have a genome wide effect reducing the expression of editing targets. It is possible, however, that RNA editing by ADAR in non-coding regions of the gene might be a part of a more complex expression regulation mechanism.
Introduction
Adenosine-to-inosine (A-to-I) RNA editing by adenosine deaminases acting on RNA (ADARs) proteins is a post-transcriptional modification pre-mRNA that is essential for normal life and development in vertebrates.Citation1-Citation3 Editing changes the sequences of encoded RNA, thus contributing to proteomic and phenotypic diversity. To this day, thousands of human genes have been shown to be subject to A-to-I RNA editing within their untranslated regions and introns.Citation4-Citation10 In primates, these editing events take place mainly within Alu repeats,Citation11-Citation14 which are primate-specific, 300 bp-long elements that comprise about 10% of the human genome. Importantly, editing has been shown to operate in genes encoding synaptic proteins or important neuromodulators, suggesting that editing may have an important role in tuning molecular functions in the brain regions.Citation15,16 Indeed, known phenotypic effects of editing from Caenorhabditis elegance and Drosophila melanogaster to Mus musculus are related to neural systems and behavior.Citation17-Citation19 In addition, editing was found to be dysregulated in several diseases, mainly related to the neural system.Citation20-Citation22
Table 1. Number of target genes and background genes used in the analyses.
The impact of RNA editing on coding sequences can be understood by considering the fact that the translation machinery identifies inosine (I) as guanosine (G), thus editing can lead to protein diversification. However, the impact of editing on non-coding regions of a gene is not understood as well, despite the abundance of editing in non-coding regions: most human genes have been shown to undergo editing in these regions.Citation4,23 Various functions have been proposed to explain the abundance of editing in non-coding regions.Citation1 It has been proposed that 3' UTR editing may play a role in gene silencingCitation1; in augmenting or counteracting the RNAi mechanism,Citation1 and as an anti-retroelement mechanism.Citation24 It has also been suggested that heavily-edited mRNA transcripts are retained in the nucleus,Citation25-Citation29 or induce inosine specific degradation of the edited transcripts by Tudor-SN nuclease.Citation28,30 Moreover, hyper edited transcripts were even shown to down-regulate gene expression in trans.Citation31 Another way in which editing might regulate gene expression in human is through modification of micro-RNA (miRNA) targets within 3′ Alu elementsCitation32 and changing the splicing enhancers/silencers recognition sites.Citation33 A common effect of all these proposed mechanisms is that editing of a target gene is expected to reduce its expression. A direct prediction stemming from this hypothesis is that expression of edited genes will be negatively correlated across conditions with the expression of ADARs.
The above experimental findings seem to conflict with the abundance of editing targets in the human genome in terms of the possible effects of RNA editing on expression. On one hand, as pointed above, editing was demonstrated to dramatically impact some edited transcripts.Citation26 On the other hand, if editing determines the fate of mRNA it would have an overly massive effect on human transcriptome. This is because a large fraction of human transcripts contain double-strand RNAs structures formed by Alus,Citation4,11-14 ideal ADAR targets, and therefore, editing would impact a large fraction of human genes. Moreover, since the rapid invasion of Alus into the genome is mostly specific to primates, evolution only has a short period to adapt to this recent dramatic increase of edited targets.
To address these 2 possible conflicting views, the current work aims to chart co-expression patterns of ADARs and their potential Alu editing targets in the human brain, using 2 large sets of mRNA expression from postmortem brains. Surprisingly, when considering the correlation structure of ADAR and its targets along development, we do not find evidence supporting the expected global negative correlation, since the distribution of correlations is often bi-modal: ADAR is positively correlated with most of its targets, and negatively correlated with other target genes. Our results suggest that in the course of primate evolution, with the massive editing associated with Alu, editing-related mechanisms for gene regulation were probably adjusted in such a way that their negative regulation of edited gene has changed. Importantly, our results imply that the suggested mechanism of negative regulation of expression by RNA editing is not global, namely, its effect on a target gene may vary substantially.
Results
To characterize the spatial expression of ADAR (ADAR1) and ADARB1 (ADAR2) in the brain and how their expression correlates with their potential editing targets, we analyzed genome-wide expression measurements from 2 sources: A data set containing 3702 samples from 6 adult human brains,Citation34 and a dataset measured from 57 brains over developmentCitation35 (see Methods for details on both data sets). In the results below, we refer to them as ABA-2013 and Kang-2011, respectively.
ADAR expression in the human brain
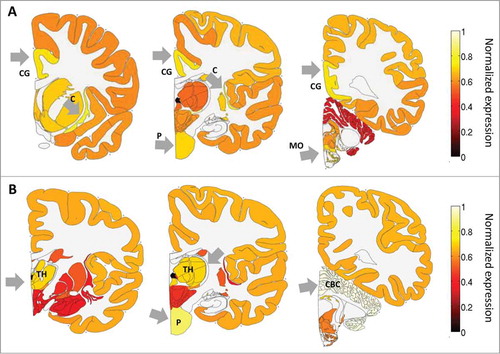
As a first step to characterize the expression of ADAR and ADARB1 in the human brain, we studied their pattern of expression across the major brain regions. shows the average expression over the 6 adult brains in 3 consecutive coronal slices. Expression levels were calculated here by first summing expression over smaller regions, and then dividing by the maximum expression over regions. This was done to allow easier visualization of the expression levels in the different brain regions. ADAR expression is enriched mostly in sub-cortical regions, the claustrum, pons and medulla oblongata, but also the cingulate gyrus. This expression pattern is consistent with previous reports that editing targets HTR2C, the gene that codes for a serotonin receptor that is expressed in sub-cortical regions, but not HTR2A which codes for a receptor in the same family which is expressed in the cortex. ADARB1 expression is enriched particularly in highly functional regions such as the cerebellar cortex, pons and thalamus. Over-expression of both ADARs in the pons is consistent with a previous finding of high editing levels in this region in the rat brain.Citation36 Interestingly, the expression levels of ADAR were in general not exceptionally high in the neocortex, the brain area that is dramatically oversized in primates and humans specifically.
Figure 1. ADAR and ADARB1 expression in the human brain based on the ABA-2013 data set. Heat map of normalized mRNA expression in 3 coronal slices of a human brain. Expression levels were calculated here by first summing expression over smaller regions, and then dividing by the maximum expression over regions, and averaged over 6 adult brains. This was done to allow easier visualization of the expression levels in the different brain regions. (A) ADAR expression is enriched in the cingulate gyrus - CG, the pons - P, the claustrum - C and the medulla oblongata - MO. (B) ADARB1 expression is enriched in the thalamus - TH), the pons - P and the cerebellar cortex - CBC. Figures were created using the brain-expression-visualizer tool available from www.chechiklab.biu.ac.il.
Correlation structure between ADAR and putative Alu editing targets
As discussed above, RNA editing of Alu repeats has been suggested as a possible regulatory mechanism, where switching of Adenosine to Inosine marks mRNA for degradation or nuclear retention.Citation25-Citation27 To examine the hypothesis that RNA editing serves as a mechanism for downregulation of gene expression, we calculated the spatial correlation between ADARs and 7,864 potential editing targets (see Methods for details on how target and background sets were defined) across brain regions in the ABA-2013 dataset, and 6,834 potential editing targets in the Kang-2011 data set. If ADARs edit their targets on a wide scale, and if RNA editing by ADARs down-regulates their targets, regions with high levels of ADAR and ADARB1 mRNA would show lower levels of their non-edited targets on average. As a consequence, we would expect to see negative correlations between ADARs and their potential editing targets.
We used the Illumina Human Body Map (HBM) RNA-Seq data from a brain sample to identify genes with edited Alu elements, focusing on edited Alu repeats that reside within genes. We defined a gene as a target if it contains at least one edited AluCitation4,Citation11-Citation14
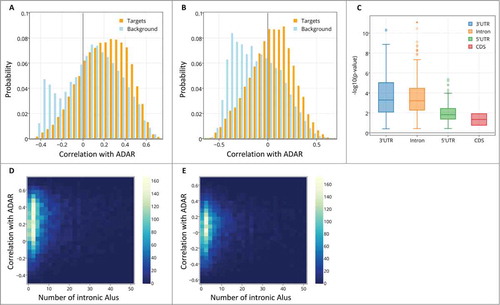
We computed the spatial correlation of ADAR and ADARB1 with their potential editing targets, across all samples in our 2 datasets. As a baseline for comparison, we also computed the same correlations but this time with the spatial expression profile of all genes in a background set of 10,731 genes (see Methods for details on how target and background sets were defined). shows the histograms of correlations between ADAR and the target set (red) and ADAR and the background set (blue). Surprisingly, the effect observed is opposite than what is predicted by the initial hypothesis. The correlation of ADAR mRNA levels with the expression of its potential targets is actually more positive than correlations of ADAR mRNA levels with the background set expression (median Pearson correlation with targets = 0.224, median Pearson correlation with background =0.104, Wilcoxon test for different medians z-value = 31.9, P-value <8.73*10−223, n=20,772, ). This effect was consistent when we computed non-linear spatial correlation (median Spearman correlation with targets =0.219, median Spearman correlation with background = 0.099, Wilcoxon test for different medians, z-value = 31.3, P-value <9.92*10−215, n = 20,772). There was no significant effect found for the other editing enzyme, ADARB1 and this result is consistent with the fact that ADAR is considered to be the main gene responsible for Alu editing.Citation5,37,38
Figure 2. The distribution of spatial correlation values between ADAR and targets (orange) and between ADAR and a background set (light blue). The results are shown for (A) ABA-2013 dataset (B) Kang-2011 data set. The two distributions differ due to 2 groups of genes: a larger number of target genes have positive correlations with ADAR, and there also exist a group of genes that do not contain Alus, thus are not targeted by ADAR, but are strongly negatively correlated with ADAR. (C) Boxplot of the log-transformed p-values of a one-sided Wilcoxon test between ADAR correlations with targets vs. a background set of genes is plotted against the location of the Alu repeat pairs in the gene (note that Alu in the CDS or 5’ UTR is rare). P-values for the 2 datasets are pooled and shown together. Error bars encompass data within 1.5 times the inter-quartile range, and the boxes show the lower and upper quartiles together with the median. Outliers are represented as circles. Lack of differences in correlation between editing at the 3’ UTR and introns argues against global gene regulation by editing at the 3’ UTR. (D,E) 2D histograms of the correlation of genes with ADAR vs. the number of Alu repeats the genes contain. Positive correlation with ADAR increases with number of Alus. Points with more than 50 Alu repeats were ignored for easier visualization. The results are shown for (D) ABA-2013 data set (E) Kang-2011 dataset.
To further validate the high spatial correlation between ADAR and its targets, we computed the distribution of spatial correlations in the second data set, Kang-2011, which measured spatio-temporal expression profiles throughout the human brain and in different ages.Citation35 Results in this second dataset were highly consistent with the first data set: The correlation between ADAR and the set of edited targets, computed using all the samples regardless of age, was significantly positive (median Pearson correlation with targets = 0.063, median Pearson correlation with background =−0.121, Wilcoxon test for different medians z-value = 41.2,P-value < 10−223,n=17,564. Median Spearman correlation with targets = 0.0567, median Spearman correlation with background = -0.135, Wilcoxon test for different medians z-value = 41.7, P-value < 10−250,n=17564, ). The results were also largely consistent at the gene-to-gene level: the set of correlations with ADAR, as computed for each gene, was in itself strongly correlated (Spearman rho = 0.44, P-value<10−16), even though the 2 datasets used were measured in different subsets of brain regions.
Since ADARB2 (ADAR3) is thought to have a regulatory interaction with ADAR and/or ADARB1Citation39 we studied the correlation in the expression of the pair ADAR and ADARB2 and of the pair ADARB1 and ADARB2. No consistent and significant correlation was found in either of the 2 data sets we tested. More refined data may be needed to tease out the regulatory inter-relations of the 3 ADARs.
shows the distribution of ADAR correlations with the target set and the background set. The difference in the correlations that ADAR has with its targets versus the background set stems from 2 sources: a subset of target genes that have strong positive correlations with ADAR, and also a group of genes that are not edited but are strongly negatively correlated with ADAR. This “spike” in negative correlations is very prominent and appears in both datasets. To characterize the highly negatively correlated genes, we performed a Gene Ontology (GO) enrichment analysis using GOrilla.Citation40 In ABA-2013 and also in Kang-2011, we found that the lists of genes that are negatively correlated with ADAR are highly enriched for olfactory receptor activity (P < 10−50 for both data sets).
Editing levels may change across tissues or conditions. To test if the effects described above are sensitive to the specific tissues selected, we repeated the analysis but this time selecting a target set based on genes with edited Alus in each of the 16 available tissues in the HBM dataset. The 16 groups of targets are highly overlapping (mean percentage of overlap = 61.15%, STD = 9.32%). We tested ADAR correlations with the different target gene groups and found that they are consistently and significantly more positive than with the complementary background set of genes, and the effect was highly stable across tissues (mean difference of medians = 0.043, STD = 0.017, Figure S1).
Double stranded Alu structures appear in various locations in genes. To test if the strong positive correlation of ADAR with its putative targets depends on the location of the target in the gene, we repeated the analysis, but this time separating the targets ABA-2013 into 4 groups of genes based on the location of the Alu repeat: 3'UTR (1,024/878genes), 5'UTR (92/55 genes), intronic regions (7,494/6,525genes) and coding sequences (CDS, 38/37genes). We accounted for the different sizes of the groups using bootstrap (see Methods). The spatial-correlation effect was significant in intronic Alus and in 3'UTR Alus (). Lack of differences in correlation between editing at the 3’ UTR and introns argues against global gene regulation by editing at the 3’ UTR. The distribution of correlation values of ADAR with each of the target groups and the background set is shown in Figure S2.
The difference in ADAR correlations with targets and background genes may not be specific to ADAR. For instance, if a large group of target genes is highly positively inter-correlated, then many genes, not only ADAR, would show a strong correlation with that group and as a result, significantly stronger correlation than with the background set. To test if the difference in correlations is specific to ADAR, we repeated the above analysis for all genes: for each gene, we calculated the Spearman correlation between the gene's spatial expression pattern and the expression of the genes from the intronic target and background sets. We ranked all genes based on the magnitude of their correlation, measured as -log10(Wilcoxon's test p-value). ADAR is ranked at 6 out of 20,773 genes in the ABA data set and ranked 22 out of 17565 genes in the Kang-2011 dataset. In the intersection of the 2 sets, ADAR is one out of only 10 genes that are in the top 1% of both 2 sets (10 out of 17565, top 0.1 percentile). This means that the high positive correlations of target genes with ADAR are not a common phenomenon in the genome, and this result is significantly specific to ADAR. The other 9 genes include DDX1, a putative RNA helicase which is implicated in several processes involving alteration of RNA secondary structureCitation41 and the interferon receptor IFNAR1. Another gene that shows high correlation with editing targets in both sets is NF2, which has been suggested to be involved in neural cell development.Citation42 Brain development has been suggested to be controlled in part by RNA editing.Citation43
Genes contain variable amounts of Alu repeats. If the positive spatial correlation of ADAR with its targets is functionally meaningful, we would expect to see higher correlations of ADAR with genes that contain more Alus. plots the correlations of intronic target genes with ADAR against the number of Alus in the same genes. There is a significant positive correlation between the number of Alus that a gene contains and its correlation with ADAR, in both data sets (Spearman correlation coefficient ρ = 0.084, p-value = 4*10−13 for ABA-2013 dataset, ρ = 0.11, p-value = 4.4*10−19 for the Kang-2011 data set). Genes that contain more Alu repeats tend to be longer, therefore the relation between spatial correlation with ADAR and the number of Alus could be a side-effect of the increased gene length. To test this, we assembled 2 sets of length-matched genes, one from the target set and another from the background set (see Methods), and computed their correlations with ADAR. The correlations of ADAR with the target set were strongly positive, as opposed to the correlations with the background set, for both ABA-2013 (median Pearson correlation with targets = 0.241, median Pearson correlation with background =0.104, Wilcoxon test for different medians z-value = 25.1,P-value < 7.27*10−139,n = 10054) and Kang-2011 (median Pearson correlation with targets = 0.065, median Pearson correlation with background =-0.102, Wilcoxon test for different medians z-value = 27.5,P-value < 9.62*10−167,n = 8968). We conclude that the higher positive correlations of ADAR with its targets are not simply due to of the effect of gene lengths.
Correlation structures of known brain transcription factors and their targets
In the above analysis, the ADAR expression data and the editing data were computed from different data sets. To further test the validity of the results with a “sanity test," we studied the correlation patterns of known transcription factors (TFs) and their corresponding targets in the brain. We focused on the transcription factors EP300, PAX5 and TCF12 (see Methods). We checked the correlation of each TF with its putative targets vs. a background set which contains all other genes (Supplementary Figure S3).
In the ABA-2013 dataset, the correlations of all TFs and their putative targets are significantly more positive than the correlations with the background set (n = 20772, EP300, Wilcoxon p-value = 7.7*10−15; PAX5, Wilcoxon p-value = 1.1*10−05; TCF12, Wilcoxon p-value =1.9*10−4). In the Kang-2011 data set, which has a smaller number of brain regions, we still see a significant difference between EP300 and TCF12 target and background set correlations (n = 17564, EP300, Wilcoxon p-value = 1.4*10−3, Figure R2D; TCF12, Wilcoxon P-value = 6*10−4, Figure S3F). For PAX5, the distributions of correlations (Figure S3E) is largely non-Gaussian (low kurtosis), and it is likely that the strong variability in this distribution washes out the difference in the medians of the 2 groups with this sample size.
Validation using the HBM data
ADAR1 expression does not correlate strictly with editing levels when restricting correlations to a specific site.Citation46-Citation49 However, the correlation between the global level of editing and ADAR1 expression level has been found significant in several studies, For instance, it has been recently shown that reducing ADAR1 expression levelsleads to reduction of global editing.Citation37 It has also been shown that up-regulation of ADAR1 in ESCC tumors contributes to gene-specific hyper-editing patterns.Citation50
To quantify if ADAR expression and overall editing levels are correlated in our data, we calculated both the editing levels and the expression levels for all of the genes from RNA-seq data from the Illumina Human BodyMap 2.0 Project (see Methods). This is the dataset that we originally used to choose the target and background sets for this study.
Since expression was measured using RNA-seq, we can study expression patterns of specific ADAR isoforms. Since most isoforms are not expressed in all tissues, we report results on ADAR variant 4, the most widely expressed ADAR isoform in our data (see Methods). We first calculated overall Alu editing levels for all 16 tissues by summing editing levels over all gene targets. Then, we calculated the correlation between these Alu editing levels and ADAR expression levels in the same HBM data set. The correlation we found was positive and strong (Spearman Rho = 0.35), but with the small number of samples (n = 16) it was not statistically significant (p-value = 0.19). When refining this test and computing the correlation with editing level in 4 specific sites (CDS, intron, 3’UTR or 5’UTR), all 4 correlations are positive and 2 were statistically significant (CDS: ρ = 0.54, p-value = 0.034; intron: ρ = 0.32, p-value = 0.23; 3’UTR, ρ = 0.28, p-value = 0.3; 5’UTR, ρ = 0.61, p-value = 0.015, Figure S4). The fact that the correlation is not necessarily significant (although consistently positive) could stem from the relatively low number of samples (16 samples, while the Kang-2011 and ABA-2013 datasets consist of thousands of samples).
We used the HBM data set to check the correlation structure between ADAR and the target and background sets, chosen as described in the Methods section. In this dataset as well, ADAR correlations with targets are significantly more positive than with the background set (median Spearman correlation with targets = 0.106, with background = 0.073, Wilcoxon test for different medians, z-value = 6.02, p-value = 1.75*10−9, n = 25688). To verify that this effect is ADAR-specific, we repeated the analysis while replacing ADAR with every other gene in the data set. ADAR has scored in the top 3 percentile of all genes (569 out of 25688), implying that this effect is significantly specific to ADAR.
Correlations with ADAR over development
RNA editing has been suggested to be involved in brain development and neurodegeneration.Citation17-19,52 The Kang-2011 dataset is a neural expression survey measured over development, allowing to test if the positive ADAR-target correlations change over time. We examined the dynamics of the correlations over brain development, and found that spatial correlations of ADAR and its targets are higher than with the background set throughout development (Figure S5). Considering the distribution of correlations in every time point reveals that for at least some of the time points, the histograms of correlations between ADAR and targets are bi-modal (see example time points at , Figure S5 shows results for all time points).
Figure 3. ADAR-target correlations over development. The distribution of spatial correlation values between ADAR and targets with intronic Alus (orange) and between ADAR and a background set (blue), at 2 developmental time points: (A) 10-13 PCW and (B) 6-12 months. (C) Differential co-expression of ADAR and targets. Heatmap of Spearman correlation rho values showing the temporal cross-correlation between target gene lists ranked by their correlation with ADAR.
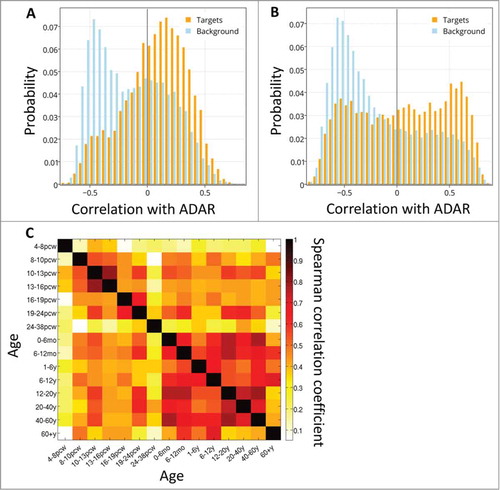
To test the stability of the groups of target genes that are correlated with ADAR, and how these groups may change across different time points, we calculated the cross-correlation between the lists of correlations of target genes and ADAR at every 2 time points (). We found that the target genes correlated with ADAR are similar in 2 embryonic time points (10–13 pcw and 13–16 pcw), and in most of the adult time points (excluding the last one, 60y+).
In order to functionally characterize the bimodal distributions in these 2 clusters, we pooled together data from all embryonic time points and all post-natal time points, and performed a GO enrichment analysis on the positively correlated genes and the negatively correlated ones using GOrilla.Citation40 The functional analysis revealed that in the embryonic time points, the genes that are positively correlated with ADAR are highly enriched for processes such as RNA binding, mRNA processing and gene expression (see Table ST1 for the full lists of categories). The negatively correlated genes are enriched for "ion transport" (FDR q-value <10−7). In the post-natal time points the positively correlated genes and the negatively correlated ones are not enriched for a particular biological process.
Discussion
The current paper addresses the question of what genome-wide impact RNA A-to-I editing may have on expression in the brain. We aimed to resolve an apparent conflict: On one hand, it has been shown that in some cases editing could dramatically impact expression of genes. On the other hand, the unique abundance of editing targets in human genes would mean that if editing affects the expression of all its targets, it would lead to massive expression changes.
Using two data sets that measured gene expression in multiple locations in human brains, we computed the spatial correlation between the expression profile of ADARs and their known targets.Citation4 Surprisingly, we found that the distribution of correlations in many brain samples was bi-modal: while some genes were negatively correlated with ADAR1 as expected, many targets of ADAR were actually positively correlated with ADAR1 (but not ADAR2). This is somewhat surprising because it is believed that edited genes would be down regulated in the presence of ADAR. The group of positively correlated genes was enriched for functions including RNA processing, suggesting that ADAR operates as part of wide RNA regulation mechanisms. This is in agreement with the fact that ADAR is known to interact with multiple proteins involved in RNA processing.Citation1,38,47-53
The spatial correlations between ADAR1 and its targets were significantly more negative in a baseline set of genes, (P-value< 10−90), and were consistent across the 2 datasets that we analyzed. Interestingly, the distribution of correlations change during development, and the correlation profile differs significantly before and after birth. This is in agreement with the fact that the editing level of some key targets of ADAR, such as genes coding for GluR5, GluR6 and Gabra3 receptors, have been shown to change significantly along development.Citation61-Citation65
We controlled for several potential biases. First, genes that contain Alus tend to be longer, since Alu insertions lengthen a gene (and making it even more prone to Alu insertion). We tested if gene length could lead to a bias in expression correlation but found no such effect.
Second, most Alus are located in introns, while most edited transcripts that were studied undergo editing in their 3’ UTR. We found a similar distribution of spatial-correlations in genes, regardless of editing location (3’ UTR, 5’UTR or introns). Third, to verify that the positive correlations we observed do not reflect an epi-phenomenon of a genome-wide expression changes between brain regions, we computed the correlations between ADAR targets and all genes. ADAR itself was highly ranked in this list (ranked 14, P-value < 0.001), suggesting that the correlations we observe are largely ADAR-specific. We also validated our results using the HBM data set, in which expression levels were calculated in the same dataset that was used to choose the editing target genes.
These results suggest that RNA editing in the human brain does not lead to consistent and wide alterations in expression. This is in agreement with the idea that if editing was to lead to expression reduction in primates, its effects would be overly massive since Alu are abundant in the primate genome. Such an effect could have been magnified even further, since it has been shown that introducing hyper-edited transcripts into the nucleus of Xenopus cells leads to reduction of transcription, which is not specific to the hyperedited transcript (in trans).Citation31
How robust are these results in respect to the set of target genes we tested? It has recently become clear that the majority of human genes undergo editing. Here we defined the set of positive targets to contain only genes where editing was observed, and the set of negatives as genes that do not contain Alu. While it is possible that more genes would be shown to be edited, hence growing the positive set, the set of positives is already comprehensive, containing 6–7 K genes in the 2 data sets. We therefore expect the results to be non-sensitive to adding more positive genes. We also repeated our analysis using sets of targets chosen with each tissue sample of the HBM dataset, and find that the positive correlations between ADAR and its putative targets are consistent across tissues.
The above results are based on separating genes into 2 groups: edited and non-edited genes. However, it's important to remember that the target and background set genes are not necessarily edited in all developmental stages and brain regions that were investigated. Today, it is still costly to measure the actual editing levels at a genome scale in each specific tissue. This is because editing in Alu typically occurs at less than 1 percent per adenosine,Citation4 hence estimating editing levels requires large coverage. We expect that these types of measurements will become feasible in the near future, and could clarify the more detailed relation between editing and expression. Furthermore, to obtain an accurate measure of the relation between expression and editing, one wishes to measure both in single cells. Excitingly, new technologies now allow to extract RNA from single cells, and are expected to shed more light on the relation between RNA editing and gene expression. Another important issue is the fact that mRNA expression levels do not necessarily reflect protein expression levels, although a recent study suggests that the correlation between mRNA and protein abundance is higher than previously thought.Citation66
The above results suggest that editing does not necessarily lead to expression reduction in a large scale, but leave important questions. Foremost, what molecular mechanisms prevent expression reduction of edited transcripts, and what could be the implications of the increased diversity of transcripts following editing.Citation67-Citation69
Methods
The data
We used gene expression data from 2 sources: the Allen Human Brain AtlasCitation34 and Kang-2011.Citation35 Neuroanatomical expression data from the Human Brain Atlas was averaged across probes. We used the probe to gene mappings provided by the Allen Institute. This averaging provides donor specific gene by region expression profiles that range in size from 185 to 348 brain regions that provide expression data for 29,176 transcripts. Probes which are not mapped to genes were discarded, leaving data for 20773 transcripts. Donor age ranges from 24 to 57 years old (more information available at http://human.brain-map.org/).
Gene expression data from the Kang-2011 data set covers 15 developmental stages across 30 time points. The number of sampled brain regions ranged between 2-16 for each of the 41 donors. The gene summarized exon array data contains profiles for 17565 genes across 1340 samples.
Choosing target and background sets
We used the Illumina Human BodyMap 2.0 Project (GEO accession number GSE30611, HBM) to find RNA editing sites within Alu repeats. This data was generated on HiSeq 2000 instruments, and consists of RNA-seq of 16 human tissue types: adrenal, adipose, brain, breast, colon, heart, kidney, liver, lung, lymph, ovary, prostate, skeletal muscle, testes, thyroid and white blood cells. The process of identifying edited Alu repeats is based on an analysis recently publishedCitation4 and we describe it here shortly. The HBM dataset was aligned to the human genome (hg19) using Bowtie alignerCitation70 with liberal parameters that allow mismatch detection (−n 3, −l 20, −k 20, −e 140 −−best). With these parameters, only reads for which a single alignment was found were considered for all downstream analysis. Next, reads that overlappedAlu repeat regions were considered. Following alignment, all mismatches between the above reads to the reference genome residing inAlu elements were collected. Mismatches in read positions with quality phredscore <30 were discarded, as were genomic locations which appear as genomic SNP in dbSNP (SNP build 131). The reads were then filtered using a probabilistic model. For each genomic site, the probability that the observed mismatches in the reads in this genomic base pair could result from sequencing errors was calculated, assuming ana priorisequencing error rate of 0.001 (associated with thephredscore cutoff of 30). Controlling for the multiple testing over allAlu nucleotides, the Benjamini-Hochberg correction was applied to produce a set of putatively modified nucleotides, setting the desired false detection rate at 0.05.
Genes containing Alu elements that were found to be edited in a brain sample were included in our target set. The background set was defined as the complementary set of genes in each data set. For the ABA-2013 set, the number of targets is 7,864, and the number of background genes is 12,909. For Kang-2011 set, the numbers of targets is 6834, and the number of genes in the background set is 10,731 (Table 1).
When splitting the target groups based on the location of the Alu repeats, in ABA-2013 dataset there are 7,494 genes with intronic Alus, 1,024 genes with Alus in the 3'UTR, 92 genes with Alus in the 5'UTR and 38 genes with Alus in the CDS, and in Kang-2011 data set there are 6,525 genes with intronic Alus, 878 genes with Alus in the 3'UTR, 55 genes with Alus in the 5'UTR and 37 genes with Alus in the CDS (Table 1).
Testing ADAR-target correlations at different Alu locations
To take into account the different sizes of target groups when split according to Alu location (CDS, intron, 3'UTR and 5'UTR), we applied a bootstrap approach by sampling subsets of targets in the size of the smallest group, the CDS set, from all other groups 1,000 times, and calculating a p-value for each sample.
Functional analysis of gene sets
To functionally characterize the target genes negatively and positively co-expressed with ADAR, we calculated the spatial correlation of each target gene in the Kang-2011 dataset at each time point. We ranked the genes based on the correlations in an ascending and descending order for embryonic and post-natal time points, and performed a Gene Ontology (GO) enrichment analysis on ranked gene sets using GOrilla.Citation40
Selection of known brain transcription factors and their targets
To select TFs and their targets, we used Chip-seq data from,Citation44 where 59 TFs and chromatin modifiers in one HapMap lymphoblastoid cell line were knocked down. We considered candidate TF binding (based on ChIP-seq and DNase-seq) within 10 kb of the transcription start sites of expressed genes. We then used the resulting specific TF targets to study the correlation of TFs and their corresponding targets in the Kang-2011 and ABA-2013 brain samples.
Out of the 29 TFs which had both binding data and gene expression data (measuring expression changes following knock down of the putative TF), we selected TFs based on 2 criteria: relatedness to neural processes, and the number of target genes. First, we screened the TFs using the gene ontology (GO) for functions related to brain development and function.Citation45 The full list of brain related functional categories is available as Table ST2. Second, since ADAR has thousands of Alu editing targets, for easier comparison we screened the remaining TFs for those with 500 and more potential targets. After applying these 2 screening steps, we were left with 3 relevant TFs: EP300, PAX5 and TCF12. We checked the correlation of each TF with its putative targets versus a background set which contains all other genes (Supplementary Figure S3).
ADAR correlation analysis using the HBM data set
We used the HBM dataset that was used to originally choose the target set of genes to calculate both Alu editing levels and mRNA expression levels for all genes. We used the data generated using 1 × 75 bp single-read data to find RNA-editing levels withinAlu repeats. We used TopHat to align the RNA-seq reads to the genomeCitation51 and Cufflinks to assemble the reads into transcripts and report FPKM values.Citation51
ADAR isoform expression
Since HBM expression was measured using RNA-seq, we can study the expression patterns of specific ADAR isoforms. However, out of the 5 ADAR isoforms only one is expressed in all the tissues (NM_001025107). One variant is only expressed in 2 tissues (NM_001111 inadipose tissue and colon) and another variant is expressed in only one tissue (NM_015840, in thyroid). The two remaining ADAR variants are not expressed in this study. Therefore, the data for the rest of the ADAR variants cannot be used for a correlation-based analysis and we report results on ADAR variant 4, the most common ADAR isoform.
Disclosure of Potential Conflicts of Interest
No potential conflicts of interest were disclosed.
Supplemental Material
Supplemental data for this article can be accessed on the publisher's website.
References
- Nishikura K. Functions and regulation of RNA editing by ADAR deaminases. Annu Rev Biochem 2010; 79:321–49. PMID:20192758
- Bass BL. RNA editing by adenosine deaminases that act on RNA. Annu Rev Biochem 2002; 71:817-46; PMID:12045112; http://dx.doi.org/10.1146/annurev.biochem.71.110601.135501
- Savva Ya, Rieder LE, Reenan Ra. The ADAR protein family. Genome Biol 2012; 13:252; PMID:23273215; http://dx.doi.org/10.1186/gb-2012-13-12-252
- Bazak L, Haviv A, Barak M, Jacob-Hirsch J, Deng P, Zhang R, Isaacs FJ, Rechavi G, Li JB, Eisenberg E, et al. A-to-I RNA editing occurs at over a hundred million genomic sites, located in a majority of human genes. Genome Res 2013; gr.164749.113-; PMID:24347612
- Bahn JH, Lee J-H, Li G, Greer C, Peng G, Xiao X. Accurate identification of A-to-I RNA editing in human by transcriptome sequencing. Genome Res 2012; 22:142-50; PMID:21960545; http://dx.doi.org/10.1101/gr.124107.111
- Li JB, Levanon EY, Yoon J-K, Aach J, Xie B, Leproust E, Zhang K, Gao Y, Church GM. Genome-wide identification of human RNA editing sites by parallel DNA capturing and sequencing. Science 2009; 324:1210-3; PMID:19478186; http://dx.doi.org/10.1126/science.1170995
- Park E, Williams B, Wold BJ, Mortazavi A. RNA editing in the human ENCODE RNA-seq data. Genome Res 2012; 22:1626-33; PMID:22955975; http://dx.doi.org/10.1101/gr.134957.111
- Ramaswami G, Lin W, Piskol R, Tan MH, Davis C, Li JB. Accurate identification of human Alu and non-Alu RNA editing sites. Nat Methods 2012; 9:579-81; PMID:22484847; http://dx.doi.org/10.1038/nmeth.1982
- Ramaswami G, Zhang R, Piskol R, Keegan LP, Deng P, O’Connell MA, Li JB. Identifying RNA editing sites using RNA sequencing data alone. Nat Methods 2013; 10:128-32; PMID:23291724; http://dx.doi.org/10.1038/nmeth.2330
- Peng Z, Cheng Y, Tan BC-M, Kang L, Tian Z, Zhu Y, Zhang W, Liang Y, Hu X, Tan X, et al. Comprehensive analysis of RNA-Seq data reveals extensive RNA editing in a human transcriptome. Nat. Biotechnol 2012; 30:253-60
- Kim DDY, Kim TTY, Walsh T, Kobayashi Y, Matise TC, Buyske S, Gabriel A. Widespread RNA editing of embedded alu elements in the human transcriptome. Genome Res 2004; 14:1719-25; PMID:15342557; http://dx.doi.org/10.1101/gr.2855504
- Levanon EY, Eisenberg E, Yelin R, Nemzer S, Hallegger M, Shemesh R, Fligelman ZY, Shoshan A, Pollock SR, Sztybel D, et al. Systematic identification of abundant A-to-I editing sites in the human transcriptome. Nat Biotechnol 2004; 22:1001-5; PMID:15258596; http://dx.doi.org/10.1038/nbt996
- Athanasiadis A, Rich A, Maas S. Widespread A-to-I RNA editing of Alu-containing mRNAs in the human transcriptome. PLoS Biol 2004; 2:e391; PMID:15534692; http://dx.doi.org/10.1371/journal.pbio.0020391
- Blow M, Futreal PA, Wooster R, Stratton MR. A survey of RNA editing in human brain. Genome Res 2004; 14:2379-87; PMID:15545495; http://dx.doi.org/10.1101/gr.2951204
- Burns CM, Chu H, Rueter SM, Hutchinson LK, Canton H, Sanders-Bush E, Emeson RB. Regulation of serotonin-2C receptor G-protein coupling by RNA editing. Nature 1997; 387:303-8; PMID:9153397; http://dx.doi.org/10.1038/387303a0
- Sanjana NE, Levanon EY, Hueske EA, Ambrose JM, Li JB. Activity-dependent A-to-I RNA editing in rat cortical neurons. Genetics 2012; 192:281-7; PMID:22714409; http://dx.doi.org/10.1534/genetics.112.141200
- Palladino MJ, Keegan LP, O’Connell MA, Reenan RA. A-to-I pre-mRNA editing in Drosophila is primarily involved in adult nervous system function and integrity. Cell 2000; 102:437-49; PMID:10966106; http://dx.doi.org/10.1016/S0092-8674(00)00049-0
- Tonkin LA, Saccomanno L, Morse DP, Brodigan T, Krause M, Bass BL. RNA editing by ADARs is important for normal behavior in Caenorhabditis elegans. EMBO J 2002; 21:6025-35; PMID:12426375; http://dx.doi.org/10.1093/emboj/cdf607
- Higuchi M, Maas S, Single FN, Hartner J, Rozov A, Burnashev N, Feldmeyer D, Sprengel R, Seeburg PH. Point mutation in an AMPA receptor gene rescues lethality in mice deficient in the RNA-editing enzyme ADAR2. Nature 2000; 406:1998-2001
- Eran A, Li JB, Vatalaro K, McCarthy J, Rahimov F, Collins C, Markianos K, Margulies DM, Brown EN, Calvo SE, et al. Comparative RNA editing in autistic and neurotypical cerebella. Mol Psychiatry 2012; PMID:22869036
- Silberberg G, Lundin D, Navon R, Öhman M. Deregulation of the A-to-I RNA editing mechanism in psychiatric disorders. Hum Mol Genet 2012; 21:311-21; PMID:21984433; http://dx.doi.org/10.1093/hmg/ddr461
- Chen L, Li Y, Lin CH, Chan THM, Chow RKK, Song Y, Liu M, Yuan Y-F, Fu L, Kong KL, et al. Recoding RNA editing of AZIN1 predisposes to hepatocellular carcinoma. Nat Med 2013; 19:209-16; PMID:23291631; http://dx.doi.org/10.1038/nm.3043
- Ramaswami G, Li JB. RADAR: a rigorously annotated database of A-to-I RNA editing. Nucleic Acids Res 2014; 42:D109-13; PMID:24163250; http://dx.doi.org/10.1093/nar/gkt996
- Levanon K, Eisenberg E, Rechavi G, Levanon EY. Letter from the editor: Adenosine-to-inosine RNA editing in Alu repeats in the human genome. EMBO Rep.2005; 6:831-5; PMID:16138094; http://dx.doi.org/10.1038/sj.embor.7400507
- Chen LL, Carmichael GG. Nuclear retention of mRNAs containing inverted repeats in human embryonic stem cells : functional role of a nuclear noncoding RNA. Mol Cell 2009; 35:467-78; PMID:19716791; http://dx.doi.org/10.1016/j.molcel.2009.06.027
- Prasanth K V, Prasanth SG, Xuan Z, Hearn S, Freier SM, Bennett CF, Zhang MQ, Spector DL. Regulating gene expression through RNA nuclear retention. Cell 2005; 123:249-63; PMID:16239143; http://dx.doi.org/10.1016/j.cell.2005.08.033
- Zhang Z, Carmichael GG. The fate of dsRNA in the nucleus: a p54nrb-containing complex mediates the nuclear retention of promiscuously A-to-I edited RNAs. Cell 2001; 106:465-75; PMID:11525732; http://dx.doi.org/10.1016/S0092-8674(01)00466-4
- Scadden ADJ. The RISC subunit Tudor-SN binds to hyper-edited double-stranded RNA and promotes its cleavage. Nat Struct Mol Biol 2005; 12:489-96; PMID:15895094; http://dx.doi.org/10.1038/nsmb936
- Scadden ADJ, O’Connell MA. Cleavage of dsRNAs hyper-edited by ADARs occurs at preferred editing sites. Nucleic Acids Res 2005; 33:5954-64; PMID:16254076; http://dx.doi.org/10.1093/nar/gki909
- Scadden AD, Smith CW. Specific cleavage of hyper-edited dsRNAs. EMBO J 2001; 20:4243-52; PMID:11483527; http://dx.doi.org/10.1093/emboj/20.15.4243
- Scadden AD. Inosine-containing dsRNA binds a stress-granule-like complex and downregulates gene expression in trans. Mol Cell 2007; 491-500; PMID:17996712; http://dx.doi.org/10.1016/j.molcel.2007.09.005
- Liang H, Landweber LF. Hypothesis: RNA editing of microRNA target sites in humans? RNA 2007; 13:463-7. PMID:17255198; http://dx.doi.org/10.1261/rna.296407
- Lev-Maor G, Sorek R, Levanon EY, Paz N, Eisenberg E, Ast G. RNA-editing-mediated exon evolution. Genome Biol 2007; 8:R29; PMID:17326827; http://dx.doi.org/10.1186/gb-2007-8-2-r29
- Website: © 2012 Allen Institute for Brain Science. Allen Human Brain Atlas [Internet]. Available from:
- Kang HJ, Kawasawa YI, Cheng F, Zhu Y, Xu X, Li M, Sousa AMM, Pletikos M, Meyer KA, Sedmak G, et al. Spatio-temporal transcriptome of the human brain. Nature 2011; 478:483-9; PMID:22031440; http://dx.doi.org/10.1038/nature10523
- Paschen W, Djuricic B. Extent of RNA editing of glutamate receptor subunit GluR5 in different brain regions of the rat. Cell Mol Neurobiol 1994; 14:259-70; PMID:7536132; http://dx.doi.org/10.1007/BF02088324
- Wang IX, So E, Devlin JL, Zhao Y, Wu M, Cheung VG. ADAR Regulates RNA Editing, Transcript Stability, and Gene Expression. Cell Rep 2013; 5:849-60; PMID:24183664; http://dx.doi.org/10.1016/j.celrep.2013.10.002
- Riedmann EM, Schopoff S, Hartner JC, Jantsch MF. Specificity of ADAR-mediated RNA editing in newly identified targets. RNA 2008; 14:1110-8; PMID:18430892; http://dx.doi.org/10.1261/rna.923308
- Chen C, Cho D, Wang Q, Lai F. A third member of the RNA-specific adenosine deaminase gene family, ADAR3, contains both single-and double-stranded RNA binding domains. RNA 2000; 6:755-67; PMID:10836796; http://dx.doi.org/10.1017/S1355838200000170
- Eden E, Navon R, Steinfeld I, Lipson D, Yakhini Z. GOrilla: a tool for discovery and visualization of enriched GO terms in ranked gene lists. BMC Bioinformatics 2009; 10:48; PMID:19192299; http://dx.doi.org/10.1186/1471-2105-10-48
- Li L, Monckton EA, Godbout R. A role for DEAD box 1 at DNA double-strand breaks. Mol Cell Biol 2008; 28:6413-25; PMID:18710941; http://dx.doi.org/10.1128/MCB.01053-08
- Lavado A, He Y, Paré J, Neale G, Olson EN, Giovannini M, Cao X. Tumor suppressor Nf2 limits expansion of the neural progenitor pool by inhibiting Yap/Taz transcriptional coactivators. Development 2013; 140:3323-34; PMID:23863479; http://dx.doi.org/10.1242/dev.096537
- Mehler MF, Mattick JS. Noncoding RNAs and RNA editing in brain development, functional diversification, and neurological disease. Physiol Rev 2007; 87:799-823.
- Cusanovich DA, Pavlovic B, Pritchard JK, Gilad Y. The Functional Consequences of Variation in Transcription Factor Binding. PLoS Genet 2014; 10. PMID:24603674; http://dx.doi.org/10.1371/journal.pgen.1004226
- Ashburner M, Ball CA, Blake JA, Botstein D, Butler H, Cherry JM, Davis AP, Dolinski K, Dwight SS, Eppig JT, et al. Gene Ontology: tool for the unification of biology. Nat Genet 2000; 25:25; PMID:10802651; http://dx.doi.org/10.1038/75556
- Garncarz W, Tariq A, Handl C, Pusch O, Jantsch MF. A high-throughput screen to identify enhancers of ADAR-mediated RNA-editing. RNA Biol 2013; 10:192-204; PMID:23353575; http://dx.doi.org/10.4161/rna.23208
- Jacobs MM, Fogg RL, Emeson RB, Stanwood GD. ADAR1 and ADAR2 expression and editing activity during forebrain development. Dev Neurosci 2009; 31:223-37; PMID:19325227; http://dx.doi.org/10.1159/000210185
- Wahlstedt H, Daniel C, Ensterö M, Ohman M. Large-scale mRNA sequencing determines global regulation of RNA editing during brain development. Genome Res 2009; 19:978-86; PMID:19420382; http://dx.doi.org/10.1101/gr.089409.108
- Ring H, Boije H, Daniel C, Ohlson J, Ohman M, Hallbook F. Increased A-to-I RNA editing of the transcript for GABAA receptor subunit alpha3 during chick retinal development. Vis Neurosci 2010; 27:149-57; PMID:20843408
- Qin Y-R, Qiao J-J, Chan THM, Zhu Y-H, Li F-F, Liu H, Fei J, Li Y, Guan X-Y, Chen L. Adenosine-to-inosine RNA editing mediated by ADARs in esophageal squamous cell carcinoma. Cancer Res 2014; 74:840-51; PMID:24302582; http://dx.doi.org/10.1158/0008-5472.CAN-13-2545
- Trapnell C, Roberts A, Goff L, Pertea G, Kim D, Kelley DR, Pimentel H, Salzberg SL, Rinn JL, Pachter L. Differential gene and transcript expression analysis of RNA-seq experiments with TopHat and Cufflinks. Nat Protoc 2012; 7:562-78; PMID:22383036; http://dx.doi.org/10.1038/nprot.2012.016
- Li JB, Church GM. Deciphering the functions and regulation of brain-enriched A-to-I RNA editing. Nat Neurosci 2013; 16:1518-22; PMID:24165678; http://dx.doi.org/10.1038/nn.3539
- Weissbach R, Scadden ADJ. Tudor-SN and ADAR1 are components of cytoplasmic stress granules. RNA 2012; 18:462-71; PMID:22240577; http://dx.doi.org/10.1261/rna.027656.111
- Scadden AD, Smith CW. RNAi is antagonized by A->I hyper-editing. EMBO Rep 2001; 2:1107-11; PMID:11743024; http://dx.doi.org/10.1093/embo-reports/kve244
- Agranat L, Raitskin O, Sperling J, Sperling R. The editing enzyme ADAR1 and the mRNA surveillance protein hUpf1 interact in the cell nucleus. Proc Natl Acad Sci U S A 2008; 105:5028-33; PMID:18362360; http://dx.doi.org/10.1073/pnas.0710576105
- Ota H, Sakurai M, Gupta R, Valente L, Wulff B-E, Ariyoshi K, Iizasa H, Davuluri R V, Nishikura K. ADAR1 forms a complex with Dicer to promote microRNA processing and RNA-induced gene silencing. Cell 2013; 153:575-89; PMID:23622242; http://dx.doi.org/10.1016/j.cell.2013.03.024
- Warf MB, Shepherd BA, Johnson WE, Bass BL. Effects of ADARs on small RNA processing pathways in C. elegans. Genome Res 2012; 22:1488-98; PMID:22673872; http://dx.doi.org/10.1101/gr.134841.111
- Heale BSE, Keegan LP, McGurk L, Michlewski G, Brindle J, Stanton CM, Caceres JF, O’Connell MA. Editing independent effects of ADARs on the miRNA/siRNA pathways. EMBO J 2009; 28:3145-56; PMID:19713932; http://dx.doi.org/10.1038/emboj.2009.244
- Nie Y, Ding L, Kao PN, Braun R, Yang J-H. ADAR1 interacts with NF90 through double-stranded RNA and regulates NF90-mediated gene expression independently of RNA editing. Mol Cell Biol 2005; 25:6956-63; PMID:16055709; http://dx.doi.org/10.1128/MCB.25.16.6956-6963.2005
- Raitskin O, Cho DS, Sperling J, Nishikura K, Sperling R. RNA editing activity is associated with splicing factors in lnRNP particles: The nuclear pre-mRNA processing machinery. Proc Natl Acad Sci U S A 2001; 98:6571-6; PMID:11381114; http://dx.doi.org/10.1073/pnas.111153798
- Dillman Aa, Hauser DN, Gibbs JR, Nalls Ma, McCoy MK, Rudenko IN, Galter D, Cookson MR. mRNA expression, splicing and editing in the embryonic and adult mouse cerebral cortex. Nat Neurosci 2013; 16:499-506; PMID:23416452; http://dx.doi.org/10.1038/nn.3332
- Bernard A, Khrestchatisky M. Assessing the extent of RNA editing in the TMII regions of GluR5 and GluR6 kainate receptors during rat brain development. J Neurochem 1994; 62:2057-60; PMID:7512622; http://dx.doi.org/10.1046/j.1471-4159.1994.62052057.x
- Hanrahan CJ, Palladino MJ, Ganetzky B, Reenan RA. RNA editing of the Drosophila para Na(+) channel transcript. Evolutionary conservation and developmental regulation. Genetics 2000; 155:1149-60; PMID:10880477
- Rula EY, Lagrange AH, Jacobs MM, Hu N, Macdonald RL, Emeson RB. Developmental modulation of GABA(A) receptor function by RNA editing. J Neurosci 2008; 28:6196-201; PMID:18550761; http://dx.doi.org/10.1523/JNEUROSCI.0443-08.2008
- Ohlson J, Pedersen JS, Haussler D, Ohman M. Editing modifies the GABA(A) receptor subunit alpha3. RNA 2007; 13:698-703; PMID:17369310; http://dx.doi.org/10.1261/rna.349107
- Li JJ, Bickel PJ, Biggin MD. System wide analyses have underestimated protein abundances and the importance of transcription in mammals. PeerJ 2014; 2:e270; PMID:24688849; http://dx.doi.org/10.7717/peerj.270
- Barak M, Levanon EY, Eisenberg E, Paz N, Rechavi G, Church GM, Mehr R. Evidence for large diversity in the human transcriptome created by Alu RNA editing. Nucleic Acids Res 2009; 37:6905-15; PMID:19740767; http://dx.doi.org/10.1093/nar/gkp729
- Mattick JS, Mehler MF. RNA editing, DNA recoding and the evolution of human cognition. Trends Neurosci 2008; 31:227-33; PMID:18395806; http://dx.doi.org/10.1016/j.tins.2008.02.003
- Paz-Yaacov N, Levanon EY, Nevo E, Kinar Y, Harmelin A, Jacob-Hirsch J, Amariglio N, Eisenberg E, Rechavi G. Adenosine-to-inosine RNA editing shapes transcriptome diversity in primates. Proc Natl Acad Sci U S A 2010; 107:12174-9; PMID:20566853; http://dx.doi.org/10.1073/pnas.1006183107
- Langmead B, Trapnell C, Pop M, Salzberg SL. Ultrafast and memory-efficient alignment of short DNA sequences to the human genome. Genome Biol 2009; 10:R25; PMID:19261174; http://dx.doi.org/10.1186/gb-2009-10-3-r25