
Abstract
Macroautophagy, a catabolic process of cellular self-digestion, is an important tumor cell survival mechanism and a potential target in antineoplastic therapies. Recent discoveries have implicated autophagy in the cellular secretory process, but potential roles of autophagy-mediated secretion in modifying the tumor microenvironment are poorly understood. Furthermore, efforts to inhibit autophagy in clinical trials have been hampered by suboptimal methods to quantitatively measure tumor autophagy levels. Here, we leveraged the autophagy-based involvement in cellular secretion to identify shed proteins associated with autophagy levels in melanoma. The secretome of low-autophagy WM793 melanoma cells was compared to its highly autophagic metastatic derivative, 1205Lu in physiological 3-dimensional cell culture using quantitative proteomics. These comparisons identified candidate autophagy biomarkers IL1B (interleukin 1, β), CXCL8 (chemokine (C-X-C motif) ligand 8), LIF (leukemia inhibitory factor), FAM3C (family with sequence similarity 3, member C), and DKK3 (dickkopf WNT signaling pathway inhibitor 3) with known roles in inflammation and tumorigenesis, and these proteins were subsequently shown to be elevated in supernatants of an independent panel of high-autophagy melanoma cell lines. Secretion levels of these proteins increased when low-autophagy melanoma cells were treated with the autophagy-inducing tat-BECN1 (Beclin 1) peptide and decreased when ATG7 (autophagy-related 7) was silenced in high-autophagy cells, thereby supporting a mechanistic link between these secreted proteins and autophagy. In addition, serum from metastatic melanoma patients with high tumor autophagy levels exhibited higher levels of these proteins than serum from patients with low-autophagy tumors. These results suggest that autophagy-related secretion affects the tumor microenvironment and measurement of autophagy-associated secreted proteins in plasma and possibly in tumors can serve as surrogates for intracellular autophagy dynamics in tumor cells.
Abbreviations:
- ATG5, autophagy-related 5
- ATG7, autophagy-related 7
- BECN1, Beclin 1, autophagy-related
- AV, autophagic vacuole
- CXCL8, chemokine (C-X-C motif) ligand 8
- DKK3, dickkopf WNT signaling pathway inhibitor 3
- EGF, epidermal growth factor
- IF, interstitial fluid
- IL1B, interleukin 1, β
- LC3/MAP1LC3, microtubule-associated protein 1 light chain 3
- LIF, leukemia inhibitory factor
- M, media
- PtdIns3K, phosphatidylinositol 3-kinase
- SAM, significance analysis of microarrays
Introduction
The development of chemoresistance is an emerging problem in the treatment of advanced cancers. A common mechanism of resistance to therapy is macroautophagy, which from this point we will refer to simply as ‘autophagy,’ a catabolic process that sequesters damaged organelles and protein aggregates for degradation.Citation1 Regulated by a vast intracellular signaling network, autophagy occurs at basal levels in virtually all cells to perform its homeostatic functions and adaptively responds to environmental stresses to confer cell survival.Citation2 Autophagy initiates with the nucleation of an autophagic vacuole (AV), generated from the surface of source membranes by PtdIns3K and BECN1.Citation3 LC3 integrates into the autophagic vacuole bilayer and is conjugated to phosphatidylethanolamine by ubiquitin ligase-like protein conjugation complexes. Fusion of autophagic vacuoles with lysosomes results in the degradation of vesicle cargo by acid hydrolases. Autophagic vacuole components that are degraded are recycled to fuel further growth via multiple transporters on the surface of the autolysosome.Citation4 Recent evidence suggests that autophagy serves a protumorigenic role in established tumors, facilitating cell survival in the face of microenvironmental stress in the form of hypoxia, nutrient deprivation, or cytotoxic drugs.Citation5 Autophagy may be especially relevant to melanoma aggressiveness, since the melanocyte already has high levels of autophagy present in order to produce melanin,Citation6 and melanomas frequently have RAF or RAS mutations that may necessitate higher levels of autophagy to survive oncogene-induced stress.Citation7,8
In preclinical models of melanoma, inhibition of autophagy with either hydroxychloroquine or targeted knockdown of the essential autophagy gene ATG5 (autophagy-related 5) was also found to augment the cytotoxic effects of alkylating agents in tumor cells, suggesting a role for autophagy in survival.Citation1 Importantly, clinical trials involving combinations of anticancer therapies with the autophagy inhibitor hydroxychloroquine have recently been reported.Citation9–14 These trials have shown that clinically achievable doses of hydroxychloroquine will modulate autophagy in human tissues, combination regimens involving hydroxychloroquine are often well tolerated, and in some cases, patients benefited from the antitumor activity of autophagy inhibition. One important component that was missing in those studies is a predictive biomarker that can select those patients most likely to respond to autophagy modulation. Pretreatment patient melanoma tumor samples revealed a striking level of heterogeneity in autophagy levels,Citation1,5 and high autophagy was associated with tumor cell survival, chemotherapeutic resistance, and metastasis, whereas low autophagy levels predicted better therapeutic outcomes in chemotherapy based trials. High levels of autophagy in pretreatment tumors could predict those patients that may exhibit the best response to autophagy inhibitors.
Currently, quantitative preclinical assays that reproducibly monitor autophagy and can be easily translated into clinical predictive assays remain elusive, thereby impeding the development of autophagy inhibitors in the clinic.Citation15 Electron microscopy allows for direct quantification of autophagic vacuoles, but measurements are subjective and the procedure is laborious and costly. Furthermore, it is often performed on surrogate tissues rather than on tumor tissue, and such measurements may not always reflect the autophagy dynamics of the tumor microenvironment. Assays relying on the detection of LC3 provide insight into the prevalence of mature autophagic vacuoles, but these methods are semi-quantitative and not easily translated into monitoring clinical samples, as LC3 expression is difficult to detect in tissue.Citation16 Another challenge to developing effective markers of autophagy modulation is the striking difference in the autophagic response when cells grown in 2-dimensional (2D) cultures are compared with cells growing in the tumor microenvironment. In this regard, 3-dimensional (3D) cell culture appears to more faithfully reproduce autophagy dynamics found in the tumor microenvironment compared to traditional 2D culture. However, quantitative analytical methods to confirm these qualitative observations have not yet been developed.
There is emerging evidence that autophagy is not only involved in the intracellular degradation of damaged proteins, but also plays an important role in nonclassical protein secretion.Citation17-19 Leveraging the fact that basal autophagy varies extensively across melanoma cell lines and tumor tissue,Citation5 we hypothesized that an in-depth molecular comparison of cell secretomes from melanoma cells with differing levels of autophagy can identify proteins whose levels reflect intracellular autophagy dynamics. Here we report the identification of a biologically diverse panel of candidate protein biomarkers of tumor cell autophagy through large-scale proteomics, and validation of the association of these candidate biomarkers with high levels of autophagy using a panel of melanoma cell lines, patient serum, and targeted induction of autophagy. Our work demonstrates that quantitative molecular profiling of the cell secretome can identify autophagy-related secretion of proteins that are promising vectors for monitoring intracellular autophagy dynamics in tumor cells.
Results
Determination of autophagic flux in metastatic 1205Lu and its parental cell line, WM793
The genetically paired melanoma cell lines, WM793 and 1205Lu, were used for initial secretome comparisons due to the inherent genetic heterogeneity across unrelated melanoma cell lines. The 1205Lu cell line is a subclone derived from the lung metastasis of WM793 in athymic mice, thus minimizing protein expression changes caused by genetic differences.Citation20 To characterize the number of AV/cell in complete medium in these paired cell lines, electron microscopy of WM793 and 1205Lu grown in complete medium was used to quantify AVs (). The median number of AVs/cell was significantly higher in 1205Lu compared to WM793 cells (8 v. 4 (P < 0.05), respectively, n = 35 cells) indicating higher autophagic flux in 1205Lu cells. To verify this, each cell line was infected with lentivirus designed to express mCherry-eGFP-LC3.Citation21 In this system, the acid and proteolytic environment of the lysosome quenches GFP fluorescence, and therefore red punctate staining indicates autophagsomes that have fused with lysosomes. Consistent with the electron micrographs, fluorescent images of melanoma cells expressing tandem fluorescent tagged LC3 (mCherry-eGFP-LC3) illustrate more mCherry-positive puncta in 1205Lu than WM793 (), indicating greater numbers of mature autophagosomes fusing with functional lysosomes and hence higher autophagic flux in 1205Lu. Immunoblot analysis of LC3 also showed elevated PE-modified LC3-II versus GAPDH or actin for 1205Lu cells compared with WM793 cells grown in medium supplemented with either 10% or 1% fetal bovine serum (FBS), again indicating higher autophagy in 1205Lu ()
Figure 1 (See previous page). Autophagic flux of paired melanoma cell lines and cellular response to growth conditions. (A) Representative electron micrographs and box plots of mean AV/cell for WM793 and 1205Lu cells (n = 35) grown in complete medium in 2-dimensional cell culture; *P < 0.05 based on the Mann-Whitney test. Red arrows indicate intracellular autophagosomes. Scale bars = 2 μm. (B) Representative fluorescent images (60X) of mCherry-eGFP-LC3 infected 1205Lu and WM793 cells. Red puncta represent mCherry-positive structures that reflect active fusion of autophagosomes with functional lysosomes (red arrows). Scale bars = 50 μm. *P < 0.05 using the Student t test. (C) LC3 immunoblotting of WM793 and 1205Lu melanoma cells grown in media supplemented with either 10% or 1% FBS. (D) Schematic of 3D cell culture spheroid model illustrating secretome sample acquisition from the overlaying media and interstitial fluid (media in the collagen matrix) compartments. (E) Live/Dead Assay in 3-dimensional spheroids grown in a collagen matrix after exposure for 24 h to either serum-free media or media with 1% FBS. Green (live), calcein AM; red (dead), propidium iodide.
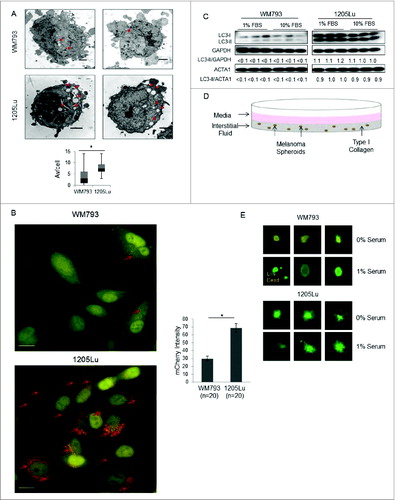
To better recapitulate the autophagy levels found in vivo, cells were grown as spheroids in type I bovine collagen in either 0% or 1% FBS (). Although serum-free conditions would enhance analytical depth of the secretome analysis using proteomics by avoiding interference from abundant serum proteins, substantial cell death was observed in the low autophagy WM793 melanoma spheroids after 24 h in culture with 0% bovine serum (). No significant cell death was observed for either cell line when 3D spheroids were grown in 1% serum. Therefore, this condition was used for subsequent experiments.
Evaluation of proteins in the interstitium and media of melanoma cells in 3D culture
Conditioned medium from above the surface of the collagen (media) and conditioned media from the interstitial space (interstitial fluid) within the collagen matrix () were analyzed separately by GeLC-MS/MS (in-gel digestion followed by liquid chromatography and tandem mass spectrometry) as shown in Fig. S1. As illustrated, to determine the reproducibility of this proteome analysis method, 50 to 100 spheroids for each cell line were grown in collagen in duplicate wells to produce biological replicate samples. In addition, the media fractions from Replicate 2 were divided in half and processed separately as technical replicates. Each sample was separated on a short SDS gel and gel lanes were divided into 20 equal slices to improve depth of analysis (Fig. S2A). The total numbers of protein and peptide identifications across all replicates were very similar (Fig. S2B). The specific proteins identified in biological replicates for interstitial fluid as well as biological and technical replicates for media were very similar for each cell line (Fig. S3).
An important consideration when analyzing conditioned medium from spheroid cell cultures is the potential for a subset of proteins to preferentially remain trapped within the collagen matrix rather than freely diffusing into the overlaying media layer. Proteins that bind very tightly to collagen would not be recovered in either fraction, but proteins with moderate affinity for collagen could potentially be detected more easily in the interstitial fraction. However, at the protein identification level only minor differences were observed between these 2 fractions (Fig. S3). Specifically, to quantitatively evaluate potential systematic sequestration in the collagen matrix, log-transformed and normalized protein intensities were compared between the media and interstitial fluid fractions for each cell line using a 95% confidence level as described in Materials and Methods (Fig. S4). Analysis of media and interstitial fluid across all replicates for each cell line revealed that no protein or protein group reproducibly localized in the interstitial fluid. Hence, to avoid potentially random variability in partial distribution of a subset of proteins between fractions, protein intensities from the interstitial fluid and media data were combined in silico.
Identification of differentially secreted proteins across 1205Lu and WM793 3D spheroids
MS signal intensities for proteins identified in the combined media and interstitial fluid secretomes were analyzed by significance analysis of microarrays (SAM) to identify proteins differentially secreted across high- and low-autophagy cell lines.Citation22 Only proteins that were both significantly different and showed at least a 2-fold difference between 1205Lu and WM793 3D secretomes were considered as potentially meaningful differences (Fig. S5). Overall, these 2 secretomes were highly similar, verifying the utility of using genetically paired cell lines. Specifically, of the 599 proteins identified in this study, 571 were present at similar levels in both cell lines, 26 proteins were elevated in 1205Lu and 2 proteins were elevated in WM793 (, Table S1). The estimated SAM false discovery rate was 3.5%.
Figure 2. Characterization of differentially secreted proteins by low- and high-autophagy melanoma cells. (A) Distribution of significantly elevated proteins (fold2- or greater) in either 1205Lu or WM793. (B) Classification of differentially secreted proteins by GO terms for cellular component using STRAP. Proteins may be assigned to multiple cellular component categories; percentages are computed as fraction of total assignments. (C) Classification of differentially secreted proteins by GO terms for biological process. Proteins may be assigned in multiple biological process categories; percentages are computed as fraction of total assignments. (D) Top-ranking subnetwork identified by shortest paths analysis and betweenness-centrality clustering based on functional relations from STRING. (E) Second-ranked functional subnetwork. Nodes colored in red are differentially secreted proteins identified in our study.
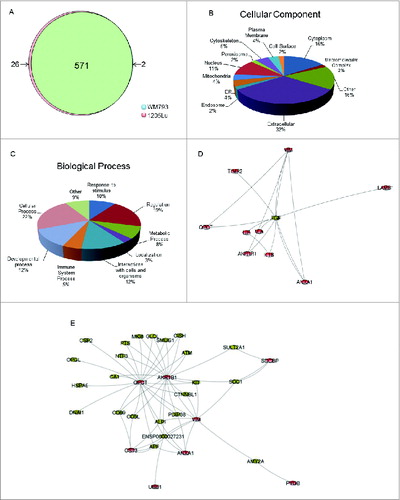
Differentially secreted proteins were classified by Gene Ontology terms for biological processes and cellular components using the Software Tool for Rapid Annotation of Proteins (STRAP). In terms of subcellular localization, 32% of proteins were identified as extracellular matrix proteins, 16% were annotated as cytoplasmic, and another 11% corresponded to nuclear proteins (). The remaining categories included plasma membrane, macromolecular complexes, cytoskeleton, peroxisome, and mitochondria, while 16% remained unclassified. Taken together, 38% of the differentially secreted proteins reside in the extracellular matrix, cell surface, or plasma membrane, the most common localizations previously identified for nonclassically secreted proteins.Citation23 Nonclassically secreted proteins also include cytokines, hormones, and growth factors that regulate cell growth, differentiation, invasion, and angiogenesis,Citation24 cell processes that represented 27% of the biological process GO terms derived from our secretome when including immune-related, developmental, and stimulus response processes ().
To investigate molecular signaling pathways that may link subsets of differentially secreted proteins, a network map of these secreted proteins was constructed using the shortest paths algorithm based on functional relationships from the STRING database. The high confidence network interactions (probability > 0.9) in our study represent functional linkages between proteins based on curated pathway and coexpression information. Betweenness-centrality clustering revealed a subnetwork highly centralized about the EGF (epidermal grown factor) node (). Although the role of EGF remains controversial in melanoma, at least one group has determined EGF signaling contributes to lymph node metastasis.Citation25 Interestingly, network analysis identified a direct connection between EGF with the robustly elevated inflammatory cytokines LIF and IL1B in high-autophagy 1205Lu secretomes. The cytokine LIF has previously been shown to increase expression of CXCL8 and IL1B, modulating inflammation and cancer progression.Citation26-29 Key components of this subnetwork also included VIM (vimentin) and TIMP2 (TIMP metallopeptidase inhibitor 2), both of which can promote cell motility through cytokine-dependent mechanisms.Citation30,31
illustrates a densely connected subnetwork with the highly centralized QPCT (glutaminyl peptide cyclotransferase) node, which interacts with CTNNBL1 (catenin, β like 1), a key component of the oncogenic WNT signaling pathway.Citation32 The indirect functional connection of QPCT with AKR1B1 (aldo-keto reductase family 1, member B1) via CTNNBL1 highlights the important functional relationship between WNT signaling and inflammation.Citation33 AKR1B1, which exhibited high centrality in our network, forms a direct linkage with ANXA1 (annexin A1), both of which can promote cell proliferation through NFKB (nuclear factor of kappa light polypeptide gene enhancer in B-cells)-dependent inflammatory pathways.Citation34-36 In summary, our network analysis reveals linkages related to oncogenic and cytokine-mediated cell signaling, providing insights into the functional relevance of autophagy-associated secretions in melanoma.
Evaluation of selected differentially secreted proteins as potential autophagy-related biomarkers in melanoma
Commercially available sandwich ELISA assays were used to evaluate top candidate biomarkers. These proteins were selected based on: 1) a minimum 6-fold increase in protein abundance in the 1205Lu secretome relative to the WM793 secretome (Table S1); 2) known involvement of the candidate in autophagic or tumorigenic networks, and 3) availability of high throughput assays for quantification. The 5 proteins that met these criteria were IL1B, CXCL8, LIF, FAM3C, and DKK3. Conditioned media from an independent set of melanoma cell lines with known autophagy levels were used to evaluate the generalizability of linkage to autophagy for these prioritized candidate biomarkers. Basal cellular autophagy was confirmed through LC3 immunoblotting (), which verified that 3 additional cell lines exhibited relatively high autophagy (WM9, WM1361A, and WM1346), and 3 were low autophagy (WM1366, WM164, A375) cell lines. Conditioned media from these high- and low-autophagy cells as well as 1205Lu and WM793 were collected, and candidate biomarker levels were quantitated using ELISA. All 5 candidates showed a statistically significant elevation in media from the high-autophagy cell lines, thereby confirming the results from our proteomics analysis (). Further, the differences in the levels of IL1B, CXCL8, LIF, and FAM3C across low- and high-autophagy cells were on the same order of magnitude when comparing conditioned media derived from 3D cell culture vs. monolayer culture.
Figure 3. Measurement of candidate biomarkers of high autophagy in a panel of high- and low-autophagy melanoma cell lines in monolayer culture. (A) left panel – An exposure from a single LC3 immunoblot of total cell lysates for biological duplicates of WM9, WM1346, WM1361A, WM164, WM1366, and A375 melanoma cell lines; right panel – densitometric quantification of protein gel blots. P values were calculated using ANOVA (*P < 0.05). (B) Sandwich ELISA assays of candidate biomarkers in melanoma cell line conditioned media from cell lines in 2D culture with high (1205Lu, WM9, WM1361A, and WM1346) or low (WM793, WM1366, WM164, A375) basal autophagic flux. Selected candidate biomarkers in conditioned media for 1205Lu and WM793 grown in 3D culture are shown for comparison. P values were calculated using the Welch t test (N = 8; *P < 0.05, **P < 0.01). Error bars represent standard errors.
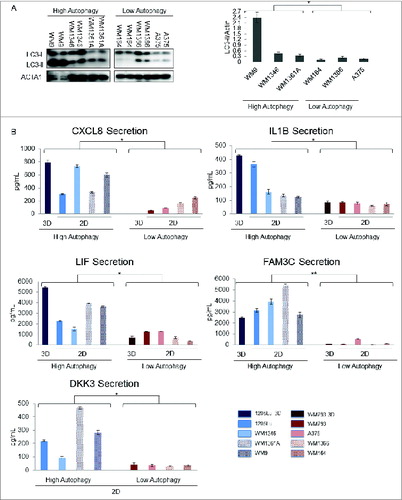
Among these candidates, FAM3C showed the largest and most consistent increase in conditioned media from high-autophagy cells with an average of ∼50-fold elevation. FAM3C is a cytokine that is associated with the epithelial to mesenchymal transition whose localization in the cytoplasm is associated with poor differentiation and prognosis in breast cancer.Citation37
Effects of Tat-BECN1 on WM793 autophagy and secretion of candidate biomarkers
To more directly evaluate the autophagy dependence of candidate biomarker secretion, we treated the low-autophagy WM793 cell line with Tat-BECN1, an autophagy-inducing peptide composed of the HIV-1 Tat protein transduction domain and the amino acid sequence derived from the Nef-interacting domain of BECN1, an essential autophagy protein.Citation38 Tat-Scrambled, a peptide in which the 18 amino acids derived from the BECN1 sequence are randomly shuffled, was included as a control. Previous studies found that Tat-BECN1 induces a complete cellular autophagy response via the canonical autophagy pathway.Citation38 In WM793 cells, Tat-BECN1 treatment using 10 μM for 6 h or 20 μM for 3 h induced a potent autophagy response as indicated by the substantial increase in conversion of LC3-I to LC3-II, compared with parental and control samples ().
Figure 4. Measurement of candidate biomarkers of high autophagy in Tat-BECN1-treated melanoma cells. (A) An exposure from a single immunoblot characterizing LC3 in WM793 cells treated with either Tat-BECN1, Tat-Scrambled, or Opti-HCl (see Materials and Methods) medium only (‘no peptide’) in biological duplicates. Parental refers to untreated cells maintained in RPMI-1640 and 1% FBS and all others contain Opti-HCl. (B) Sandwich ELISA assay results for IL1B, CXCL8, LIF, FAM3C, and DKK3 in conditioned medium of WM793 cells treated with either Tat-BECN1, Tat-Scrambled control, or no peptide. For the 20-μM experiment, after 3 h exposure to the indicated peptide, conditioned media was removed and fresh media without peptide (−) was added for another 3 h (+3). Error bars denote SD, and P values were calculated using the Student t test (N = 3 per treatment group) (*P < 0.05, **P < 0.01).
To determine the effects of targeted autophagy induction via Tat-BECN1 on the secretion of the candidate autophagy biomarkers, ELISA's were performed on conditioned media derived from cells treated without peptide, with Tat-BECN1, and with Tat-Scrambled control peptide (10 μM 6 h and 20 μM 3 h). Treatment with Tat-BECN1 induced a 3- to 4-fold increased rate of secretion vs. control peptide and no peptide treatments in CXCL8, IL1B, and LIF, and up to a 10-fold increase in secretion of DKK3 and FAM3C (). These results strongly support an autophagosome-dependent secretion mechanism for these 5 protein markers.
Effects of ATG7 silencing on WM1346 autophagy and secretion of candidate biomarkers
To further elucidate the role of autophagy in the secretion of our candidate biomarkers, siRNA-induced silencing of ATG7 was performed in WM1346 cells, a cell line derived from a vertical growth phase melanoma and which has a relatively high level of basal autophagic flux (). WM1346 cells were selected as a genetically distinct cell line from those used in the proteomics discovery experiments to evaluate the generalizability of the role of autophagy-driven secretion in melanoma. Using 3 distinct sequences, ATG7 expression was effectively silenced with 20 nM siRNA, and for 2 of the 3 siRNA duplexes, a decrease in LC3-II conversion concomitant with ATG7 knockdown was observed (Fig. S6).
To determine whether ATG7 silencing decreased the secretion of our biomarker candidates, the conditioned media of cells treated with ATG7 siRNA duplexes vs. control and mock transfections were collected and probed for CXCL8, IL1B, LIF, DKK3, and FAM3C using ELISA. With ATG7 silencing, the levels of these proteins decreased significantly relative to controls (), underscoring a mechanistic linkage between autophagy levels and secretion of these proteins.
Figure 5. Measurement of candidate autophagy biomarkers in a high-autophagy melanoma cell line with siRNA-induced ATG7 silencing. Levels of CXCL8, IL1B, LIF, DKK3, and FAM3C were measured by sandwich ELISA in the conditioned media of control- and mock-transfected WM1346 high-autophagy melanoma cells vs. ATG7-silenced cells 96 h post-transfection (72 h to allow for sufficient transfection followed by a media change and another 24-h incubation to collect conditioned medium for biomarker evaluation). Error bars denote SD, and P values were calculated by ANOVA (*P < 0.05, **P < 0.01).
Preliminary clinical evaluation of candidate autophagy biomarkers in melanoma patient serum
The 5 candidate biomarkers were subsequently assessed for potential association with autophagy in a small panel of serum samples derived from therapy-naïve melanoma patients, where autophagy levels in biopsied tumors were measured using quantitative electron microscopy (). Patients whose tumors were found to have a mean number of AV/cell > 6 were categorized as high-autophagy tumors. Immunohistochemical staining for ATG5, an essential autophagy protein, in melanoma tumor tissue illustrated a robust elevation in ATG5 expression in the high-autophagy subset of tumors, consistent with the EM results ().Citation39 The 5 candidate biomarkers were analyzed by sandwich ELISA in serum collected from these patients at the time of biopsy. Consistent with the proteomics and cell line validation analyses described above, these 5 proteins were significantly elevated in the serum from patients with high-autophagy tumors ().
Figure 6. Measurement of autophagy candidate biomarkers in the serum of melanoma patients whose tumors have high or low autophagy. (A) Representative electron micrographs (left panels) and vesicle counts from patients with low- and high-autophagy melanoma tumors (right panel). Red arrows indicate tumor cell autophagic vacuoles. Scale bars = 2 μm. (B) Representative immunohistochemical staining of ATG5 (5X top, 40X bottom) in melanoma tumors from a patient with low and a patient with high tumor autophagy. (C) Measurement of CXCL8, IL1B, LIF, DKK3, and FAM3C by ELISA in serum of melanoma patients with either high or low levels of autophagy. Mean values are indicated by a horizontal line. P values were calculated using the Welch t test (N = 5 per group).
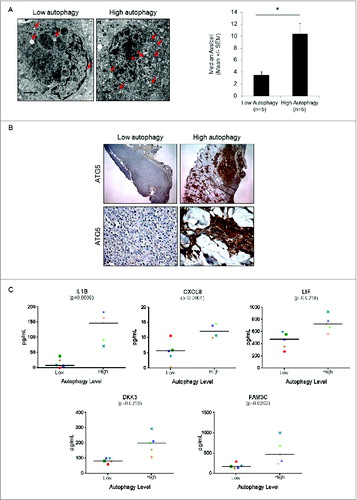
Particularly striking was the ∼fold15- elevation in mean serum level of IL1B in patients with high-autophagy tumors. Interestingly, IL1B has long been known as a protein that is nonclassically secreted via an autophagy-based mechanism.Citation17 The robust difference observed in these serum samples, combined with its well-characterized secretory phenotype, suggests that IL1B may be among the more pivotal markers of therapy resistant melanomas.
Discussion
There has been growing interest in targeting autophagy for cancer therapy. Although autophagy operates at low basal levels to maintain cellular homeostasis in nearly all cells; metabolic, hypoxic, and therapeutic stresses can provoke a series of adaptive responses that amplify autophagic activity in cancer.Citation5 In melanoma, persistently high levels of autophagy in advanced tumors along with enhanced efficacy of chemotherapeutics upon autophagy inhibition suggest that autophagy is a targetable resistance mechanism. However, quantitative measurement tools that can be developed into noninvasive assays that reflect autophagy dynamics within the cancer cell are lacking. Here, we exploited the observations in recent studies that autophagy plays a critical role in the secretion of proinflammatory cytokines, through cooperation of the autophagy machinery with GORASP2/GRASP55 (golgi reassembly stacking protein 2, 55kDa) and RAB8A (RAB8A, member RAS oncogene family).Citation17,40 Furthermore, in studies of oncogene-induced senescence, an augmented secretory phenotype is regulated by autophagy.Citation18 Given this evidence for the role of autophagy in nonclassical protein secretion, we sought to comprehensively analyze melanoma cell secretomes to identify candidate biomarkers that may be linked to tumor cell autophagy levels.
From among all differentially secreted proteins, we selected CXCL8, IL1B, LIF, FAM3C, and DKK3 for the reasons described above. These proteins correlated with autophagy levels in an independent set of melanoma cell lines, confirming the proteomics results. Far more striking and interesting was the significant elevation of these candidate autophagy markers in the sera of patients with melanoma tumors with autophagy levels compared to patients with low tumor autophagy levels, given the innately higher level of complexity in tumor biology and secretion in vivo. While this initial patient sampling is small and further evaluation using additional patients is clearly required, these results strongly suggest that development of a biomarker panel to monitor melanoma tumor autophagy levels is quite feasible. Furthermore, experiments involving Tat-BECN1 and ATG7 silencing indicate that differential secretions observed in both the panel of cell lines and the clinical samples are most likely autophagy dependent.
Inflammatory cytokines are a particularly important subclass of candidate biomarkers in our study. Network analysis indicated strong functional linkages of inflammatory proteins with motility and growth-promotion, emphasizing the importance of cytokine regulation networks in the tumor microenvironment. Furthermore, secretion of oncogenic cytokines has been shown to directly induce autophagy.Citation27 IL1B, CXCL8, LIF, and FAM3C are all cytokines that regulate immune and inflammatory processes, representing 80% of our validated biomarkers. IL1B is a cytokine that promotes inflammation, angiogenesis, and tissue remodeling.Citation41 Cleaved by CASP1 (caspase 1, apoptosis-related cysteine peptidase) to an active form by an NLRP3 (NLR family, pyrin domain containing 3) inflammasome complex, IL1B lacks a signal peptide and is released to the extracellular matrix via autophagosomes.Citation17 While the interplay of autophagy and inflammasome activation remains controversial, dysregulated inflammasome activity can promote carcinogenic inflammation via IL1B secretion.Citation42-44 In particular, late-stage melanoma cells secrete IL1B constitutively via the inflammasome, promoting angiogenesis and invasiveness.Citation41 CXCL8 is a chemokine produced by macrophages and epithelial cells, inducing chemotaxis in target cells and promoting angiogenesis.Citation45 CXCL8 is known to be secreted by melanoma cells and correlates with metastatic potential by upregulating MMP2 (matrix metallopeptidase 2 [gelatinase A, 72kDa gelatinase, 72kDa type IV collagenase]), a candidate biomarker identified in our study and secreted at higher levels in 1205Lu cells.Citation46 CXCL8 secretion increases tumorigenicity and cell proliferation. LIF is a cytokine involved in a number of processes: haematopoietic differentiation, stem cell development, bone metabolism, and growth promotion.Citation47 LIF-producing melanoma is known to result in bone metastasis and subsequent osteclastogenesis, leading to bone tissue degradation.Citation48 Through the activation of JAK-STAT and MAPK signaling, LIF induces the expression of CXCL8 and IL1B; hence, there remains the possibility that LIF upregulates CXCL8 and IL1B for their coordinated secretion through autolysosomes to promote melanoma progression and invasiveness. Finally, FAM3C/ILEI, is a member of a group of secreted proteins with largely unknown function. FAM3C is both necessary and sufficient for epithelial to mesenchymal transition, tumor formation, and metastasis.Citation37,49 Through the upregulation of cytokines, chemokines, growth factor receptors, and cell signaling intermediates, FAM3C can trigger an autocrine growth factor and chemokine loop that is particularly relevant to cancer progression. The robust elevations of these cytokines in melanoma cell conditioned media and patient sera suggest that high basal autophagy plays a critical role in the progression and aggressiveness of malignant melanoma via inflammatory cytokines.
DKK3, a cysteine-rich, N-glycosylated secreted protein of the dickkopf protein family, is the remaining high priority biomarker in this study. DKK3 does not have a clearly defined relationship to cytokine activity or inflammation, but it is implicated in key tumor progression processes. DKK glycoproteins are temporally and spatially regulated to influence cell fate decisions and the epithelial to mesenchymal transition.Citation50-54 DKK3 has also been found to play a role in tumor angiogenesis, through its differentiating effect on tumor-associated endothelial cells.Citation54 Further, higher expression levels of DKK3 have been reported in melanoma, suggesting that secretion of DKK3 in aggressive, high-autophagy melanomas may support in vivo angiogenesis and invasiveness.
Taken together, our panel of candidate biomarkers provides a unique window into how intracellular autophagy can control extracellular processes that impact the tumor microenvironment and increase the malignant potential of cancer cells. Further validation of these candidate biomarkers of autophagy in larger patient subsets is necessary, but this study demonstrates the feasibility of utilizing these biomarkers in a clinical setting. Based on this initial list of candidate biomarkers that performed well in cell line and patient serum validation sets, larger studies are planned to determine the potential of a multiplexed plasma protein based assay to serve as a prognostic, predictive, or pharmacodynamic biomarker panel that could aid cancer therapy decisions in melanoma. For instance, future studies will focus on how well these candidate biomarkers predict response to autophagy inhibitors. A similar approach can be undertaken to characterize autophagy dynamics in other tumors, which are likely to have different but possibly overlapping autophagy-dependent secretome signatures.
Materials and Methods
Cell culture, electron microscopy, and western blot
All melanoma cell lines were maintained in RPMI 1640 (Life Technologies, 11875–085) supplemented with 10% fetal bovine serum (Sigma, F4135), 50 μg/mL gentamicin (Life Technologies, 15750–060), and 25 mmol/L HEPES (Life Technologies, 15630080) in the presence of 5% CO2 at 37°C, unless otherwise noted. All WM melanoma cell lines were established and authenticated in the M. Herlyn laboratory. The A375 (CRL-1619) melanoma cell line was purchased from ATCC. The 3D spheroid cultures were prepared as previously describedCitation1 and cell death was evaluated using the Live/Dead Assay (Life Technologies, L-3224). Electron microscopy was performed as previously described.Citation1 Immunoblotting was performed on whole cell lysates as previously described.Citation1 A commercially available polyclonal antibody against actin (Santa Cruz Biotechnology, sc-1616) was used. A polyclonal antibody made in-house against rat LC3B N terminus was used. Band densities from protein gel blots were quantified using Bio-Rad, Quantity One 1-D gel analysis software (ver. 4.2.0). The image background was subtracted using the "Background Stripe" method and trace quantities (Trace Intensities x mm) of the bands of interest were generated and compared to establish quantitative relationships between the bands.
Conditioned media collection
For optimal depth of secretome protein identification, cell culture medium was changed to 1% fetal calf serum and cells were incubated at 37°C for 24 h immediately prior to collection of the conditioned media. The conditioned medium of each cell line was collected, centrifuged, passed through a 0.22 μm filter, and concentrated fold10- on a 10-kDa MWCO concentration unit (Millipore, UFC901024).
SDS-PAGE, in-gel digestion, and nano LC-MS/MS
Concentrated conditioned media were separated on a 12% NuPage minigel (Life Technologies, NP0343) with MES running buffer (Life Technologies, NP0002) until the tracking dye migrated 20 mm and the gel was stained using colloidal Coomassie (Life Technologies, LC6025). In-gel digestion and LC-MS/MS was performed as described previouslyCitation55 using a FASTA database (human UniRef 100, Ver. May, 2011) downloaded from Protein Information Resource (PIR), Georgetown University, Washington, DC. Raw files were imported and analyzed for label-free quantification in the Rosetta Elucidator software suite, as previously described.Citation56 A minimum protein intensity cut-off of 1×10Citation4 was used to minimize noise from weak mass spectrometry signals as these are typically variable. Derivation of 95% confidence intervals for technical replicate data was performed as previously described.Citation56,57 Briefly, to define significance thresholds, data were normalized using the median of log10 intensity ratio from technical replicate comparisons, and the intensity dependence of protein variation across technical replicates in each cell line was determined using a sliding window approach with protein intensities pooled into groups of 15. The standard deviation trend as a function of the mean intensity was fitted to an exponential curve and the 95% confidence boundaries for each cell line were derived from this curve, with the assumption that each protein follows a log-normal distribution.Citation56 These boundaries were then overlaid on protein intensity scatterplots comparing the interstitial fluid versus the media, whereby outlying proteins represented those which preferentially reside to a given cell culture compartment.
Bioinformatics analysis
Only proteins identified with at least 2 unique peptides were used. Signal intensities of unique peptides were used for protein quantification. For comparison of media and interstitial fluid and combined protein levels, the initial values obtained from the proteome analysis were corrected for the proportion of the initial volumes of media and interstitial fluid recovered and used for analysis. Significance analysis of microarrays was used to select differentially secreted proteins across cell lines, as described previously.Citation22 SAM was implemented in RExcel using a 2-class unpaired d-statistic, 200 permutations, and a k-nearest neighbor imputer for missing values. The false discovery rate (<5 %) was estimated as the ratio of false positives to true positives among proteins called significant using the Δ tuning parameter.
The Software Tool for Rapid Annotation of Proteins (http://www.bumc.bu.edu/cardiovascularproteomics/cpctools/strap/) was used to classify proteins by molecular and biological function and by subcellular localization based on Gene Ontology annotation. Differentially secreted proteins were analyzed for biological pathways through an integrative analysis using Biological Networks version 2.0 (University of California San Diego). Biological Networks is a software suite that enables integrative analysis of interaction networks, signaling pathways, gene regulatory modules, and genomic sequences.Citation58,59 Uniprot accession IDs were uploaded into Biological Networks for database searching and network analysis using the shortest paths algorithm, with minimum probabilities for STRING functional relations (coexpression and cocitation) set to 0.9 (high stringency). Betweenness-centrality clustering was used to identify subnetworks, with a minimum and maximum number of nodes per cluster set to 10 and 20, respectively, and a minimum P value of 0.01.
Quantification of selected candidate biomarkers of autophagy in conditioned media
ELISA kits for CXCL8 (KHC0081), IL1B (KHC0011), LIF (KAC1351) from Life Technologies, FAM3C (MBS905346) from MyBioSource, and DKK3 (RAB0145) from Sigma were used to quantify the target proteins in conditioned media using specimens described below.
Basal autophagy phenotype was evaluated in a panel of melanoma cell lines by LC3 immunoblotting (low – WM1366, WM164, and A375; high – WM9, WM1361A, and WM1346). 1205Lu and WM793 were included to compare results to those obtained in the proteomics analysis. All cell lines in exponential growth phase (seeded at 2 × 10⁵/well in 1 mL) were grown in RPMI-1640 (Life Technologies, 11875–085) supplemented with 10% fetal calf serum (Tissue Culture Biologicals, 101HI). Immunoblotting was performed on whole cell lysates using actin and LC3 antibodies described above.
Tat-BECN1 peptide (735 μM stock solution in 1X phosphate-buffered saline [PBS; Life Technologies, 10010023]), which was synthesized and authenticated in the B. Levine laboratory, was diluted in Opti-MEM (Life Technologies, 31985–062) acidified with 0.15% 6N HCl, as previously described.Citation38 WM793 cells (2 × 10⁵ cells/well in 1 mL) adapted in RPMI 1640/1% fetal calf serum were incubated for either 3 h or 6 h in 10 μM Tat-BECN1 or Tat-Scrambled media and 3 h only in 20 μM Tat-BECN1 or Tat-Scrambled. Cells incubated for 3 h in Opti-HCl (Opti-MEM with 0.15% 6N HCl) with or without Tat-BECN1 or Tat-Scrambled control peptide were returned to RPMI-1640 supplemented with 1% fetal calf serum for 3 h. Conditioned medium was collected for further analysis, and cells were lysed in 1% SDS (Life Technologies, 24730–020)/20 mM Tris (Bio-Rad, 161–0719) (pH 8) for western blot analysis. Immunoblotting was performed on whole cell lysates using antibodies against actin and LC3 described above.
Transfections with siRNA
WM1346 human melanoma cell lines in exponential growth phase were plated at 2 × 10Citation5 cells/well in 1 mL of media for 24 h before transfection. Cells were then transfected with either 20 nM siRNA targeting ATG7 transcripts, 20 nM nontargeting control siRNA (Negative Control siRNA; Qiagen, 1022076), 20 nM positive control siRNA (HS Cell Death Positive Control; Qiagen, SI04381048), or transfection reagent alone. Three ATG7 siRNA duplexes were purchased from Qiagen: siRNA-1, 5′-CAGCATCATCTTCGAAGTGAA-3′ (SI04231360); siRNA-2, 5′-CAAGAGAAAGCTGGTCATCAA-3′ (SI04952339); siRNA-3, 5′- ATCAGTGGATCTAAATCTCAA-3′ (SI05091982). The siRNAs were dissolved in RNase-free water provided by the manufacturer to prepare stock solutions. Transfection complexes were prepared by mixing appropriate volumes of Opti-MEM with siRNA solution and transfection reagent (Lipofectamine RNAiMAX, Life Technologies, 13778–150). Transfection complexes were incubated at 37°C for 16 h, after which cells were returned to normal growth medium. After 72 h, growth medium was replaced and conditioned medium was collected after 24 h. Conditioned medium was probed by sandwich ELISA as described above. Western blotting was performed using a monoclonal anti-ATG7 antibody (Cell Signaling Technology, 8558 S) to confirm silencing.
Lentiviral production and infection
The lentiviral vector pLVO-Puro-mCherry-eGFP-LC3B is a kind gift from Dr. María S. Soengas (CNIO, Spain). 293T cells were cotransfected with packaging and envelope plasmids, pCMV (Addgene, 32530) and pVsvg (Addgene, 31947) along with pLVO-Puro-mCherry-eGFP-LC3B and Lipofectamine 2000 (Invitrogen, 11668027). Supernatant fractions containing lentiviral particles were collected every 24 h for 3 d, pooled, filtered, and then aliquoted. 1205Lu and WM793 melanoma cells were then infected with pLVO-Puro-mCherry-eGFP-LC3B lentivirus overnight supplemented with polybrene (Sigma, AL118) at 8 ug/ml.
Fluorescence microscopy
1205Lu and WM793 melanoma cells expressing mCherry-eGFP-LC3B were selected by fluorescence activated cell sorting (FACS) on a FACS Aria II instrument (BD Biosciences, San Jose, CA, USA). Cells were then grown at 37°C on glass coverslips in DMEM supplemented with 10% FBS. Cells were then fixed in 4% paraformaldehyde (Electron Microscopy Sciences, 30525–89–4) in PBS for 20 min at room temperature. Cells were then rinsed 3 times with PBS and imaged on a NIKON E600 Upright Microscope (Nikon, Melville, NY, USA).
Patient samples
In all cases informed consent on an IRB-approved tissue collection protocol was obtained prior to biopsy or retrieval of archival tumor tissue. In this study, archived sera from patients enrolled on a phase II trial of temozolomide and sorafenib in advanced melanoma were used.Citation60 Both tumor tissue and serum were collected pretreatment. ATG5 immunohistochemistry was conducted using Novus Biologics antibody (NB110–53818). Sandwich ELISA assays, described above, were used to quantitate target proteins in serum. IHC staining was conducted in the laboratory of a melanoma pathologist (Xiaowei Xu, University of Pennsylvania). Scoring was performed using a modified H score. The fields selected for high-powered images (40X) contain few to no stromal cells.
Statistical analysis
The Welch t test was used to compare secretion in high- vs. low-autophagy melanoma cell lines and patient serum. (GraphPad Software, San Diego, CA). All comparisons were performed using a 2-tailed test and P values of <0 .05 were considered significant. ANOVA with Tukey's test was used to compare LC3II/ACTA1 ratios across melanoma cell lines. P-values of <0.05 were considered significant.
Disclosure of Potential Conflicts of Interest
No potential conflicts of interest were disclosed.
Supplemental Materials
Supplemental date for this article can be accessed on the publisher's website.
Supplemental_File.pdf
Download PDF (467.3 KB)Acknowledgments
We would like to acknowledge Frederick Keeney of the Wistar Imaging Facility for his helpful assistance in fluorescence microscopy and the Wistar Proteomics Facility for mass spectrometry.
Funding
This work was funded by the Philadelphia Healthcare Trust Graduate Student Fellowship, and grants from NIH including a T32 Training Grant in Computational Genomics (5T32HG000046–15), 1K23CA120862 (NIH), R01 CA109618 (NIH) and an Institutional Core grant (CA010815).
References
- Ma XH, Piao S, Wang D, McAfee QW, Nathanson KL, Lum JJ, Li LZ, Amaravadi RK. Measurements of tumor cell autophagy predict invasiveness, resistance to chemotherapy, and survival in melanoma. Clin Cancer Res 2011; 17: 3478-89; PMID:21325076; http://dx.doi.org/10.1158/1078-0432.CCR-10-2372
- Levine B, Kromer G. Autophagy in the pathogenesis of disease. Cell 2008; 132: 27-42; PMID:18191218; http://dx.doi.org/10.1016/j.cell.2007.12.018
- Amaravadi RK, Lippincott-Schwartz J, Yin YM, Weiss WA, Takebe N, Timmer W, DiPaola RS, Lotze MT, White E. Principles and current strategies for targeting autophagy for cancer treatment. Clin Cancer Res 2011; 17: 654-66; PMID:21325294; http://dx.doi.org/10.1158/1078-0432.CCR-10-2634
- Rong Y, McPhee CK, Deng S, Huang L, Chen L, Liu M, Tracy K, Baehrecke EH, Yu L, Lenardo MJ. Spinster is required for autophagic lysosome reformation and mTOR reactivation following starvation. Proc Natl Acad Sci USA 2011. 108: 7826-31; PMID:21518918; http://dx.doi.org/10.1073/pnas.1013800108
- Lazova R, Camp RL, Klump V, Siddiqui SF, Amaravadi RK, Pawelek JM. Punctate LC3B expression is a common feature of solid tumors and associated with proliferation, metastasis, and poor outcome. Clin Cancer Res 2012 18: 370-9; PMID:22080440; http://dx.doi.org/10.1158/1078-0432.CCR-11-1282
- Ganesan AK, Ho H, Bodemann B, Petersen S, Aruri J, Koshy S, Richardson Z, Le L Q, Krasieva T, Roth M G, et al. Genome-wide siRNA-based functional genomics of pigmentation identifies novel genes and pathways that impact melanogenesis in human cells. PLoS Genet 2008; 4: e1000298; PMID:19057677; http://dx.doi.org/10.1371/journal.pgen.1000298
- Sosman JA, Kim KB, Schuchter L, Gonzalez R, Pavlick AC, Weber JS, McArthur GA, Hutson TE, Moschos SJ, Flaherty KT, et al. Survival in BRAF V600-mutant advanced melanoma treated with vemurafenib. N Engl J Med 2012; 366: 707-714; PMID:22356324; http://dx.doi.org/10.1056/NEJMoa1112302
- Leone RD, Amaravadi RK. Autophagy: a targetable linchpin of cancer cell metabolism. Trends Endocrinol Metab 2013; 24: 209-17; PMID:23474062; http://dx.doi.org/10.1016/j.tem.2013.01.008
- Barnard RA, Wittenburg LA, Amaravadi RK, Gustafson DL, Thorburn A, Thamm DH. Phase I and pharmacodynamic evaluation of combination hydroxychloroquine and doxorubicin treatment in dogs with spontaneously occurring lymphoma. Autophagy 2014; 10(8): 1415-1425.
- Vogl D T, Stadtmauer EA, Heitjan DF, Tan KS, Rangwala R, Piao S, Chang Y C, Scott EC, Paul TM, Nichols CW, et al. Combined autophagy and proteasome inhibition: Phase I trial of hydroxychloroquine with bortezomib in patients with relapsed refractory multiple myeloma. Autophagy 2014; 10(8): 1380-1390; PMID:24991834; http://dx.doi.org/10.4161/auto.29264
- Mahalingam D, Mita M, Sarantopoulos J, Amaravadi RK, Davis LE, Mita A, Curiel T, Nawrocki ST, Giles FJ, Carew JS. Combined Inhibition of Autophagy and HDAC inhibition: A Phase I Safety, Tolerability, Pharmacokinetic and Pharmacodynamic Analysis of Hydroxychloroquine in Combination with the HDAC Inhibitor Vorinostat in Patients with Advanced Solid Tumors. Autophagy 2014; 10(8): 1403-1414; PMID:24991835; http://dx.doi.org/10.4161/auto.29231
- Rosenfeld MR, Supko JG, Grossman SA, Brem S, Mikkelson T, Wang D, Chang YC, Hu J, McAfee Q, Troxel A, et al. A Phase I/II Trial of Hydroxychloroquine in Conjunction with RadiationTherapy and Concurrent and Adjuvant Temozolomide in Patients with Newly Diagnosed Glioblastoma Multiforme. Autophagy 2014; 10(8): 1359-1368; PMID:24991840; http://dx.doi.org/10.4161/auto.28984
- Rangwala R, Chang YC, Hu J, Algazy K, Evans T, Fecher LA, Schuchter LM, Torigian D, Troxel A, Tan KS, et al. Combined mTOR and autophagy inhibition: Phase I trial of hydroxychloroquine and temsirolimus in patients with advanced solid tumors and melanoma. Autophagy 2014; 10(8): 1391-402.
- Rangwala R, Leone R, Chang C, Fecher LA, Schuchter LM, Kramer A, Tan KS, Hetjian DF, Rodgers G, Gallagher M, et al. Phase I trial of hydroxychloroquine with dose-intense temozolomide in patients with advanced solid tumors and melanoma. Autophagy 2014; 10(8): 1369-79.
- Barth S, Glick D, Macleod KF. Autophagy: assays and artifacts. J Pathol 2010; 221: 117-24; PMID:20225337; http://dx.doi.org/10.1002/path.2694
- Martinet W, De Meyer GRY, Andries L, Herman AG, Kockx MM. In Situ Detection of Starvation-induced Autophagy. J Histochem Cytochem 2006; 54: 85-96; PMID:16148314; http://dx.doi.org/10.1369/jhc.5A6743.2005
- Dupont N, Jiang S, Pilli M, Ornatowski W, Bhattacharya D, Deretic V. Autophagy-based unconventional secretory pathway for extracellular delivery of IL1B. EMBO J 2011; 30: 4701-11; PMID:22068051; http://dx.doi.org/10.1038/emboj.2011.398
- Narita M, Young AR, Arakawa S, Samarajiwa SA, Nakashima T, Yoshida S, Hong S, Berry LS, Reichelt S, Ferreira M, et al. Spatial coupling of mTOR and autophagy augments secretory phenotypes. Science 2011; 332: 966-70; PMID:21512002; http://dx.doi.org/10.1126/science.1205407
- DeSelm CJ, Miller BC, Zou W, Beatty WL, van Meel E, Takahata Y, Klumperman J, Tooze S A, Teitelbaum SL, Virgin HW. Autophagy proteins regulate the secretory component of osteoclastic bone resorption. Dev Cell 2011; 21: 966-74; PMID:22055344; http://dx.doi.org/10.1016/j.devcel.2011.08.016
- Juhasz I, Albelda SM, Elder DE, Murphy GF, Adachi K, Herlyn D, Valyi-Nagy IT, Herlyn M. Growth and Invasion of human melanomas in human skin grafted to immunodeficient mice. Am J Pathol 1993; 143: 528-37; PMID:8342600
- Klionsky DJ, Abdalla FC, Abeliovich H, Abraham RT, Acevedo-Arozena A, Adeli K, Agholme L, Agnello M, Agostinis P, Aguirre-Ghiso JA. Guidelines for the use and interpretation of assays for monitoring autophagy. Autophagy 2012; 8: 445-544; PMID:22966490; http://dx.doi.org/10.4161/auto.19496
- Roxas Q, Li BA. Significance analysis of microarray for relative quantitation of LC/MS data in proteomics. BMC Bioinformatics 2008; 9: 187-203; PMID:18402702; http://dx.doi.org/10.1186/1471-2105-9-187
- Bendtsen JD, Jensen LJ, Blom N, Von Heijne G, Brunak S. Feature-based prediction of non-classical and leaderless protein secretion. Protein Eng Des Sel 2006; 17: 349-56; http://dx.doi.org/10.1093/protein/gzh037
- Dowling P, Clynes M. Conditioned media from cell lines: a complementary model to clinical specimens for the discovery of disease-specific biomarkers. Proteomics 2011; 11: 794-804; PMID:21229588; http://dx.doi.org/10.1002/pmic.201000530
- Bracher A, Cardona AS, Tauber S, Fink AM, Steiner A, Pehamberger H, Niederleithner H, Petzelbauer P, Groger M, Loewe R. Epidermal growth factor facilitates melanoma lymph node metastasis by influencing tumor lymphangiogenesis. J Invest Dermatol 2013; 133: 230-8; PMID:22951723; http://dx.doi.org/10.1038/jid.2012.272
- Villiger PM, Geng Y, Lotz M. Induction of cytokine expression by leukemia inhibitory factor. J Clin Invest 1993; 91: 1575-81; PMID:8473500; http://dx.doi.org/10.1172/JCI116363
- Waugh DJ, Wilson C. The interleukin-8 pathway in cancer. Clin Cancer Res 2008; 14: 6735-41; PMID:18980965; http://dx.doi.org/10.1158/1078-0432.CCR-07-4843
- Harris J. Autophagy and Cytokines. Cytokine 2011; 56: 140-44; PMID:21889357; http://dx.doi.org/10.1016/j.cyto.2011.08.022
- Voronov E, Shouval DS, Krelin Y, Cagnano E, Benharroch D, Iwakura Y, Dinarello CA, Apte RN. IL-1 is required for tumor invasiveness and angiogenesis. Proc Natl Acad Sci USA 2003; 100: 2645-50
- Satelli A, Li S. Vimentin in cancer and its potential as a molecular target for cancer therapy. Cell Mol Life Sci 2011; 68: 3033-46; PMID:21637948; http://dx.doi.org/10.1007/s00018-011-0735-1
- Egea C, Ries V, Karow M, Kolb H, Jochum M, Neth P. MMP-2, MT1-MMP, and TIMP-2 are essential for the invasive capacity of human mesenchymal stem cells: differential regulation by inflammatory cytokines. Blood 2007; 109: 4055-63; PMID:17197427; http://dx.doi.org/10.1182/blood-2006-10-051060
- Kawano Y, Kypta R. Secreted antagonists of the Wnt signaling pathway. J Cell Sci 2003; 116: 2627-2634; PMID:12775774; http://dx.doi.org/10.1242/jcs.00623
- Gustafson B, Smith U. Cytokines promote Wnt signaling and inflammation and impair the normal differentiation and lipid accumulation in 3T3-L1 preadipocytes. J Biol Chem 2006; 281: 9507-16; PMID:16464856; http://dx.doi.org/10.1074/jbc.M512077200
- Laffin B, Petrash JM. Expression of the Aldo-Ketoreductases AKR1B1 and AKR1B10 in Human Cancers. Front Pharmacol 2012; 3: 104; PMID:22685431; http://dx.doi.org/10.3389/fphar.2012.00104
- Ramana KV, Tammali R, Reddy AB, Bhatnagar A, Srivastava SK. Aldose reductase-regulated tumor necrosis factor-alpha production is essential for high glucose-induced vascular smooth muscle cell growth. Endocrinology 2007; 148: 4371-84; PMID:17584970; http://dx.doi.org/10.1210/en.2007-0512
- Zhang Z, Huang L, Zhao W, Rigas B. Annexin 1 induced by anti-inflammatory drugs binds to NF-kappaB and inhibits its activation: anticancer effects in vitro and in vivo. Cancer Res 2010; 70: 2379-88; PMID:20215502; http://dx.doi.org/10.1158/0008-5472.CAN-09-4204
- Waerner T, Alacakaptan M, Tamir I, Oberauer R, Gal A, Brabletz T, Schreiber M, Jechlinger M, Beug H. ILEI: a cytokine essential for EMT, tumor formation, and late events in metastasis in epithelial cells. Cancer Cell 2006; 10: 227-39; PMID:16959614; http://dx.doi.org/10.1016/j.ccr.2006.07.020
- Shoji-Kawata S, Sumpter R, Leveno M, Campbell GR, Zou Z, Kinch L, Wilkins AD, Sun Q, Pallauf K, MacDuff D, et al. Identification of a candidate therapeutic autophagy-inducing peptide. Nature 2013; 494: 201-6; PMID:23364696; http://dx.doi.org/10.1038/nature11866
- Pyo JO, Yoo SM, Ahn HH, Nah J, Hong SH, Kam TI, Jung S, Jung YK. Overexpression of ATG5 in mice activates autophagy and extends lifespan. Nat Commun 2013; 4: 2300; PMID:23939249; http://dx.doi.org/10.1038/ncomms3300
- Manjithaya R, Subramani S. Role of autophagy in unconventional protein secretion. Autophagy 2010; 6: 650-1; PMID:20473033; http://dx.doi.org/10.4161/auto.6.5.12066
- Okamoto M, Liu W, Luo Y, Tanaka A, Cai X, Norris D A, Dinarello CA, Fujita M. Constitutively active inflammasome in human melanoma cells mediating autoinflammation via caspase-1 processing and secretion of interleukin-1beta. J Biol Chem 2010; 285: 6477-88; PMID:20038581; http://dx.doi.org/10.1074/jbc.M109.064907
- Levine B, Mizushima N, Virgin H W. Autophagy in immunity and inflammation. Nature 2011; 469: 323-35; PMID:21248839; http://dx.doi.org/10.1038/nature09782
- Byrne BG, Dubuisson JF, Joshi AD, Persson JJ, Swanson MS. Inflammasome components coordinate autophagy and pyroptosis as macrophage responses to infection. MBio 2013; 4: e00620-12; PMID:23404401; http://dx.doi.org/10.1128/mBio.00620-12
- Zitvogel L, Kepp O, Galluzzi L, Kroemer G. Inflammasomes in carcinogenesis and anticancer immune responses. Nat Immunol 2012; 13: 343-51; PMID:22430787; http://dx.doi.org/10.1038/ni.2224
- Singh RK, Varney ML. Regulation of interleukin 8 expression in human malignant melanoma cells. Cancer Res 1998; 58: 1532-7; PMID:9537260
- Luca M, Huang S, Gershenwald JE, Singh RK, Reich R, Bar-Eli M. Expression of interleukin-8 by human melanoma cells up-regulates MMP-2 activity and increases tumor growth and metastasis. Am J Pathol 1997; 151: 1105-13; PMID:9327744
- Salas EM, Garcia-Barchino MJ, Labiano S, Shugay M, Perez-Encinas M, Quinteiro C, Garcia-Delgado M, Vizmanos JL, Novo FJ. LIF, a Novel STAT5-Regulated Gene, Is Aberrantly Expressed in Myeloproliferative Neoplasms. Genes Cancer 2011; 2: 593-6; PMID:21901172; http://dx.doi.org/10.1177/1947601911420139
- Maruta S, Takiguchi S, Ueyama M, Kataoka Y, Oda Y, Tsuneyoshi M, Iguchi H. A role for leukemia inhibitory factor in melanoma-induced bone metastasis. Clin Exp Metastasis 2009; 26: 133-41; PMID:18953658; http://dx.doi.org/10.1007/s10585-008-9223-x
- Lahsnig C, Mikula M, Petz M, Zulehner G, Schneller D, van FZijl, Huber H, Csiszar A, Beug H, Mikulits W. ILEI requires oncogenic Ras for the epithelial to mesenchymal transition of hepatocytes and liver carcinoma progression. Oncogene 2009; 28: 638-50; PMID:19015638; http://dx.doi.org/10.1038/onc.2008.418
- Yue W, Sun Q, Dacic S, Landreneau RJ, Siegfried JM, Yu J, Zhang L. Downregulation of Dkk3 activates β-catenin/TCF-4 signaling in lung cancer. Carcinogenesis 2007; 29: 84-92; PMID:18048388; http://dx.doi.org/10.1093/carcin/bgm267
- Abarzua F, Sakaguchi M, Takaishi M, Nasu Y, Kurose K, Ebara S, Miyazaki M, Namba M, Kumon H, Huh NH. Adenovirus-mediated overexpression of REIC/Dkk-3 selectively induces apoptosis in human prostate cancer cells through activation of c-Jun-NH2-kinase. Cancer Res 2005; 65: 9617-22; PMID:16266978; http://dx.doi.org/10.1158/0008-5472.CAN-05-0829
- Yang ZR, Dong WG, Lei XF, Liu M, Liu QS. Overexpression of Dickkopf-3 induces apoptosis through mitochondrial pathway in human colon cancer. World J Gastroenterol 2012; 18: 1590-601; PMID:22529687; http://dx.doi.org/10.3748/wjg.v18.i14.1590
- Veeck J, Dahl E. Targeting the Wnt pathway in cancer: the emerging role of Dickkopf-3. Biochim Biophys Acta 2012; 1825: 18-28; PMID:21982838
- Untergasser G, Steurer M, Zimmermann M, Hermann M, Kern J, Amberger A, Gastl G, Gunsilius E. The Dickkopf-homolog 3 is expressed in tumor endothelial cells and supports capillary formation. Int J Cancer 2008; 122: 1539-47; PMID:18033687; http://dx.doi.org/10.1002/ijc.23255
- Beer LA, Tang HY, Sriswasdi S, Barnhart KT, Speicher DW. Systematic discovery of ectopic pregnancy serum biomarkers using 3-D protein profiling coupled with label-free quantitation. J Proteome Res 2011; 10: 1126-38; PMID:21142075; http://dx.doi.org/10.1021/pr1008866
- Pesciotta E N, Sriswasdi S, Tang HY, Mason PJ, Bessler M, Speicher DW. A label-free proteome analysis strategy for identifying quantitative changes in erythrocyte membranes induced by red cell disorders. J Proteomics 2012; 76: 194-202; PMID:22954596; http://dx.doi.org/10.1016/j.jprot.2012.08.010
- auf dem Keller U, Prudova A, Gioia M, Butler GS, Overall CM. A statistics-based platform for quantitative N-terminome analysis and identification of protease cleavage products. Mol Cell Proteomics 2010; 9: 912-27; PMID:20305283; http://dx.doi.org/10.1074/mcp.M000032-MCP201
- Baitaluk M, Sedova M, Ray A, Gupta A. BiologicalNetworks: visualization and analysis tool for systems biology. Nucleic Acids Res 2006; 34: 466-71; http://dx.doi.org/10.1093/nar/gkl308
- Baitaluk M, Kozhenkov S, Dubinina Y, Ponomarenko J. IntegromeDB: an integrated system and biological search engine. BMC Genomics 2012; 13: 35; PMID:22260095; http://dx.doi.org/10.1186/1471-2164-13-35
- Amaravadi RK, Schuchter LM, McDermott DF, Kramer A, Giles L, Gramlich K, Carberry M, Troxel AB, Letrero R, Nathanson KL, et al. Phase II Trial of Temozolomide and Sorafenib in Advanced Melanoma Patients with or without Brain Metastases. Clin Cancer Res 2009; 15: 7711-7718; PMID:19996224; http://dx.doi.org/10.1158/1078-0432.CCR-09-2074