Abstract
DNA methylation is responsible for regulating gene expression and cellular differentiation and for maintaining genomic stability during normal human development. Furthermore, it plays a significant role in the regulation of hematopoiesis. In order to elucidate the influence of DNA methylation during B-cell development, genome-wide DNA methylation status of pro-B, pre-BI, pre-BII, and naïve-B-cells isolated from human umbilical cord blood was determined using the methylated CpG island recovery assay followed by next generation sequencing. On average, 182–200 million sequences were generated for each precursor B-cell subset in 10 biological replicates. An overall decrease in methylation was observed during the transition from pro-B to pre-BI, whereas no differential methylation was observed in the pre-BI to pre-BII transition or in the pre-BII to naïve B-cell transition. Most of the methylated regions were located within intergenic and intronic regions not present in a CpG island context. Putative novel enhancers were identified in these regions that were differentially methylated between pro-B and pre-BI cells. The genome-wide methylation profiles are publically available and may be used to gain a better understanding of the involvement of atypical DNA methylation in the pathogenesis of malignancies associated with precursor B-cells.
Abbreviations
| HCB | = | human umbilical cord blood |
| HSCs | = | haematopoietic stem cells |
| CLP | = | common lymphoid progenitor cells |
| Pro-B | = | progenitor B-cell |
| Pre-B | = | precursor B-cell |
| CD | = | cluster of differentiation |
| ALL | = | acute lymphoblastic leukemia |
| CpG | = | CG dinucleotide |
| CpGI | = | CpG island |
| MIRA-seq | = | methylated CpG island recovery assay (MIRA) followed by next generation sequencing |
| TFs | = | transcription factors |
| MBDs | = | methyl CpG binding domains |
| MeCP2 | = | methyl CpG binding protein 2 |
| DMRs | = | differentially methylated regions |
| ROIs | = | regions of interest |
| H3K4me1 | = | histone H3 lysine 4 monomethylation |
| H3K27ac | = | histone H3 lysine 27 acetylation |
| FDR | = | false discovery rate |
Introduction
B-cell development comprises several developmental stages beginning with pluripotent haematopoietic stem cells (HSCs), followed by common lymphoid progenitor cells (CLP), progenitor-B-cells (pro-B), precursor-B-cells (pre-BI and pre-BII), immature B-cells (naïve B-cells), and, finally, mature B-cells. Each developmental stage has diverse biological features that are regulated by differential gene expression.Citation1,2 Numerous transcription factors (TFs) are known to be responsible for lineage-specific gene regulation.Citation2–4 In addition, regulatory elements, such as enhancers, have been shown to be critical for tissue and developmental stage-specific gene expression.Citation5 However, the identification of enhancers and how they are regulated has not been described in precursor B-cell development.
DNA methylation is an epigenetic modification by which a methyl group is added to a cytosine base at the carbon-5 position in a CpG dinucleotide.Citation6 DNA methylation regulates gene expression by attracting methyl-CpG-binding domain proteins (e.g., MeCP2 and MBDs), which promote chromatin condensation into a transcriptionally repressive conformation.Citation7-9 Tissue specific DNA methylation is responsible for regulating gene expression and cellular differentiation and for maintaining genomic stability during normal human development.Citation10,11 It is well established that DNA methylation plays a role in the regulation of hematopoiesis, including myelopoiesis and lymphopoiesis. For example, DNA methylation is requisite for HSC self-renewal and deficiency of methylation leads to differentiation into myeloerythroid cells.Citation12 On the other hand, an increase in DNA methylation is associated with lymphoid commitment.Citation13 Furthermore, the alteration of tissue specific gene expression by DNA methylation may lead to the progression of many disease states, including cancer.
The major focus of methylation studies has historically been centered around the gains or losses of methylation within the promoter regions of genes and the impact of these modifications on the regulation of gene expression. More recently, studies have highlighted the importance of alternative regulatory regions such as transcriptional enhancers in the regulation of gene expression.Citation14,15 Unlike the ability to identify a promoter based on its proximal location adjacent to a gene, enhancer detection relies on a number of imperfect measures of chromatin regulators, such as histone modifiers in a particular cell type. These important regulatory elements are often found within noncoding regions of the genome, recruit transcriptional coactivators and, like tissue-specific promoters, are responsible for cell type specific gene regulation.
Genome-wide assessment of DNA methylation in both healthy and diseased tissue is critical to understanding the functional consequence of altered DNA methylation. In this study, genome-wide DNA methylation profiles were generated using the methylated CpG island recovery assayCitation16 followed by next generation sequencing (MIRA-seq) for 4 subsets of B-cells that were isolated from human umbilical cord blood (HCB) at different stages in development. The study of methylation profiles in normal cells will aid in elucidating the role of altered DNA methylation in the pathogenesis of acute lymphoblastic leukemia (ALL), a malignancy associated with stage specific precursor B-cells.
Results
Genomic distribution of DNA methylation during B-cell development
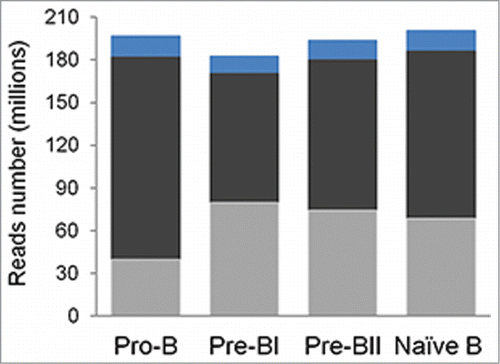
To better understand the role of methylation in early B-cell development, 10 MIRA-seq libraries were constructed each for pro-B, pre-BI, pre-BII, and naïve B-cell subsets isolated from the same individual. A sorting strategy that utilized the level of CD45 expression as a discriminator between pre-BI, pre-BII and naïve B-cellsCitation17 and a stringent gating strategy were employed to ensure that the 4 distinct populations of cells were collected with no overlap.Citation18 On average, 180 million reads were generated for each sample, of which 92% were aligned to the human reference genome. Within each B-cell subset, the coverage was approximately 60x when taken across all biological replicates, resulting in a high-resolution map. After removing duplicates to eliminate the preferential amplification of certain fragments that may be introduced as a result of low amounts of starting material, 40 – 79 million unique reads remained in each subset ( and ).
Table 1. Reads and alignment statistics for individual samples
Figure 1. Average read and alignment statistics. Read and alignment statistics were averaged across all individuals for each precursor B-cell subset. The top of each bar represents the total number of sequencing reads (blue), the total number of mapped reads (dark gray), and the total number of unique reads (light gray).
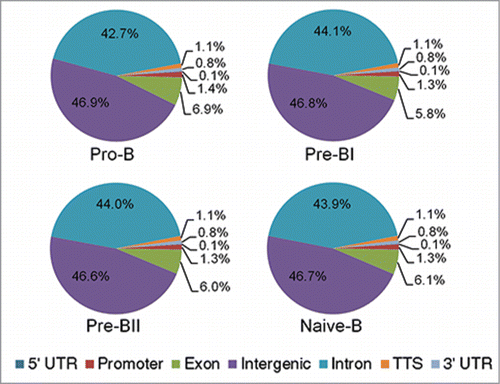
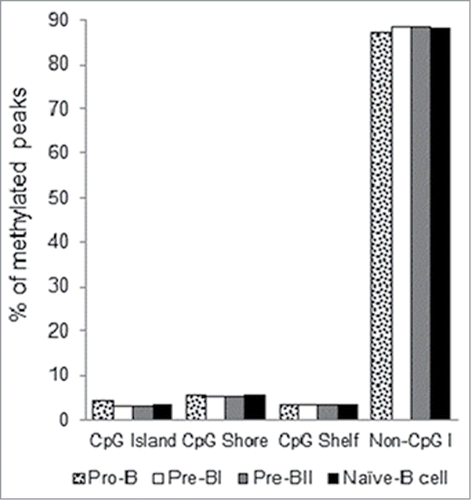
Methylation peaks present in at least 8 of the 10 samples were used to investigate the genome-wide distribution of DNA methylation in each precursor B-cell subset. More than 201,000 peaks were shared across subsets and less than 5% of the peaks were unique to any individual subset. Similar genomic distributions were observed for each subset with an overwhelming majority of the methylation peaks present in intergenic and intronic regions (). Historically, genome-wide methylation assays have focused on the promoters of genes, CpG islands (CGIs), CpG shores, and, more recently, CpG shelves.Citation19,20 Therefore, we also investigated the distribution of methylation peaks within a CGI context. Strikingly, the vast majority of methylation peaks in healthy precursor B-cell subsets do not occur within a CGI context. A total of 3–4% overlapped with a CGI, 5–6% were found within a CpG shore, and 3–4% were found within a CpG shelf ().
Differentially methylated regions in precursor B-cell differentiation
A total of 14,294 hypomethylated and 4,210 hypermethylated DMRs were identified and plotted using CircosCitation21 at an FDR of 5% during the transition from pro-B to pre-BI cells ( and Table S1). The genomic distribution of DMRs differs between the hypomethylated and hypermethylated loci (). More than 95% of the hypomethylated loci lie within intronic and intergenic regions, whereas approximately 80% of the hypermethylated loci are present in intronic or intergenic regions. Quite interestingly, no DMRs were observed between the pre-BI to pre-BII cell transition or between the pre-BII to naïve B-cell transition. This is not surprising considering that these cells are more similar than pro-B-cells, which still possess the stem-like cell surface marker CD34.
Figure 4. Differentially methylated regions in the pro-B to pre-BI transition. Circos plots representing chromosomes 1-22. The X and Y chromosomes were excluded from analysis. A total of 4,210 loci gained methylation (hypermethylated in pre-BI) and 14,294 loci lost methylation (hypomethylated in pre-BI). Blue represents hypomethylated regions in pre-BI cells and yellow represents hypermethylated regions in pre-BI cells.
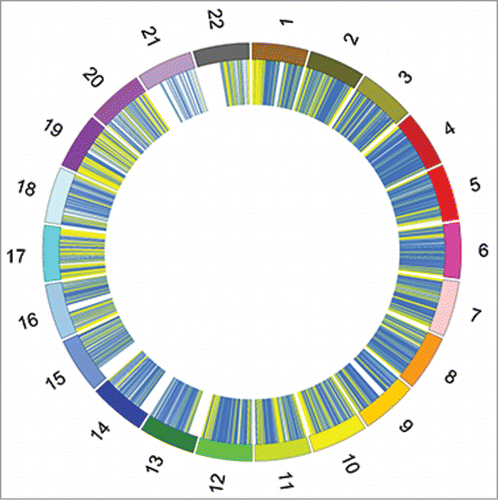
Figure 5. Genomic distribution of hypomethylated and hypermethylated loci during the pro-B to pre-BI transition.
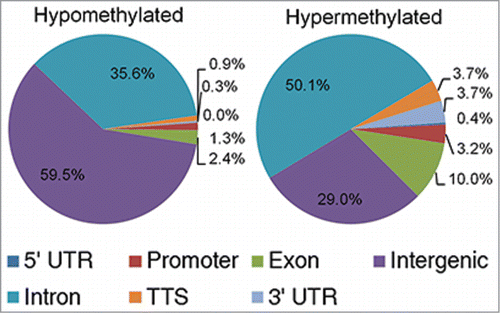
In the pre-BI cells, ∼1% of the hypomethylated DMRs and ∼3% of the hypermethylated DMRs were found within a gene promoter (). To gain insight into the potential biological consequence of the loss or gain of promoter methylation in pre-BI cells we performed functional annotation of promoter DMRs using the Database for Annotation, Visualization and Integrated Discovery (DAVID) v6.7.Citation22 No gene sets or functional groups were significantly enriched in promoter DMRs. Therefore, we sought to identify potential functional DMRs present in intergenic and intronic regions. We first identified enhancer related histone marks in the lymphoblastoid cell line GM12878, a surrogate for precursor B-cells. The location of the histone marks representing potential poised and active enhancers (H3K4me1 and H3K27ac) were then superimposed on the intergenic and intronic DMRs.Citation5,Citation23-25 A total of 467 potential enhancer-like DMRs were identified that possessed H3K4me1 and H3K27ac: 197 were hypomethylated and 270 were hypermethylated in pre-BI cells compared to pro-B-cells (Table S2 and S3). To examine the possible impact of differentially methylated enhancer-like regions, a list of target genes for each DMR was generated from the nearest upstream and downstream gene. More than 200 putative target genes were identified in the hypomethylated DMRs and 396 were identified in the hypermethylated DMRs. Consistent with the differentially methylated promoter loci, no gene sets or functional groups were enriched in the enhancer associated DMRs. However, the enhancer-like DMRs contained genes involved in the regulation of leukocyte activation and the B-cell receptor (BCR) signaling pathway. Specifically, the enhancer regions of genes implicated in lymphocyte differentiation (EGR1, FOXP1 and KLF6) and in the BCR signaling pathway (CARD11, LILRB3 and CD81) gained methylation during the transition from pro-B to pre-BI cells. In contrast, the BCR signaling pathway genes VAV3, GRB2, PPP3CA, and NFATC1 lost methylation during the transition from pro-B to pre-B-cells (). Therefore, it is reasonable to infer that the regulation of these genes during B-cell differentiation is affected by the presence or absence of methylation in cell-type specific enhancers.
Table 2. Differentially methylated enhancer target genes involved in leukocyte activation and BCR signaling pathway
It has previously been shown that DNA methylation decreases during cellular differentiation of myeloid cells,Citation26,27 but increases when comparing early progenitor cells to fully differentiated lymphoid cells.Citation13,20 In order to visualize the changes in methylation as precursor B-cells differentiate, the average level of methylation at DMR loci was examined across each subset. Two prominent patterns arose, each beginning with a decrease in methylation between the pro-B and pre-BI stage followed by: 1) a steady state of methylation being observed in subsequent stages; or 2) a slight increase in methylation in subsequent stages. The second pattern observed in our data helps elucidate when the increase in methylation begins to occur in lymphoid differentiation.
Discussion
Epigenetic modifications are well known to play important roles in disease. In order to better understand and identify aberrant, disease-associated epigenetic events, it is imperative to create epigenomic data sets for all normal tissue types. The ENCODE consortia set out to define the functional elements in the human genome including epigenetic marks such as histone modifications and DNA methylation. This effort has produced genome-scale epigenetic data sets for multiple cell types but does not include every cell type. Precursor B-cell ALL is the most common malignancy seen in children and also affects adults. Precursor B-cells are present at a low frequency in pediatric bone marrow and at even lower frequencies in adult bone marrow. In order to generate DNA methylation profiles in precursor B-cells we obtained umbilical cord blood from healthy donors, which is rich in precursor B-cells and more easily attainable than bone marrow from healthy children. For the first time, we provide whole-genome DNA methylation profiles for 4 subsets of B-cells derived from umbilical cord blood.
In this study, MIRA-seq followed by next generation sequencing was used to examine genome-wide DNA methylation during the development of B-cells. Caldwell and colleagues have shown that CD19+-cells that express high levels of CD45 correspond to naïve B-cells, which express surface IgM; CD19+-cells that express intermediate levels of CD45 correspond to pre-BII cells, which express cytoplasmic IgM; and CD19+-cells that express low levels of CD45 correspond to pre-BI cells. which do not express cytoplasmic IgM.Citation17 Therefore, we isolated 4 subsets of precursor B-cells: 1) pro-B (CD34+/CD19+); 2) pre-BI (CD34−/CD19+/CD45low); 3) pre-BII (CD34−/CD19+/CD45med); and 4) naïve B-cell (CD34−/CD19+/CD45high).Citation18 DMRs were identified to determine the dynamic range of DNA methylation as B-cells differentiate. Many DMRs lost methylation during the transition from pro-B to pre-BI cells, consistent with a previous study.Citation27 In addition, more than 4,000 regions were identified that gained methylation during the transition from pro-B to pre-BI cells. Contrary to the findings of Lee and colleagues,Citation27 we observed no DMRs at a 5% FDR during the pre-BI to pre-BII transition or during the pre-BII to naïve B-cell transition, indicating that methylation levels remain unchanged during this period. This can be explained by the fact that MIRA-seq identifies genomic regions that are methylated, whereas the Infinium array utilized by Lee and colleagues surveys individual CpG sites. Our results suggest that any of these subsets (pre-BI, pre-BII, naïve-B) could serve as an appropriate “control” cell population in studies aimed at identifying differential methylation in diseases of precursor B-cells, such as ALL. It is interesting to note that many precursor B-ALL patients retain (or gain) the stem-like cell surface marker CD34, calling into question whether the cells are more related to pre-B or pro-B-cells.
MIRA-seq has the advantage of being able to distinguish the methylated DNA in all regions of the genome and the slight disadvantage that the precise location of the methylation cannot be distinguished. The vast majority of methylated regions in normal precursor B-cells were present in intergenic and intronic loci. Perhaps these loci are important in maintaining genomic stability;Citation19 however, it is equally plausible that these regions harbor important regulatory sequences, such as enhancers, that are affected by methylation.Citation23,28 In fact, more than 450 putative enhancer-like DMRs were identified in pre-BI cells compared to pro-B-cells indicating cell-type specific gene regulation. Putative targets of the enhancer-like DMRs play fundamental roles in lymphopoiesis and BCR signaling, and included the genes FOXP1, KLF6, CARD11, LILRB3, CD81, VAV3, GRB2, PPP3CA, and NFATC1. When other regulatory DMRs were considered, none of the promoters associated with genes involved in B-cell differentiation were differentially methylated. Therefore, intergenic and intronic regulatory regions may be the driving force in B-cell differentiation.
In summary, we provide genome-wide DNA methylation profile at 4 stages of B-cell development. We report for the first time hypermethylated loci associated with the transition of pro-B to pre-BI cells. The majority of the differentially methylated regions identified lie within intronic and intergenic regions and some of these regions overlap with putative regulatory regions. This study supports the use of umbilical cord blood as a source for precursor B-cells and establishes a baseline methylation profile for precursor B-cell subsets. It is likely that the DMRs identified in regulatory regions will be important in identifying the mechanisms responsible for the dysregulation of gene expression associated with precursor B-cell disorders such as ALL.
Materials and Methods
Isolation of precursor B-cell subsets
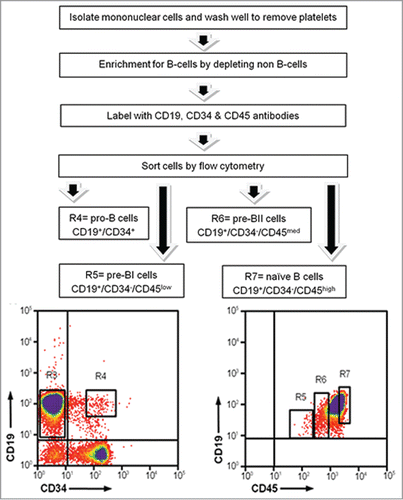
The cell sorting strategy developed by Caldwell and colleaguesCitation17 was employed to isolate 4 subsets of precursor B-cells from 10 HCB samples from healthy individuals provided by the St. Louis Cord Blood Bank, as previously described.Citation18 Briefly, mononuclear cells were separated by density centrifugation using Ficoll-Paque PLUS (GE Healthcare Bio-Sciences AB; cat. no. 17-1440-03). Next, non B-cells were depleted from the mononuclear cells using a cocktail of biotin-conjugated monoclonal antibodies and anti-biotin monoclonal antibodies conjugated to magnetic beads with the human B-cell Isolation Kit (MACS Miltenyi Biotec; cat. no. 130-093-660). Unlabeled B-cells that passed through the column were then fluorescently labeled with antibodies against cell surface antigens (CD19, CD34, and CD45) specific to individual stages of B-cell development. Finally, 4 subsets of fluorescently labeled cells were sorted and recovered in individual tubes as pro-B (CD34+/CD19+), pre-BI (CD34−/CD19+/CD45low), pre-BII (CD34−/CD19+/CD45med), and naïve (CD34−/CD19+/CD45high) B-cells ().
Figure 6. Isolation of precursor B-cell subsets from human umbilical cord blood. Mononuclear cells were isolated using density gradient centrifugation to remove all non B-cells. B-cells were labeled with cell surface antibodies and sorted into 4 separate tubes. R4: pro-B-cells; R5: pre-BI cells; R6: pre-BII cells; R7: naïve B-cells.
DNA isolation and MIRA-seq library preparation
Genomic DNA was isolated from each precursor B-cell subset immediately after flow sorting with the QIAamp® DNA Micro Kit (Qiagen; cat. no. 56304) according to manufacturer's instructions, and eluted in 30 μl of nuclease free distilled water. Due to the low number of pro-B-cells isolated from HCB samples, approximately 100 ng of DNA was recovered. Therefore, library construction for each of the 4 subsets was performed using a starting amount of 100 ng of DNA. The DNA was sonicated to generate 200- to 600-bp fragments using the Bioruptor® standard (Diagenode; cat. no. B01010002) at 4°C. Sonication was performed using the high power setting with alternating 30 s on/off intervals for a total of 9 minutes. After 5 min, ice was added to the water bath to keep the samples cool. Sonicated DNA fragments were purified and concentrated using the MinElute PCR purification kit (Qiagen; cat. no. 28004). The purified fragments were electrophoresed on a 1% agarose gel at 96 volts for 45 min for size selection. DNA bands between 200 bp and 600 bp were excised and then extracted using the MinElute Gel Extraction kit (Qiagen; cat no. 28604) according to manufacturer's instructions.
The NEBNext® DNA Library Prep Master Mix Set for Illumina kit (New England BioLabs; cat. no. E6040S) was utilized for library construction according to manufacturer's instructions with modifications. Briefly, end repair and dA tailing was performed with purification after each step using Agencourt® AMPure® XP Beads (Beckman Coulter; cat. no. A63881). NEBNext Adaptors (New England BioLabs; cat. no. E7335S) were ligated to the repaired DNA and purified using 1.0X AMPure XP beads. After adaptor ligation, MIRA was performed for the enrichment of methylated DNA using the Methyl Collector™ Ultra kit (Active Motif; cat. no. 55005) which utilizes a His-MBD2b/MBD3L1 protein complex to bind methylated DNA fragments. PCR enrichment of recovered methylated DNA fragments was then performed using reagents from NEBNext® DNA Library Prep Master Mix Set for Illumina with multiplex oligos for 16 cycles. PCR products were purified using Agencourt® AMPure® XP Beads (Beckman Coulter; cat. no. A63881). To validate the enrichment of methylated DNA, end point PCR amplification was performed for SLC25A37, a gene that should be methylated and therefore present in the methylation enriched sample, and APC1, a gene that should be unmethylated and therefore depleted in the methylation enriched sample. The forward primer 5′-GGTGGCTCCCACTTTAAGAA-3′ and reverse primer 5′-ATCTCGGCTGTCCCCAT-3′ were used for SLC25A37 (annealing temperature 58°C; amplicon size 158 bp), and the forward primer 5′-ACTGCCATCAACTTCCTTGC-3′ and reverse primer 5′-GCGGATTACACAGCTGCTTC C-3′ were used for APC1 (annealing temperature 56°C; amplicon size 162 bp). Fragment analysis for each validated library was performed prior to sequencing. Four quality-tested MIRA-seq libraries were multiplexed in either 2 nM or 10 nM concentrations and sequenced on the HiSeq 2000 (1 × 100 bp reads) at the University of Missouri DNA Core Facility.
Data processing, alignment, and peak identification
Adaptor sequences were trimmed from reads and subsequent short reads were discarded using cutadapt 1.2.1.Citation29 Reads were then aligned to the human reference sequence (GRCh37 with SNP135 masked) with bowtie2 (version 2.1.0)Citation30 using default parameters. Aligned files were then converted to BAM files and sorted by coordinate using SAMtools (version 0.1.19-44428cd)Citation31 “view” and “sort,” respectively. Duplicate reads were removed from the BAM files using Picard-tools (version 1.92) “MarkDuplicates” with default parameters. The resulting BAM files were indexed with SAMtools “index.” Peaks were identified using MACS2 (version 2.0.10.20130712)Citation32 “callpeak” with default parameters. In order to standardize peak calls between samples, one file with all of the peak calls from each sample was created, sorted, and then merged with bedtools (version 2.17.0)Citation33 “mergeBed” to create a file of unified peaks. Samples were assigned a peak if their own peak overlapped with the unified peaks. Peak results are available as “Custom annotation tracks” for download and viewing in the UCSC genome browser (http://genome.ucsc.edu/cgi-bin/hgTracks?hgS_doOtherUser=submitandhgS_otherUserName=taylorkhandhgS_otherUserSessionName=MIRAseq).
Annotation and enhancer prediction
Methylated peaks were annotated with HOMER (Hypergeometric Optimization of Motif EnRichment), version 4.3, using the Perl script “annotatePeaks.pl” with default parameters to identify their genomic location.Citation34 The X and Y chromosomes were excluded from the analysis because the genders of the individual cord blood samples were unknown. Genome-wide CpG island positional information from the UCSC table browser was used to identify the position of methylation peaks within a CpG island context. In order to predict enhancer-like regions, publically available ChIP-seq data for histone modifications (H3K4me1 and H3K27ac) in the lymphoblastoid cell line (GM12878) were obtained from the ENCODE Data Coordination Center at UCSC. The GM12878 cell line is derived from peripheral blood B-cells and is the most closely related cell type to precursor B-cells with publically available histone data.
Differentially methylated regions of interest
Differentially methylated regions (DMRs) between the various stages of B-cell development were identified using the same computational methodology proposed by Chavez and colleagues.Citation35 A saturation analysis was first performed on each preprocessed and aligned sample (BAM file) to ensure sufficient coverage depth (and therefore reproducibility): any sample with insufficient depth (based on saturation correlation <0.90) was excluded from further analyses. Following this additional quality control check, the data were normalized using a CpG coupling factor–based method. This approach is built on the theory of coupling factorsCitation36 and is implemented using a mixture model that takes into consideration the distribution of CpGs in the reference genome. Identification of DMRs was based on the normalized data, and the aforementioned approach does not necessarily require an input (‘control’) sample to be sequenced. Read counts were binned using 100 bp windows with 300 bp overlaps (based on an expected fragment size of 400 bp). This resulted in approximately 3 million windows, which we term ‘regions of interest’ (ROIs). ROIs with modest signal representation were excluded (i.e., mean across all samples being compared <20 counts), which is akin to traditional non-specific filtering. This filtering approach is independent of the test statistic so as not to introduce bias,Citation37 while increasing power and reducing false discoveries. In the remaining ROIs, testing for differential methylation was performed using the edgeR package called via the MEDIPS package in R/Bioconductor. The ROIs with a false discovery rate (FDR; based on Benjamini-Hochberg approach) <5% were extracted and these regions were merged if immediately adjacent (distance between bp = 1) to other ROIs meeting this criteria. Hyper- and hypo-methylated ROIs were merged separately so that only putatively consistent ROIs were combined. The reported log fold change for merged ROIs is the maximum (hypermethylated) or minimum (hypomethylated) log fold change for any of its constituent ROIs. It should be noted that the DMR approach is not a peak-based approached, so the aforementioned peak identification and annotation work serves a complimentary role and does not involve identification of DMRs.
Disclosure of Potential Conflicts of Interest
No potential conflicts of interest were disclosed.
Supplementary_Tables_2and3.xlsx
Download MS Excel (33 KB)Supplementary_Table_Legend.docx
Download MS Word (12.7 KB)Supplementary_Table_1.xlsx
Download MS Excel (1.8 MB)Acknowledgments
We kindly thank Ambima Buzhyason for generating .
Funding
This work was supported by the National Institutes of Health NCI R00 CA132784 (K.H. Taylor).
References
- Hystad ME, Myklebust JH, Bø TH, Sivertsen EA, Rian E, Forfang L, Munthe E, Rosenwald A, Chiorazzi M, Jonassen I, et al. Characterization of early stages of human B cell development by gene expression profiling. J Immunol 2007; 179(6):3662-71; PMID:17785802; http://dx.doi.org/10.4049/jimmunol.179.6.3662.
- van Zelm MC, van der Burg M, de Ridder D, Barendregt BH, de Haas EF, Reinders MJ, Lankester AC, Révész T, Staal FJ, van Dongen JJ. Ig gene rearrangement steps are initiated in early human precursor B cell subsets and correlate with specific transcription factor expression. J Immunol 2005; 175(9):5912-22; PMID:16237084; http://dx.doi.org/10.4049/jimmunol.175.9.5912.
- Pérez-Vera P, Reyes-León A, Fuentes-Pananá EM. Signaling proteins and transcription factors in normal and malignant early B cell development. Bone Marrow Res 2011; 2011:502751; http://dx.doi.org/10.1155/2011/502751.
- Matthias P, Rolink AG. Transcriptional networks in developing and mature B cells. Nat Rev Immunol 2005; 5(6):497-508; PMID:15928681; http://dx.doi.org/10.1038/nri1633.
- Harmston N, Lenhard B. Chromatin and epigenetic features of long-range gene regulation. Nucleic Acids Res 2013; 41(15):7185-99; PMID:23766291; http://dx.doi.org/10.1093/nar/gkt499.
- Razin A, Riggs AD. DNA methylation and gene function. Science 1980; 210(4470):604-610; PMID:6254144; http://dx.doi.org/10.1126/science.6254144.
- Berger LS. The complex language of chromatin regulation during transcription. Nature 2007; 447:407-412; PMID:17522673; http://dx.doi.org/10.1038/nature05915.
- Newell-Price J, Clark AJL, King P. DNA Methylation and Silencing of Gene Expression. Trends Endocrinol Metab 2000; 11(4):142-148; PMID:10754536; http://dx.doi.org/10.1016/S1043-2760(00)00248-4.
- Bird A. The Essentials of DNA Methylation. Cell 1992; 70:5-8; PMID:1377983; http://dx.doi.org/10.1016/0092-8674(92)90526-I.
- Ohgane J, Yagi S, Shiota K. Epigenetics: the DNA methylation profile of tissue-dependent and differentially methylated regions in cells. Placenta 2008; 29 Suppl A:S29-35; PMID:18031808; http://dx.doi.org/10.1016/j.placenta.2007.09.011.
- Song F, Smith JF, Kimura MT, Morrow AD, Matsuyama T, Nagase H, Held WA. Association of tissue-specific differentially methylated regions (TDMs) with differential gene expression. Proc Natl Acad Sci U S A 2005; 102(9):3336-41; PMID:15728362; http://dx.doi.org/10.1073/pnas.0408436102.
- Bröske AM, Vockentanz L, Kharazi S, Huska MR, Mancini E, Scheller M, Kuhl C, Enns A, Prinz M, Jaenisch R, et al. DNA methylation protects hematopoietic stem cell multipotency from myeloerythroid restriction. Nat Genet 2009; 41(11):1207-15; PMID:19801979; http://dx.doi.org/10.1038/ng.463.
- Hodges E, Molaro A, Dos Santos CO, Thekkat P, Song Q, Uren PJ, Park J, Butler J, Rafii S, McCombie WR, et al. Directional DNA methylation changes and complex intermediate states accompany lineage specificity in the adult hematopoietic compartment. Mol Cell 2011; 44(1):17-28; PMID:21924933; http://dx.doi.org/10.1016/j.molcel.2011.08.026.
- Zhang B, Zhou Y, Lin N, Lowdon RF, Hong C, Nagarajan RP, et al. Functional DNA methylation differences between tissues, cell types, and across individuals discovered using the M&M algorithm. Genome Res 2013; 23(9):1522-40; PMID:23804400; http://dx.doi.org/10.1101/gr.156539.113.
- Aran D, Sabato S, Hellman A. DNA methylation of distal regulatory sites characterizes dysregulation of cancer genes. Genome Biol 2013; 14(3):R21; PMID:23497655; http://dx.doi.org/10.1186/gb-2013-14-3-r21.
- Rauch T, Pfeifer GP. Methylated-CpG island recovery assay: a new technique for the rapid detection of methylated-CpG islands in cancer. Lab Invest 2005; 85(9):1172-8; PMID:16025148; http://dx.doi.org/10.1038/labinvest.3700311.
- Caldwell CW, Poje E, Helikson MA. B-cell precursors in normal pediatric bone marrow. Am J Clin Pathol 1991; 95(6):816-823; PMID:2042591.
- Almamun M, Schnabel JL, Gater ST, Ning J, Taylor KH. Isolation of precursor B-cell subsets from umbilical cord blood. J Vis Exp 2013; 74; http://dx.doi.org/10.3791/50402 .
- Jones PA. Functions of DNA methylation: islands, start sites, gene bodies and beyond. Nat Rev Genet 2012; 13:484-492; PMID:22641018; http://dx.doi.org/10.1038/nrg3230.
- Ji H, Ehrlich LI, Seita J, Murakami P, Doi A, Lindau P, Lee H, Aryee MJ, Irizarry RA, Kim K, et al. Comprehensive methylome map of lineage commitment from haematopoietic progenitors. Nature 2010; 467(7313):338-42; PMID:20720541; http://dx.doi.org/10.1038/nature09367.
- Krzywinski M, Schein J, Birol I, Connors J, Gascoyne R, Horsman D, Jones SJ, Marra MA. Circos: An information aesthetic for comparative genomics. Genome Res 2009; 19:1639-1645; PMID:19541911; http://dx.doi.org/10.1101/gr.092759.109.
- Huang DW, Sherman BT, Lempicki RA. Systematic and integrative analysis of large gene lists using DAVID Bioinformatics Resources. Nature Protoc 2009; 4(1):44-57; http://dx.doi.org/10.1038/nprot.2008.211.
- Bulger M, Groudine M. Functional and mechanistic diversity of distal transcription enhancers. Cell 2011; 144(3):327-39; PMID:21295696; http://dx.doi.org/10.1016/j.cell.2011.01.024.
- Xu J, Shao Z, Glass K, Bauer DE, Pinello L, Van Handel B, Hou S, Stamatoyannopoulos JA, Mikkola HK, Yuan GC, et al. Combinatorial assembly of developmental stage specific enhancers control gene expression programs during human erythropoiesis. Dev Cell 2012; 23:796-811; PMID:23041383; http://dx.doi.org/10.1016/j.devcel.2012.09.003.
- Bogdanovic O, Fernandez-Miñán A, Tena JJ, de la Calle-Mustienes E, Hidalgo C, van Kruysbergen I, van Heeringen SJ, Veenstra GJ, Gómez-Skarmeta JL. Dynamics of enhancer chromatin signatures mark the transition from pluripotency to cell specification during embryogenesis. Genome Res 2012; 22(10):2043-53; PMID:22593555; http://dx.doi.org/10.1101/gr.134833.111.
- Hogart A, Lichtenberg J, Ajay SS, Anderson S. NIH Intramural Sequencing Center, Margulies EH, Bodine DM. Genome-wide DNA methylation profiles in hematopoietic stem and progenitor cells reveal overrepresentation of ETS transcription factor binding sites. Genome Res 2012; 22(8):1407-18; PMID:22684279; http://dx.doi.org/10.1101/gr.132878.111.
- Lee ST, Xiao Y, Muench MO, Xiao J, Fomin ME, Wiencke JK, Zheng S, Dou X, de Smith A, Chokkalingam A, et al. A global DNA methylation and gene expression analysis of early human B-cell development reveals a demethylation signature and transcription factor network. Nucleic Acids Res 2012; 40(22):11339-51; PMID:23074194; http://dx.doi.org/10.1093/nar/gks957.
- Shore A, Karamitri A, Kemp P, Speakman JR, Lomax MA. Role of Ucp1 enhancer methylation and chromatin remodelling in the control of Ucp1 expression in murine adipose tissue. Diabetologia 2010; 53(6):1164-73; PMID:20238096; http://dx.doi.org/10.1007/s00125-010-1701-4.
- Martin M. Cutadapt removes adapter sequences from high-throughput sequencing reads. EMBnet.journal 2011; 17:10-12; http://dx.doi.org/10.14806/ej.17.1.200.
- Langmead B, Salzberg S. Fast gapped-read alignment with Bowtie 2. Nature Methods 2012; 9:357-359; PMID:22388286; http://dx.doi.org/10.1038/nmeth.1923.
- Li H*, Handsaker B*, Wysoker A, Fennell T, Ruan J, Homer N, Marth G, Abecasis G, Durbin R. and 1000 Genome Project Data Processing Subgroup (2009) The Sequence alignment/map (SAM) format and SAMtools. Bioinformatics 2009; 25:2078-9; PMID:19505943; http://dx.doi.org/10.1093/bioinf-ormatics/btp352.
- Zhang Y, Liu T, Meyer CA, Eeckhoute J, Johnson DS, Bernstein BE, Nusbaum C, Myers RM, Brown M, Li W, et al. Model-based analysis of ChIP-Seq (MACS). Genome Biol. 2008; 9(9):R137; http://dx.doi.org/10.1186/gb-2008-9-9-r137.
- Quinlan A, Hall I. BEDTools: a flexible suite of utilities for comparing genomic features. Bioinformatics 2010; 26(6): 841-842; PMID:20110278; http://dx.doi.org/10.1093/bioinformatics/btq033.
- Heinz S, Benner C, Spann N, Bertolino E, Lin YC, Laslo P, Cheng JX, Murre C, Singh H, Glass CK. Simple combinations of lineage-determining transcription factors prime cis-regulatory elements required for macrophage and B cell identities. Mol Cell 2010; 38(4):576-589; PMID:20513432; http://dx.doi.org/10.1016/j.molcel.2010.05.004.
- Chavez L, Jozefczuk J, Grimm C, Dietrich J, Timmermann B, Lehrach H, Herwig R, Adjaye J. Computational analysis of genome-wide DNA methylation during the differentiation of human embryonic stem cells along the endodermal lineage. Genome Res. 2010; 20(10):1441-50; PMID:20802089; http://dx.doi.org/10.1101/gr.110114.110.
- Down TA, Rakyan VK, Turner DJ, Flicek P, Li H, Kulesha E, Gräf S, Johnson N, Herrero J, Tomazou EM, et al. A Bayesian deconvolution strategy for immunoprecipitation-based DNA methylome analysis. Nat Biotechnol 2008; 26:779-85; PMID:18612301; http://dx.doi.org/10.1038/nbt1414.
- Bourgon R, Gentleman R, Huber W. Independent filtering increases detection power for high-throughput experiments. Proc Natl Acad Sci U S A 2010; 107:9546-51; PMID:20460310; http://dx.doi.org/10.1073/pnas.0914005107.

