
Abstract
Altered expression and activity of histone deacetylases (HDACs) have been correlated with tumorigenesis. Inhibitors of HDACs (HDACi) induce acetylation of histone and non-histone proteins affecting gene expression, cell cycle progression, cell migration, terminal differentiation and cell death. Here, we analyzed the regulation of ARHGEF3, a RhoA-specific guanine nucleotide exchange factor, by the HDACi MS275 (entinostat). MS275 is a well-known benzamide-based HDACi, which induces differentiation of the monoblastic-like human histiocytic lymphoma cell line U937 to monocytes/macrophages. Incubation of U937 cells with MS275 resulted in an up regulation of ARHGEF3, followed by a significant enhancement of the marker of macrophage differentiation CD68. ARHGEF3 protein is primarily nuclear, but MS275 treatment rapidly induced its translocation into the cytoplasm. ARHGEF3 cytoplasmic localization is associated with activation of the RhoA/Rho-associated Kinase (ROCK) pathway. In addition to cytoskeletal rearrangements orchestrated by RhoA, we showed that ARHGEF3/RhoA-dependent signals involve activation of SAPK/JNK and then Elk1 transcription factor. Importantly, MS275-induced CD68 expression was blocked by exposure of U937 cells to exoenzyme C3 transferase and Y27632, inhibitors of Rho and ROCK respectively. Moreover, ARHGEF3 silencing prevented RhoA activation leading to a reduction in SAPK/JNK phosphorylation, Elk1 activation and CD68 expression, suggesting a crucial role for ARHGEF3 in myeloid differentiation. Taken together, our results demonstrate that ARHGEF3 modulates acute myeloid leukemia differentiation through activation of RhoA and pathways directly controlled by small GTPase family proteins. The finding that GEF protein modulation by HDAC inhibition impacts on cell differentiation may be important for understanding the antitumor mechanism(s) by which HDACi treatment stimulates differentiation in cancer.
Introduction
Cell growth, differentiation, and apoptosis are governed by coordinated and sequential programs involving gene activation, transcription factor (TF) action, and signal transduction.Citation1 Changes in histone acetylation are one of the key mechanisms regulating chromatin architecture.Citation2,3 In general, increased levels of histone acetylation are associated with a more relaxed chromatin state and gene transcription activation, while deacetylation is associated with a more condensed chromatin state and transcription repression. The acetylation status of histones is dynamically controlled by competing activities of 2 enzymatic super-families: histone acetyltransferases (HATs) and histone deacetylases (HDACs).Citation4 HATs and HDACs acetylate and deacetylate both histone and non-histone proteins, such as TFs, cytoskeletal proteins, and molecular chaperones, which in turn control cell cycle progression, differentiation, and apoptosis. HAT and HDAC alterations are involved in several human diseases, as their imbalance causes dysregulation of proliferation and differentiation. HDAC inhibitors (HDACi), such as MS275 (entinostat) and SAHA (vorinostat), are able to maintain or restore the acetylation status of histone and non-histone targets and may thus have important therapeutic applications. Some of these inhibitors have already been used as antitumor agents,Citation5,6 showing significant activity against a variety of both hematological and solid tumors at relatively well-tolerated pharmacological doses.Citation7-9 Although little is known about the specific role of HDACs during hematopoiesis, altered HDAC activity has been directly linked with genesis of acute promyelocytic leukemia (APL)Citation10-12 and other types of leukemias.Citation13 HDACi are able to reduce peripheral blast count in patients with acute myeloid leukemias (AML) and myelodysplastic syndromes (MDS).Citation14 Despite the well-known anticancer effects of HDACi,Citation15 the exact mechanism(s) by which HDACi exert this action and modulate differentiation pathways remains to be determined. HDACi selectively promote histone acetylation and gene transcription, mainly modulating cell growth and survival controllers.Citation16 Histone hyperacetylation activates tumor-suppressor genes (TSG) and represses oncogenes, restoring the normal cell state.
To address the key question concerning the mechanism(s) underlying the reported action of HDACi-mediated cancer cell differentiation,Citation17 we performed gene expression analyses in leukemia U937 cells and identified differentiation patterns modulated by MS275. U937 cells are able to differentiate into granulocytes and monocytes/macrophages, thus representing a suitable model to investigate HDACi-induced differentiation pathways. We found a Rho guanine nucleotide exchange factor (GEF), ARHGEF3, to be one of the most significantly up regulated genes in U937 cells upon treatment with MS275. GEFs are key activators of Rho guanosine triphosphatase proteins (GTPases).Citation18 Three members of the Rho family of GTPases,Citation19 RhoA, Rac1, and CDC42, have been well characterized.Citation20 They function as molecular switches in a variety of signaling pathways and control many aspects of cell behavior.Citation21,22 Rho GTPase activation is mediated by GEFs, which catalyze the exchange of GDP to GTP.Citation23,24 Once activated, Rho GTPase is then able to interact with downstream targets or effector proteins. GTPase activating proteins accelerate the intrinsic GTPase activity of Rho family members to inactivate the switch. Guanine nucleotide dissociation inhibitors regulate cycling between membranes and cytosol by interacting with the prenylated GDP-bound form. Activation of a Rho GTPase should theoretically occur via stimulation of a GEF or inhibition of a GAP.Citation18 Actually, Rho protein activation is mediated by Rho GEFs in response to extracellular stimuli. To date, findings seem to indicate that GEFs are the critical mediators of Rho GTPase activation. Consequently, given the different roles of each Rho GTPase in controlling cellular processes, clarifying the precise Rho GTPase specificity of a particular Rho GEF is crucial to understanding its function in regulating cell behavior. The Rho GEF family includes approximately 70 known genes, some of which have been extensively studied and are reported to be involved in a variety of tumorigenic processes.Citation25 In particular, deregulation of several GEF family members causes multiple human hematologic diseases, such as Fanconi anemia and leukemias.Citation26 Many GEFs can activate more than one GTPase.Citation27 Moreover, GEFs are not only able to activate a specific GTPase, but also cooperate in transducing the upstream signals to downstream effectors via either their subcellular localization or additional protein–protein interactions. Thus, whereas some Rho GEFs are extremely specific, others seem more promiscuous, activating multiple Rho GTPases.Citation28 An exchange factor found in platelets and leukemic and neuronal tissues, XPLN/ARHGEF3, is a unique example of a Rho GEF that shows selectivity within the Rho family, activating RhoA and RhoB, but not RhoC, RhoG, Rac1, or CDC42.Citation29 In humans, its transcript is present in brain, skeletal muscle, heart and kidney, but is also found in macrophages, where it participates in RhoA-dependent phagocytosis, and in platelets, where ARHGEF3 is involved in regulating iron uptake and in erythroid cell maturation.Citation30 Recently, genome-wide linkage studies have shown that genetic variations within the ARHGEF3 gene are associated with variations in ARHGEF3 affecting bone density in women.Citation31 Here, we elucidate the molecular mechanisms triggered by HDACi-mediated ARHGEF3 activation promoting differentiation in human leukemia.
Results
MS275 induces up regulation and cytoplasmic shuttling of ARHGEF3 in leukemia
To investigate the transcriptional events occurring after HDAC inhibition, we performed gene expression analyses in U937 cells treated with MS275 (). Gene expression profiles displayed several genes up- and down-regulated upon MS275 treatment, both at 6 and 24 hours. By comparison analysis, defined gene expression patterns were identified in MS275-treated versus untreated U937 cells at 6 and 24 hours (). In addition, the common differentially regulated genes after MS275 treatment at the 2 different time points were selected and the characteristic alteration of pathways compatible with HDAC inhibition was assessed (). A complete list of all the commonly regulated genes is shown in Table S1. ARHGEF3 and the antigen CD68 were 2 of the genes most strongly upregulated in response to MS275 treatment both at 6 and 24 hours (), suggesting a potential significance for MS275-induced differentiation in these settings. RT-PCR and Western blot analyses were then performed to determine ARHGEF3 expression, providing independent validation and extending the results of the microarray experiments. The two analyses showed that the amount of ARHGEF3 increased in U937 cells after MS275 treatment at 12 and 24 hours both at mRNA () and protein () level. Confirming the active status of ARHGEF3, ChIP experiments showed an enrichment of H3K9,14 ac signal on its promoter region () after only 6 hours of MS275 treatment.
Figure 1. MS275 induces both ARHGEF3 and CD68 transcriptional activation. (A) Heat map of gene expression profiles in U937 cells upon MS275 (5 μM) stimulation at 6 and 24 h. Experiments were carried out in biological triplicate. Student's T-test analysis was performed to compare untreated media and treated media (FDR ≤ 0.05). (B) Gene ontology (GO) of common altered genes in U937 cells after MS275 exposure at 6 and 24 h (FDR ≤ 0.05 and SR ± 2). (C) Venn diagram showing the number of differentially up regulated genes in U937 cells treated with MS275 for 6 h (left) and 24 h (right) (FDR ≤ 0.05 and FC ≥ 2 ). The lower panel shows ARHGEF3 and CD68 expression levels, commonly upregulated after MS275 treatment (FDR ≤ 0.05 and FC ≥ 2).
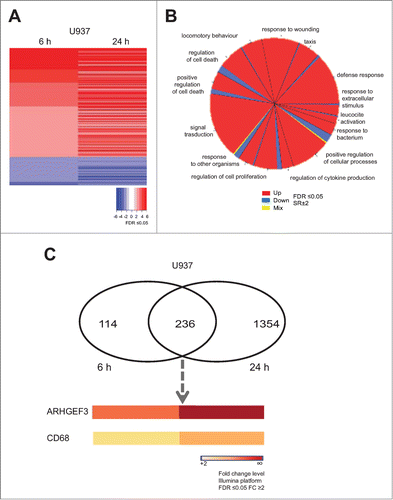
Figure 2. MS275 regulates both expression and localization of ARHGEF3 in leukemia. (A) Analysis of ARHGEF3 expression levels in U937 cells upon MS275 treatment (5 μM) at the indicated times by RT-PCR. The standard deviation was calculated from experiments in biological triplicate. (B) Expression levels of ARHGEF3 in U937 cells after MS275 treatment (5 μM) at the indicated times by Western blot analysis. ERK was used as loading control. (C) ChIP assays were performed in U937 cells treated with MS275 at the indicated times using H3K9,14 ac antibody. The analysis shows the recovery (% IP/Input) of H3K9,14 ac on ARHGEF3 promoter region. (D) IF analysis of ARHGEF3 showing its localization in U937 cells treated with MS275 for the indicated times. Cells were fixed and immune-stained with anti-ARHGEF 3 (red). Nuclear DNA was stained with Hoechst (blue). Scale bar 10 μm.
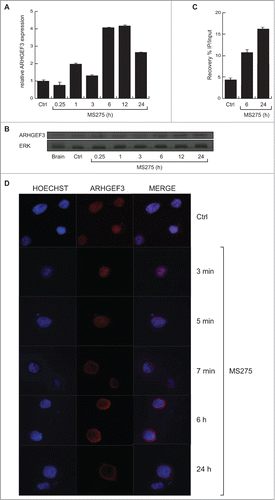
In order to obtain functional data on ARHGEF3 modulation by HDACi, we also investigated its subcellular localization and activity in U937 cells. We examined the subcellular distribution of ARHGEF3 by performing in situ immunofluorescence (IF) analysis with anti-ARHGEF3 antibody. Fluorescence was observed in the nucleus of untreated U937 cells whereas a predominantly cytoplasmic location of ARHGEF3 was identified following stimulation with MS275 (). Interestingly, after only 5 minutes of treatment with MS275, ARHGEF3 was located in both nucleus and cytoplasm, becoming fully cytoplasmic after 6 hours of treatment.
MS275 modulates CD68 expression in leukemia cells, inducing differentiation
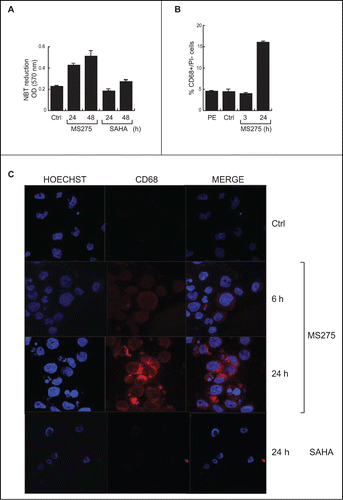
U937 cells were treated with 5 μM MS275 or SAHA for 6 and 24 hours. Cell differentiation was measured by the ability of cells to reduce nitroblue tetrazolium (NBT). The insoluble blue compound (diformazan) synthesized during differentiation indicated that only MS275 was able to induce differentiation in U937 cells, whereas SAHA-induced differentiation was not significantly different from control in these settings (). Subsequently, fluorescence-activated cell sorting (FACS) analysis was carried out to monitor levels of CD68 antigen, a surface protein characteristic of U937 cells differentiated into monocytes /macrophages. FACS analysis was performed on untreated cells and on cells treated cells with 5 μM MS275 after 3 and 20 hours. Our results show that the increase in CD68 expression was 18% greater in MS275-treated cells than in untreated cells (). The enhanced expression of CD68 in MS275-treated cells supports the hypothesis that this compound may induce U937 cells to differentiate into mature monocytes/macrophages. In support, IF analysis clearly demonstrated that untreated U937 cells did not express detectable levels of CD68, but that addition of MS275 stimulated expression of CD68 in a time-dependent manner. Staining revealed intense expression of CD68, prevalently localized at the periphery of cells (). In agreement with the role of CD68 in maturation, SAHA neither modulated CD68 () nor induced differentiation () in these settings.
Figure 3. MS275, but not SAHA, induces expression of CD68 in leukemia. (A) NBT assay in U937 cells upon MS275 and SAHA treatment at 24 and 48 h. Error bars represent standard deviation from 2 independent experiments carried out in duplicate. (B) FACS analysis of CD68 expression in U937 cells upon MS275 treatment at 3 and 20 h. Error bars represent the standard deviation of 2 independent experiments carried out in duplicate. (C) IF analysis of CD68 showing CD68 localization in U937 cells treated with MS275 (5 μM) and SAHA (5 μM) for the indicated times. Cells were fixed and immune-stained with anti-CD68 (red). Nuclear DNA was stained with Hoechst (blue) and visualized using confocal microscopy. Scale bar 10 μm.
MS275 induces RhoA activation and actin remodeling in U937 cells
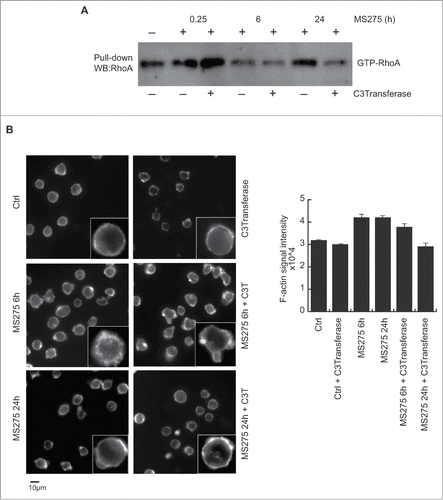
ARHGEF3 is a GEF responsible for activation of RhoA and RhoB, but not RhoC, RhoG, Rac1, or CDC42.Citation29 We therefore investigated whether MS275 was able to activate Rho proteins in U937 cells using a pull-down assay (). To determine the potential level of RhoA activation in U937 cells after MS275 stimulation, we used GST-fused Rhotekin-RBD as a specific probe. The Rhotekin-RBD probe recognizes the active but not the inactive GTP-bound form of RhoA.Citation32 We found that MS275 stimulation of U937 cells did not alter the total level of RhoA protein in cells grown in serum and in serum-starved cells (data not shown). Conversely, MS275 treatment induced a robust increase in GTP-bound RhoA levels, persisting from 6 to 24 hours after initial HDACi exposure, in cycling () and starved (Fig. S1A) U937 cells. The specific role of RhoA activation was confirmed using Clostridium botulinum C3 exoenzyme. This RhoA inhibitor significantly blocked RhoA activation () and its downstream effects. Given the known role of Rho protein activation in membrane ruffling and lamellipodia formation,Citation33,34 the prevalently extra-nuclear localization of ARHGEF3 led us to analyze the effect of MS275 on cytoskeleton in U937 cells. Thus, we first analyzed actin remodeling in a time course experiment in MS275-treated serum-fed or serum-starved U937 cells ( and Fig. S1B). After MS275 treatment, using phalloidin staining, the cells were fixed as described in material and methods, incubated with rhodamine phalloidin (labeling filamentous actin) for 45 minutes in a humid chamber, and then stained with 4′,6-diamidino-2-phenylindole to label nuclei. Cytoskeleton rearrangements increased significantly after 6 hours of MS275 treatment compared to control ( and Fig. S1B). Consequently, cytoskeleton is rearranged upon RhoA activation by MS275. In addition, MS275 treatment induced a polar morphology and increased peripheral filamentous actin, with pronounced extension of filopodia visible by phase-contrast microscopy. These changes are dynamically shut off within 24 hours of treatment with the HDACi, at which time U937 cells showed only amplified cortical actin. In contrast, no significant changes in cell morphology or in the distribution of F-actin were observed when U937 cells were pretreated with 1 μg/mL exoenzyme C3 transferase. Interestingly, inhibition of RhoA resulted in cell rounding and a loss of definition in the actin cytoskeleton ().
Figure 4. MS275 activates GTP-RhoA, inducing reorganization of actin cytoskeleton in leukemia. (A) RhoA-GTP GST pull-down assay in U937 cells stimulated with MS275 (5 μM) in presence or absence of the exoenzyme C3 transferase (1 μg/mL) for the indicated times. GTP-bound RhoA was visualized by Western blot analysis. The results are representative of at least 2 independent experiments. (B) Left. Inverted black-and-white images of IF staining of cytoskeletal actin filaments with Texas Red-labeled phalloidin antibody in U937 cells upon MS275 treatment (5 μM) or exoenzyme C3 transferase (1 μg/mL) for the indicated times. Scale bar 10 μm. Right. Signal intensity quantification analyzed as the media of the intensities of different areas for each sample in the same acquisition region. Differential P value is < di 0,005.
MS275 induces JNK activation and Elk1 phosphorylation via RhoA activation in AML cells
A growing body of evidence shows that activation of Rho GTPases triggers the expression of many targets regulating gene transcription.Citation35-37 In particular, several studies have demonstrated the involvement of some members of the Rho family of GTPases in Jun amino-terminal kinase (JNK) and p38 MAP kinase signaling pathways.Citation38-40
In order to elucidate the role of MS275-mediated RhoA activation, U937 cells were treated with MS275 and the expression of key proteins, such as JNK, ERK and p38 was detected. To further clarify the specific roles of ERK, JNK and p38 in the regulation of Elk phosphorylation in MS275-treated U937 cells, we used selective inhibitors of these different pathways. We first hypothesized that JNKs may be activated by Rho family GTPases in U937 cells. Thus, we pretreated the cells for 4 hours with 1 μg/mL exoenzyme C3 transferase before MS275 stimulation (). Exoenzyme C3 transferase selectively inhibits RhoA activity by ADP-ribosylation of the residue Asn-41 in the RhoA effector domain. We therefore used exoenzyme C3 transferase to examine the role of RhoA in the ability of MS275 to stimulate JNK-Elk1 kinase activities. Our results showed that exoenzyme C3 transferase decreased Elk1 phosphorylated at serine 383 (Elk1pS383) (). Exoenzyme C3 transferase therefore inhibited RhoA-mediated activation of the transcriptional activity of both Elk1 and JNK. When in similar settings U937 cells were pretreated with 10 μM of the MEK1-ERK inhibitor U0126 for 30 minutes, we found that Elk1pS383 levels were detectable. In addition, when compared to U0126 pretreated cells, MS275 slightly increased Elk1pS383 levels after 6 hours of treatment (). Interestingly, MS275 decreased the overall level of Elk1 phosphorylation present in cells grown in serum. Noteworthy, previous studies suggested that Elk1 phosphorylation is controlled by ERK, JNK, and p38 MAPK activation.Citation41-43 As shown by Western blot analysis, ERK inhibition did not strongly affect the level of Elk1pS383 upon 6 hours of MS275 treatment. In the same settings, p38 MAPK activity was not significantly affected by MS275 treatment in U937 cells ().
Figure 5. MS275 affects Elk phosphorylation by RhoA pathway activation. (A) Western blot analysis of expression levels of p-JNK, p-p38 and p-Elk1 in U937 cells after MS275 treatment (5 μM) at the indicated times with or without exoenzyme C3 transferase (1 μg/mL). ERK was used as loading control. (B) Protein expression levels of p-Elk1 and p-ERK in U937 cells after MS275 treatment (5 μM) with or without the MEK inhibitor U0126 (10 μM) for the indicated times. ERK was used as loading control. (C) Protein expression levels of p-Elk1 in U937 cells after MS275 treatment (5 μM) with or without the ROCK inhibitor Y27632 (10 μM) at the indicated times. ERK was used as loading control. (D) Schematic model showing MS275-induced ARHGEF3 involvement in activation of RhoA pathway by phosphorylation of JNK and its target Elk1. (E) Western blot analysis of expression levels of ARHGEF3 in U937 cells after MS275 treatment (5 μM) at the indicated times with or without CEP1347 (0.5 μM). β-actin was used as loading control.
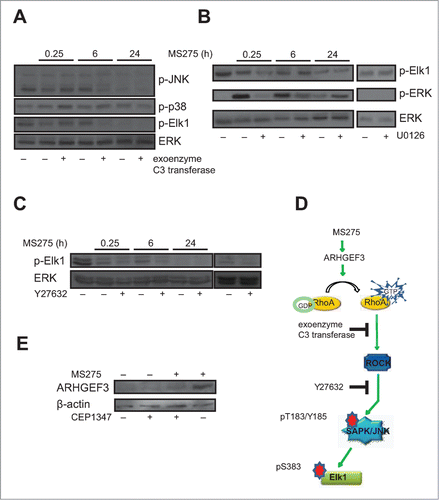
Given that Elk1 is a substrate for JNK, and that its phosphorylation at several COOH terminal sites such as S383 is critical for its transcriptional activity,Citation44,45 we investigated whether Elk1pS383 was associated with increased activation of stress-activated protein kinases (SAPK)/JNK upon MS275 exposure. In support, Western blotting analyses showed the same trend of SAPK/JNKpT183-Y185 and Elk1pS383 upon MS275 treatment in presence or absence of exoenzyme C3 transferase, suggesting that Elk1 phosphorylation and consequent transcriptional activation are associated with regulation of SAPK/JNKpT183-Y185 in these settings. To further characterize the causal relationship between RhoA and Elk1 activation, U937 cells were also treated with a specific ROCK inhibitor, Y27632.Citation46 ROCK is a major RhoA downstream effector mediating the majority of its reported cellular functions.Citation32 In different experimental settings, GTPase-mediated JNK activation involved mediation by ROCKs.Citation47 Interestingly, Elk1 phosphorylation was inhibited in U937 cells pretreated with 10 μM Y27632 for 30 minutes before adding MS275 (). Taken together, these data suggested the model shown in , where in MS275-stimulated U937 cells the activation of ARHGEF3 impacts on RhoA-ROCK pathway, which in turn activates JNK leading to Elk1pS383 and consequent Elk1 transcriptional activation. CEP1347, a specific inhibitor of SAPK/JNK, significantly reduced the observed induction of ARHGEF3 by MS275 ().
ARHGEF3 is responsible for MS275-induced differentiation in U937 cells
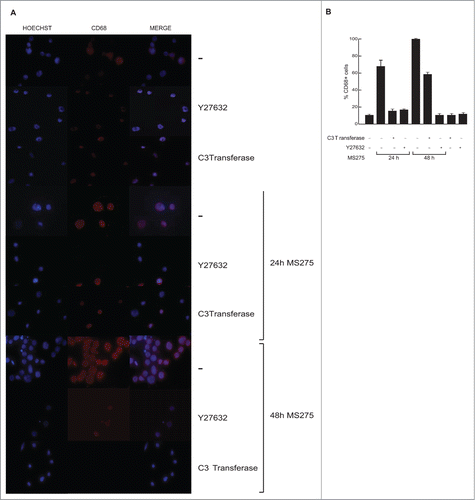
In order to address the role of ARHGEF3 in signal transduction and MS275-dependent differentiation, we investigated whether MS275-induced CD68 expression in leukemia cells during differentiation is causally related to ARHGEF3 expression and its impact on RhoA pathway. Expression of endogenous ARHGEF3 was silenced by small interference RNA (RNAi). As expected, ARHGEF3 siRNA drastically reduced mRNA levels (). Corroborating the causal link between ARHGEF3 and differentiation pathways, ARHGEF3 siRNA also resulted in a significant attenuation of SAPK/JNK activation in U937 siARHGEF3 cells (), further supporting and strengthening SAPK/JNK dependence on MS275-induced ARHGEF3 expression. In agreement, expression of CD68 was also found to be decreased (). In addition, ARHGEF3 silencing strongly reduced CD68 expression in MS275-treated U937 cells, reinforcing our hypothesis that ARHGEF3 is crucially involved in differentiation modulated by MS275 in AML cells. Similar results were obtained when both exoenzyme C3 transferase and Y27632 inhibitors were used to inactivate RhoA pathway at different steps. Each treatment abolished MS275-induced expression of CD68 (), with Y27632 being more effective. To further support our findings and to show that ARHGEF3 is causally involved in RhoA pathway activation as well as being required for SAPK/JNK-Elk1 phosphorylation and subsequent expression of CD68 in MS275-treated U937 cells, gain-of-function experiments by overexpression of ARHGEF3 in U937 cells were also performed (Fig. S2A). Transient transfection with 1 μg XPLN/ARHGEF3 subcloned into pCMV-Myc J3 in U937 cells induced a significant increase in expression levels of both ARHGEF3 and CD68 mRNAs. Additionally, overexpression of ARHGEF3 in U937 cells induced an increase in CD68 expression levels, which reached nearly 100% expression when MS275 was added (Fig. S2B and C). In conclusion, both loss- and gain-of-function experiments carried out on ARHGEF3 in U937 cells support a causal connection with CD68 expression, macrophage-monocyte differentiation and modulation by MS275 via activation of the RhoA signal transduction pathway.
Figure 6. ARHGEF3 knockdown inhibits pSAPK/JNK activation reducing CD68 expression. (A) Expression levels of ARHGEF3 analyzed by RT-PCR in U937 cells transiently transfected with 1 μM of either scramble siRNA (siRNA control) or specific siRNAs targeting ARHGEF3. Gene expression was analyzed at 48 h after transfection with or without MS275 at 5 μM. Error bars represent the standard deviation from 2 independent experiments carried out in triplicate and normalized to GAPDH levels. (B) Protein expression levels of ARHGEF3 and p-JNK in U937 cells in the same settings. ERK was used as loading control. (C) IF analysis of CD68 in U937 cells at 48 h after transfection with or without MS275 at 5 μM. Cells were fixed and immune-stained with anti-CD68 (red). Nuclear DNA was stained with Hoechst (blue) and visualized using confocal microscopy. Scale bar 10 μm.
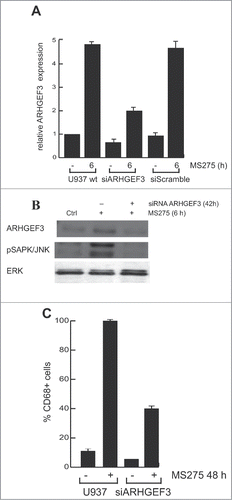
Figure 7. MS275-induced CD68 expression is impaired by interference with the RhoA signaling pathway. (A) IF analysis of CD68 expression in U937 cells under the indicated conditions. Scale bar 10 μm. (B) Percentage of CD68-positive cells by positive cell counting under a microscope.
Discussion
There is now general consensus in defining cancer as a disease of the genome and the epigenome, where both epigenetic alterations and genetic lesions contribute to the disease.Citation48-51 Building on the concept of ‘epigenetic plasticity’,Citation7 several drugs able to modify the chromatin status of a cell by targeting chromatin enzymes have been proposed as beneficial against cancer.Citation50,52 Whether the anticancer action of these drugs is mainly due to their direct effect on the epigenome or to additional, and possibly pleiotropic, effects is still under investigation. Nevertheless, HDACi have entered the clinic and are in advanced phases of clinical trials against the majority of cancers.Citation53,54 In general terms, HDACi are able to induce proliferation arrest and cell death in cancer cells. Interestingly, only some HDACi, and in particular benzamide-based MS275, also impact on differentiation. This aspect of HDACi action is still largely unexplored. Here, by applying microarray analysis, we found that the preferential maturation-induction effects of benzamide-based HDACi is specifically and selectively dependent on a complex network based on activation of ARHGEF3, a RhoA-specific GEF. The finding that ARHGEF3 is causally connected to the effects of MS275 on macrophage differentiation suggests the existence of a specific pathway able to control differentiation independently of cell cycle arrest and cell death. MS275 induces increased ARHGEF3 expression and its subsequent shuttle from nucleus to cytoplasm, where it promotes the binding of GTP to RhoA, resulting in RhoA activation. Consequently, RhoA triggers its downstream effector, ROCK, which modulates phosphorylation and activation of JNK. Active JNK phosphorylates Elk1. At morphological level, activation of the RhoA/ROCK pathway induces actin stress fiber assembly. Pharmacological inhibition of RhoA activation and ARHGEF3 silencing specifically revert this effect. Furthermore, the fact that ARHGEF3 is primarily located in the nucleus but rapidly translocates into cytoplasm upon MS275 treatment, strongly suggests that its compartmentalization is a key step in controlling differentiation. Cytoplasmic ARHGEF3 is associated with activation of the ROCK pathway, cytoskeletal rearrangements orchestrated by RhoA, activation of SAPK/JNK, and phosphorylation of Elk1. The finding that GEF protein modulation by HDAC inhibition impacts on cell differentiation may be important for understanding the anticancer mechanism(s) by which HDACi treatment stimulates differentiation in tumors. Moreover, the fact that HDAC inhibition is followed by activation and rapid execution of transduction pathways suggests the presence of a complex ensemble of signals connecting chromatin-modifying enzymes (and their modulation by so-called epidrugs) and chromatin to signal transduction executioners, which are distantly located in cells. Our data show that i) ARHGEF3 causally modulates leukemia differentiation through activation of RhoA and of pathways directly controlled by small GTPase family proteins; ii) these effects can be controlled and reverted either by silencing of ARHGEF3 or exposure to inhibitors of enzymes involved in signal transduction pathways such as exoenzyme C3 transferase and Y27632, iii) overexpression of ARHGEF3 determines an artificially differentiated status of cells. Whether activation of ARHGEF3 is controlled by an effect on chromatin hyperacetylation or, alternatively, is associated with a more complex regulation induced in cancer cells by MS275, remains to be determined. The evidence that HDACi-induced differentiation in AML cells appears to be distinct from their other biological activities and is mainly related to induction, delocalization and activation of a Rho GEF and its downstream transduction, is an interesting question. Preliminary results indicated that HDACi act immunosuppressively, but recent reports have queried this interpretation.Citation55 It is exciting to speculate that the effects of HDACi on AML differentiation might affect immune function and its underlying mechanisms. Future clinical trials will help clarify the potential of HDACi used in combination with immune-based therapies.
One of the alternative therapies in cancer treatment relies on the use of differentiation inducers, whose application has often been restricted by the presence of specific genetic features in leukemia, as exemplified by the administration of retinoic acid for the treatment of APL.Citation56,57 It is tempting to hypothesize that some HDACi (currently used mainly in poly-chemotherapeutic schemes) might benefit from protocols including transduction modulators and might also be introduced into differentiation regimes. Finally, one of the urgent issues in the fight against cancer is how to deal with recurrence and resistance to treatment. Although in a different setting,Citation58 it has been suggested that addition of HDACi to RAF-MEK modulators may offer a novel clinical strategy to achieve better control of some BRAF(V600E) melanomas. Thus, a better understanding of the regulation of signal transduction by HDACi and their exploitable potential against cancer may pave the way to their innovative use against cancer and to a reconsideration of their anticancer actions.
Material and Methods
Chemical compounds
SAHA (Merck, Readington, NJ USA) and MS27–275 (Bayer-Schering AG, Berlin-Wedding, Germany) were dissolved in DMSO and used at 5 μM. The RhoA inhibitor exoenzyme C3 transferase (Cytoskeleton, Denver, CO, USA) was dissolved in sterile water and used at 1 μg/mL. For inhibition of RhoA/Rho kinase pathways, the specific inhibitor Y27632 dihydrochloride (Roche, Milan, Italy) was used at 10 μM. To block MEK-ERK pathway, the MEK inhibitor U0126 (Alexis Biochemical, Nottingham, UK) was dissolved in ethanol and used at 10 μM. For inhibition of SAPK/JNK, the specific inhibitor CEP1347 (Tocris, Bristol, UK) was dissolved in DMSO and used at 0.5 μM.
Cells
Human leukemia U937 cells were obtained from ATCC (Teddington, UK) and grown at 37°C in air and 5% CO2 in RPMI 1640 medium (Euroclone, Milan, Italy), supplemented with 10% heat-inactivated fetal bovine serum (FBS) (Sigma, St Louis, MO USA), 1% L-glutamine (Lonza, Walkersville, MD USA), 1% ampicillin/streptomycin (Lonza) and 0.1% gentamicin (Lonza). Cells were maintained at a constant concentration of 2 × 10⁵/mL of culture medium.
Gene expression microarray profiling and data analysis
Total RNA was extracted from U937 cell lines before and after MS275 treatment at 6 and 24 hours. RNA (400 ng) was amplified with Ambion Illumina TotalPrep RNA Amplification Kit (Life Technologies, Monza, Italy). cRNA was biotinylated during in vitro transcription reaction overnight. Before and after amplifications, RNA/cRNA concentrations were measured with Nanodrop ND-1000 and RNA/cRNA quality was controlled by Experion electrophoresis station (Bio-Rad Laboratories, Segrate, Italy). Each sample (750 ng) was hybridized to Illumina's Sentrix-HumanRef-8 V2 Expression BeadChips at 58°C for 18 hours according to Illumina Whole-Genome Gene Expression with IntelliHyb protocol, revision B. Hybridization was detected with 1 μg/mL Cy3-Streptavidin (GE Healthcare Biosciences, Milan, Italy). Chips were scanned with Illumina BeadArray Reader and numerical results extracted with BeadStudio 3.1.1.0 (v. Three.2.3). Probe-level raw intensities were analyzed using R/BioConductor and lumi package.Citation59 Background correction and quantile data normalization were performed. In order to detect the statistical significance of the differential expression of genes before and after MS275 treatment, we performed a Bayesian t-test Citation60 for each cell line. For each P-value, the Benjamini-Hochberg procedure was used to calculate the false discovery rate (FDR) to avoid the problem of multiple testing. The selected gene list was obtained using the following thresholds: FDR <0.005 and SR ± 2.
RNA extraction, RT-PCR, and real-time PCR
Total RNA was isolated with Trizol (Invitrogen, Carlsbad, CA USA). One μg total RNA was reverse-transcribed using SuperScript VILO (Invitrogen) according to the manufacturer's protocol. mRNA levels of the analyzed genes were measured by RT-PCR amplification using iQ SYBR GREEN Supermix (Bio-Rad Laboratories) according to the manufacturer's instructions. Relative mRNA quantification was calculated using the comparative ΔΔCT method. The sequences of primers used for PCR were: ARHGEF3 FW 5′-GGC ATT CAG CAA CAA TGA GAG-3′, REV 5′-GACGA TCC CTC GGA GTC AAG 3′; CD68 FW 5′ ACC AAG AGC CAC AAA ACC AC 3′, REV 5′ GGA CTG TGA GTG GCA GTT GA-3′; GAPDH gene FW 5′-GGA GTC AAC GGA TTT GGT CGT-3′, REV 5′-GCT TCC CGT TCT CAG CCT TGA-3′. Primer sequences were designed using Primer3 software.
Protein extraction and Western blotting
U937 cells were harvested by centrifugation and washed in PBS. Samples were lysed in a buffer (50 mM Tris-HCl pH 7.4, 0.5% sodium deoxycholate, 0.1% sodium dodecyl sulfate (SDS), 500 mM NaCl, 10 mM MgCl2, 1% (v/v) Triton X-100, 1 mM sodium orthovanadate, 10 μg/mL aprotinin, 10 μg/mL leupeptin and 0.2 mM phenylmethylsulfonyl fluoride) for 15 minutes at 4°C. The samples were then centrifuged at 13000 rpm for 30 minutes at 4°C and the supernatants were recovered. Proteins were quantified by Bradford assay (Bio-Rad Laboratories) using bovine serum albumin as standard. 50 μg of protein extracts was resolved by SDS-PAGE (10% or 12% w/v polyacrylamide gel), transferred onto a nitrocellulose filter (Whatman, Schleicher & Schuell, Dassel, Germany) at 250 mA for 16–18 hours in a transfer buffer (20 mM Tris, 150 mM glycine, and 20% methanol). The filter was then blocked in TBS containing 1% Tween 20 and 5% dried milk powder (w/v), for 1 hour at RT and incubated with the specific antibodies overnight at 4°C, washed and incubated with the appropriate secondary antibody for 1 hour at RT. Antibodies used were: ARHGEF3 polyclonal antibody (A01) (Abnova, Taipei City, Taiwan ); RhoA (Santa Cruz, Dallas, TX USA); Elk1pS383 (Cell Signaling, Danvers, MA USA); pSAPK/JNK(T183/Y185), p-p38 (Cell Signaling). Protein levels were normalized against ERK (Cell Signaling). Antibody signal was obtained with the enhanced chemiluminescence reagents (Amersham Pharmacia Biotech, Piscataway, NJ USA) according to the manufacturer's instructions.
Immunofluorescence and confocal microscopy
U937 cells spotted on glass coverslips pretreated with 0.1 mg/mL polylysines (Sigma) were treated with MS275 at 5 μM concentration. Control cells were treated with the vehicle alone (0.001%, final concentration). Unless otherwise stated, cells on coverslips were washed once with PBS, fixed for 20 minutes with 4% (w/v) paraformaldehyde in PBS, permeabilized for 5 minutes with 0.2% (v/v) Triton X-100 in PBS and incubated for 1 hour with PBS containing 1% (v/v) FBS. Coverslips were stained for in situ ARHGEF3 localization by incubation with mouse anti-ARHGEF3 polyclonal antibody (Abnova) diluted 1:100 in PBS for 1 hour, followed by 3 washings with PBS. Coverslips were then incubated for 30 minutes with Texas Red-conjugated goat anti-mouse antibody (Jackson Immunoresearch, West Grove, PA, USA) diluted 1:4000 in PBS. Coverslips were washed 3 times in PBS, incubated for 10 minutes with PBS containing Hoechst 33258 (Sigma) at a final concentration of 1 μg/mL and washed 3 times with PBS. The coverslips were inverted and mounted in Mowiol (Calbiochem, San Diego, CA, USA) on glass slides. CD68 was detected using mouse monoclonal anti-CD68 antibody diluted 1:50 in PBS (Santa Cruz). Mouse antibody was detected using Texas Red-conjugated goat anti-mouse antibody diluted 1:4000 in PBS (Jackson Immunoresearch). MRTF-A localization was detected using rabbit polyclonal MRTF-A fluorescein (FITC)-conjugated antibody (1:50 in PBS) (Santa Cruz). Pure goat anti-rabbit was added to detect primary rabbit antibodies. Coverslips were finally stained with Hoechst 33258 (Sigma), inverted and mounted in Mowiol (Calbiochem). Confocal microscopy analysis was performed using a Zeiss LSM 510 laser scanning confocal microscope. To determine cytoskeletal changes, quiescent U937 cells on coverslips were maintained for 24 hours in serum-free medium and stimulated with MS275 at 5 μM concentration for the indicated times. Control cells were treated with vehicle alone. Cells were fixed, permeabilized and washed prior to staining. Actin rearrangements were revealed by treating coverslips with rhodamine-conjugated phalloidin (Sigma) for 1 hour. Images were generated with an Axiophot (Carl Zeiss MicroImaging, Jena, Germany) or a DMLB (Leica, Solms, Germany) fluorescent microscope using 40× and 100× magnification. Images were processed using either KS300 (Carl Zeiss MicroImaging) or IM1000 (Leica) software.
Nitroblue tetrazolium assay
U937 cells were seeded at 2 × 10⁵ cells/mL in 24-well plates (BD Bioscience, Bedford, MA, USA) and dosed daily with the compound(s) of interest. After 24 hours of treatment, the number of cells was adjusted to 2 × 10⁶ cells/mL, and incubated with 0.2% NBT and 200 ng/μL 12-O-tetradecanoylphorbol-13-acetate (Sigma). After incubation for 30 minutes at 37°C, the liquid was discarded, cells and formazan deposits were lysed in lysis buffer (50% dimethylformamide and 20% SDS, pH 7.4). The supernatant fluid was measured in a spectrophotometer at 570 nm in semi-micro (1 mL) cuvettes. The inhibition ratio (%) was calculated as % of inhibition = [(absorbance of control - absorbance of test sample)/absorbance of control] × 100%.
Macrophage differentiation analysis
Cell surface antigen expression was determined by FACS analysis. U937 cells were incubated for 24 hours with 5 μM MS275. The cells were then adjusted to 1 × l06 cells/mL. After cell fixation and permeabilization (BD Cytofix/Cytoperm Fixation/Permeabilization Kit, BD Biosciences), cells were incubated with anti-human CD68 monoclonal PE-conjugated antibody (BD Biosciences) for 1 hour at RT. IgG-PE isotypic antibodies were included as negative controls. At the end of incubation the samples were washed and then resuspended in 1 mL PBS. Analysis was performed by FACS-Calibur (Becton Dickinson, Franklin Lakes, NJ USA) using Cell Quest Pro software and ModFit LT v3 software.
RhoA-GTP GST pull-down assay
Rho Activation Assay Kit (Merck) was used according to the manufacturer's instructions. Briefly, cells were grown for 24 hours in the presence of 10% serum, serum-starved for an additional 24 hours and stimulated with 5 μM MS275 for the indicated times. RhoA activity was measured in U937 cells with and without addition of 1 μg/mL exoenzyme C3 transferase (Cytoskeleton) for 4 hours. Subsequently, media was removed from cells and cells were washed twice in ice-cold PBS and lysed in ice-cold Mg2þ lysis buffer (MLB). Lysates were cleared by centrifugation at 14000 rpm for 5 minutes at 4°C and the soluble fraction was incubated with agarose-bound Rhotekin RBD beads at 4°C for 45 minutes. The beads were pelleted by centrifugation, washed 3 times in MLB, and the bound RhoA-GTP was eluted in 20 μl of Laemmli sample buffer, before electrophoresis on a 13% SDS-PAGE gel. The level of GTP-bound GTPase was analyzed by immunoblot using an anti-RhoA antibody (Santa Cruz).
Small interfering RNA
U937 cells were cultured in 24-well plates, and 6 hours before transfection were treated with MS275 (5 μM). The cells were then transfected with anti-ARHGEF3 siRNA or scramble siRNA using an AMAXA Nucleofector (Lonza), according to the supplier's instructions. After 48 hours the samples were collected and analyzed by q-RT-PCR for ARHGEF3 and CD68 expression. IF analysis for CD68 was also performed. siRNA used to suppress ARHGEF3 expression was ARHGEF3 Chimeric siRNA H00050650-R01–0010 (Abnova) at 1 μM final concentration.
Plasmids and transfections
XPLN/ARHGEF3 was subcloned into pCMV-Myc J3 and pEGFP-C2 (Clontech, Mountain View, CA, USA). ARHGEF3 expression vectors were kindly provided by Dr K. Wennerberg. 1 μg of vector was transfected into U937 cells using AMAXA Nucleofector according to the supplier's instructions. After 24 and 48 hours from transfection, the percentage of GFP-positive cells was determined by FACS analysis; the cells were then lysated and qRT-PCR for CD68 and ARHGEF3 performed.
Chromatin immunoprecipitation
ChIP assays were performed as previously described.Citation61 U937 cells were crosslinked with 1% formaldehyde for 10 minutes at RT. Sonicated chromatin was centrifuged for 5 minutes and then incubated overnight with 3 μg H3K9,14 ac antibody (Abcam, Cambridge, UK) and Protein A/G plus (Santa Cruz). ChIP experiments were analyzed by qPCR with specific primers using a SYBR Green Master Mix (Bio-Rad Laboratories). Recovery of ChIP’ed DNAs was calculated as a percentage of IP/Input. The sequences of primer sets used for ARHGEF3 were: FW 5′-AGA TCT TTC CAT GCC ACA CC-3′ and REV 5′-CCT GGC ACT ACC ACA CCT TT-3′.
Disclosure of Potential Conflicts of Interest
No potential conflicts of interest were disclosed.
Acknowledgments
This work was supported by Blueprint (282510); EPIGEN (MIUR-CNR); AIRC (11812); MIUR (PRIN-2012ZHN9YH). We thank K. Wennerberg for providing XPLN/ARHGEF3 expression vectors. We thank C. Fisher for linguistic editing.
Funding
This work was supported by Blueprint (282510); EPIGEN (MIUR-CNR); AIRC (11812); MIUR (PRIN-2012ZHN9YH).
Supplemental Material
Supplemental data for this article can be accessed on the publisher's website.
Table_S1.xlsx
Download MS Excel (38.6 KB)Figure_S2.pdf
Download PDF (58.9 KB)Figure_S1.pdf
Download PDF (145.7 KB)References
- Conte M, Altucci L. Molecular pathways: the complexity of the epigenome in cancer and recent clinical advances. Clin Cancer Res 2012; 18:5526-34; PMID:22904103; http://dx.doi.org/10.1158/1078-0432.CCR-12-2037
- Benedetti R, Conte M, Altucci L. Targeting histone deacetylases in diseases: where are we? Antioxid Redox Signal 2014; [Epub ahead of print]; PMID:24382114
- Choudhary C, Kumar C, Gnad F, Nielsen ML, Rehman M, Walther TC, Olsen JV, Mann M. Lysine acetylation targets protein complexes and co-regulates major cellular functions. Science 2009; 325:834-40; PMID:19608861; http://dx.doi.org/10.1126/science.1175371
- Di Costanzo A, Del Gaudio N, Migliaccio A, Altucci L. Epigenetic drugs against cancer: an evolving landscape. Arch Toxicol 2014; 88:1651-68; PMID:25085708; http://dx.doi.org/10.1007/s00204-014-1315-6
- Mai A, Altucci L. Epi-drugs to fight cancer: from chemistry to cancer treatment, the road ahead. Int J Biochem Cell Biol 2009; 41:199-213; PMID:18790076; http://dx.doi.org/10.1016/j.biocel.2008.08.020
- Deplus R, Blanchon L, Rajavelu A, Boukaba A, Defrance M, Luciani J, Rothe F, Dedeurwaerder S, Denis H, Brinkman AB, et al. Regulation of DNA Methylation Patterns by CK2-Mediated Phosphorylation of Dnmt3a. Cell Rep 2014; 8:743-53; PMID:25066127; http://dx.doi.org/10.1016/j.celrep.2014.06.048
- Ahuja N, Easwaran H, Baylin SB. Harnessing the potential of epigenetic therapy to target solid tumors. J Clin Invest 2014; 124:56-63; PMID:24382390; http://dx.doi.org/10.1172/JCI69736
- Campbell HS, Hall AE, Sanson-Fisher RW, Barker D, Turner D, Taylor-Brown J. Development and validation of the Short-Form Survivor Unmet Needs Survey (SF-SUNS). Support Care Cancer 2014; 22:1071-9; PMID:24292016; http://dx.doi.org/10.1007/s00520-013-2061-7
- Treppendahl MB, Kristensen LS, Gronbaek K. Predicting response to epigenetic therapy. J Clin Invest 2014; 124:47-55; PMID:24382389; http://dx.doi.org/10.1172/JCI69737
- Saeed S, Logie C, Francoijs KJ, Frige G, Romanenghi M, Nielsen FG, Raats L, Shahhoseini M, Huynen M, Altucci L, et al. Chromatin accessibility, p300, and histone acetylation define PML-RARalpha and AML1-ETO binding sites in acute myeloid leukemia. Blood 2012; 120:3058-68; PMID:22923494; http://dx.doi.org/10.1182/blood-2011-10-386086
- Saeed S, Logie C, Stunnenberg HG, Martens JH. Genome-wide functions of PML-RARalpha in acute promyelocytic leukaemia. Br J Cancer 2011; 104:554-8; PMID:21245861; http://dx.doi.org/10.1038/sj.bjc.6606095
- Martens JH, Brinkman AB, Simmer F, Francoijs KJ, Nebbioso A, Ferrara F, Altucci L, Stunnenberg HG. PML-RARalpha/RXR Alters the Epigenetic Landscape in Acute Promyelocytic Leukemia. Cancer Cell 2010; 17:173-85; PMID:20159609; http://dx.doi.org/10.1016/j.ccr.2009.12.042
- De Bellis F, Carafa V, Conte M, Rotili D, Petraglia F, Matarese F, Francoijs KJ, Ablain J, Valente S, Castellano R, et al. Context-selective death of acute myeloid leukemia cells triggered by the novel hybrid retinoid-HDAC inhibitor MC2392. Cancer Res 2014; 74:2328-39; PMID:24566867
- Tan P, Wei A, Mithraprabhu S, Cummings N, Liu HB, Perugini M, Reed K, Avery S, Patil S, Walker P, et al. Dual epigenetic targeting with panobinostat and azacitidine in acute myeloid leukemia and high-risk myelodysplastic syndrome. Blood Cancer J 2014; 4:e170; PMID:24413064
- Nebbioso A, Carafa V, Benedetti R, Altucci L. Trials with 'epigenetic' drugs: an update. Mol Oncol 2012; 6:657-82; PMID:23103179; http://dx.doi.org/10.1016/j.molonc.2012.09.004
- Gallinari P, Di Marco S, Jones P, Pallaoro M, Steinkuhler C. HDACs, histone deacetylation and gene transcription: from molecular biology to cancer therapeutics. Cell Res 2007; 17:195-211; PMID:17325692
- Marks PA, Richon VM, Rifkind RA. Histone deacetylase inhibitors: inducers of differentiation or apoptosis of transformed cells. J Natl Cancer Inst 2000; 92:1210-6; PMID:10922406; http://dx.doi.org/10.1093/jnci/92.15.1210
- Schmidt A, Hall A. Guanine nucleotide exchange factors for Rho GTPases: turning on the switch. Genes Dev 2002; 16:1587-609; PMID:12101119; http://dx.doi.org/10.1101/gad.1003302
- Bar-Sagi D, Hall A. Ras and Rho GTPases: a family reunion. Cell 2000; 103:227-38; PMID:11057896; http://dx.doi.org/10.1016/S0092-8674(00)00115-X
- Hall A. G proteins and small GTPases: distant relatives keep in touch. Science 1998; 280:2074-5; PMID:9669963; http://dx.doi.org/10.1126/science.280.5372.2074
- Jaffe AB, Hall A. Rho GTPases: biochemistry and biology. Annu Rev Cell Dev Biol 2005; 21:247-69; PMID:16212495; http://dx.doi.org/10.1146/annurev.cellbio.21.020604.150721
- Hall A. Rho family GTPases. Biochem Soc Trans 2012; 40:1378-82; PMID:23176484
- Raftopoulou M, Hall A. Cell migration: Rho GTPases lead the way. Dev Biol 2004; 265:23-32; PMID:14697350; http://dx.doi.org/10.1016/j.ydbio.2003.06.003
- Etienne-Manneville S, Hall A. Rho GTPases in cell biology. Nature 2002; 420:629-35; PMID:12478284; http://dx.doi.org/10.1038/nature01148
- Barrio-Real L, Kazanietz MG. Rho GEFs and cancer: linking gene expression and metastatic dissemination. Sci Signal 2012; 5:pe43; PMID:23033535
- Mulloy JC, Cancelas JA, Filippi MD, Kalfa TA, Guo F, Zheng Y. Rho GTPases in hematopoiesis and hemopathies. Blood 2010; 115:936-47; PMID:19965643; http://dx.doi.org/10.1182/blood-2009-09-198127
- Heasman SJ, Ridley AJ. Mammalian Rho GTPases: new insights into their functions from in vivo studies. Nat Rev Mol Cell Biol 2008; 9:690-701; PMID:18719708; http://dx.doi.org/10.1038/nrm2476
- Garcia-Mata R, Burridge K. Catching a GEF by its tail. Trends Cell Biol 2007; 17:36-43; PMID:17126549; http://dx.doi.org/10.1016/j.tcb.2006.11.004
- Arthur WT, Ellerbroek SM, Der CJ, Burridge K, Wennerberg K. XPLN, a guanine nucleotide exchange factor for RhoA and RhoB, but not RhoC. J Biol Chem 2002; 277:42964-72; PMID:12221096; http://dx.doi.org/10.1074/jbc.M207401200
- Serbanovic-Canic J, Cvejic A, Soranzo N, Stemple DL, Ouwehand WH, Freson K. Silencing of RhoA nucleotide exchange factor, ARHGEF3, reveals its unexpected role in iron uptake. Blood 2011; 118:4967-76; PMID:21715309; http://dx.doi.org/10.1182/blood-2011-02-337295
- Mullin BH, Prince RL, Dick IM, Hart DJ, Spector TD, Dudbridge F, Wilson SG. Identification of a role for the ARHGEF3 gene in postmenopausal osteoporosis. Am J Hum Genet 2008; 82:1262-9; PMID:18499081; http://dx.doi.org/10.1016/j.ajhg.2008.04.016
- Ling L, Lobie PE. RhoA/ROCK activation by growth hormone abrogates p300/histone deacetylase 6 repression of Stat5-mediated transcription. J Biol Chem 2004; 279:32737-50; PMID:15102857; http://dx.doi.org/10.1074/jbc.M400601200
- Kurokawa K, Nakamura T, Aoki K, Matsuda M. Mechanism and role of localized activation of Rho-family GTPases in growth factor-stimulated fibroblasts and neuronal cells. Biochem Soc Trans 2005; 33:631-4; PMID:16042560; http://dx.doi.org/10.1042/BST0330631
- Kurokawa K, Matsuda M. Localized RhoA activation as a requirement for the induction of membrane ruffling. Mol Biol Cell 2005; 16:4294-303; PMID:15987744; http://dx.doi.org/10.1091/mbc.E04-12-1076
- Coso OA, Chiariello M, Yu JC, Teramoto H, Crespo P, Xu N, Miki T, Gutkind JS. The small GTP-binding proteins Rac1 and Cdc42 regulate the activity of the JNK/SAPK signaling pathway. Cell 1995; 81:1137-46; PMID:7600581; http://dx.doi.org/10.1016/S0092-8674(05)80018-2
- Minden A, Lin A, Claret FX, Abo A, Karin M. Selective activation of the JNK signaling cascade and c-Jun transcriptional activity by the small GTPases Rac and Cdc42Hs. Cell 1995; 81:1147-57; PMID:7600582; http://dx.doi.org/10.1016/S0092-8674(05)80019-4
- Rosso SB, Sussman D, Wynshaw-Boris A, Salinas PC. Wnt signaling through Dishevelled, Rac and JNK regulates dendritic development. Nat Neurosci 2005; 8:34-42; PMID:15608632; http://dx.doi.org/10.1038/nn1374
- Zhang S, Han J, Sells MA, Chernoff J, Knaus UG, Ulevitch RJ, Bokoch GM. Rho family GTPases regulate p38 mitogen-activated protein kinase through the downstream mediator Pak1. J Biol Chem 1995; 270:23934-6; PMID:7592586; http://dx.doi.org/10.1074/jbc.270.41.23934
- Kant S, Swat W, Zhang S, Zhang ZY, Neel BG, Flavell RA, Davis RJ. TNF-stimulated MAP kinase activation mediated by a Rho family GTPase signaling pathway. Genes Dev 2011; 25:2069-78; PMID:21979919; http://dx.doi.org/10.1101/gad.17224711
- Reif K, Cantrell DA. Networking Rho family GTPases in lymphocytes. Immunity 1998; 8:395-401; PMID:9586630; http://dx.doi.org/10.1016/S1074-7613(00)80545-2
- Karin M. The regulation of AP-1 activity by mitogen-activated protein kinases. J Biol Chem 1995; 270:16483-6; PMID:7622446
- Deng T, Karin M. c-Fos transcriptional activity stimulated by H-Ras-activated protein kinase distinct from JNK and ERK. Nature 1994; 371:171-5; PMID:8072547; http://dx.doi.org/10.1038/371171a0
- Yu R, Hebbar V, Kim DW, Mandlekar S, Pezzuto JM, Kong AN. Resveratrol inhibits phorbol ester and UV-induced activator protein 1 activation by interfering with mitogen-activated protein kinase pathways. Mol Pharmacol 2001; 60:217-24; PMID:11408617
- Marais R, Wynne J, Treisman R. The SRF accessory protein Elk-1 contains a growth factor-regulated transcriptional activation domain. Cell 1993; 73:381-93; PMID:8386592; http://dx.doi.org/10.1016/0092-8674(93)90237-K
- Whitmarsh AJ, Shore P, Sharrocks AD, Davis RJ. Integration of MAP kinase signal transduction pathways at the serum response element. Science 1995; 269:403-7; PMID:7618106; http://dx.doi.org/10.1126/science.7618106
- Spencer JA, Misra RP. Expression of the serum response factor gene is regulated by serum response factor binding sites. J Biol Chem 1996; 271:16535-43; PMID:8663310; http://dx.doi.org/10.1074/jbc.271.28.16535
- Marinissen MJ, Chiariello M, Tanos T, Bernard O, Narumiya S, Gutkind JS. The small GTP-binding protein RhoA regulates c-jun by a ROCK-JNK signaling axis. Mol Cell 2004; 14:29-41; PMID:15068801; http://dx.doi.org/10.1016/S1097-2765(04)00153-4
- Sandoval J, Esteller M. Cancer epigenomics: beyond genomics. Curr Opin Genet Dev 2012; 22:50-5; PMID:22402447; http://dx.doi.org/10.1016/j.gde.2012.02.008
- Minucci S, Pelicci PG. Histone deacetylase inhibitors and the promise of epigenetic (and more) treatments for cancer. Nat Rev Cancer 2006; 6:38-51; PMID:16397526; http://dx.doi.org/10.1038/nrc1779
- Simo-Riudalbas L, Esteller M. Targeting the histone orthography of cancer: drugs for writers, erasers and readers. Br J Pharmacol 2014; [Epub ahead of print]; PMID:25039449; http://dx.doi.org/10.1111/bph.12844
- Rodriguez-Paredes M, Esteller M. Cancer epigenetics reaches mainstream oncology. Nat Med 2011; 17:330-9; PMID:21386836; http://dx.doi.org/10.1038/nm.2305
- Almouzni G, Altucci L, Amati B, Ashley N, Baulcombe D, Beaujean N, Bock C, Bongcam-Rudloff E, Bousquet J, Braun S, et al. Relationship between genome and epigenome–challenges and requirements for future research. BMC Genomics 2014; 15:487; PMID:24942464; http://dx.doi.org/10.1186/1471-2164-15-487
- Falkenberg KJ, Johnstone RW. Histone deacetylases and their inhibitors in cancer, neurological diseases and immune disorders. Nat Rev Drug Discov 2014; 13(9):673-91; PMID:25131830; http://dx.doi.org/10.1038/nrd4360
- Bravo GM, Garcia-Manero G. Novel drugs for older patients with acute myeloid leukemia. Leukemia 2014; [Epub ahead of print]; PMID:25142817; http://dx.doi.org/10.1038/leu.2014.244
- Kroesen M, Gielen P, Brok IC, Armandari I, Hoogerbrugge PM, Adema GJ. HDAC inhibitors and immunotherapy; a double edged sword? Oncotarget 2014; 5(16):6558-72; PMID:25115382
- Altucci L, Gronemeyer H. The promise of retinoids to fight against cancer. Nat Rev Cancer 2001; 1:181-93; PMID:11902573; http://dx.doi.org/10.1038/35106036
- Mai A, Jelicic K, Rotili D, Di Noia A, Alfani E, Valente S, Altucci L, Nebbioso A, Massa S, Galanello R, et al. Identification of two new synthetic histone deacetylase inhibitors that modulate globin gene expression in erythroid cells from healthy donors and patients with thalassemia. Mol Pharmacol 2007; 72:1111-23; PMID:17666592; http://dx.doi.org/10.1124/mol.107.036772
- Johannessen CM, Johnson LA, Piccioni F, Townes A, Frederick DT, Donahue MK, Narayan R, Flaherty KT, Wargo JA, Root DE, et al. A melanocyte lineage program confers resistance to MAP kinase pathway inhibition. Nature 2013; 504:138-42; PMID:24185007; http://dx.doi.org/10.1038/nature12688
- Du P, Kibbe WA, Lin SM. lumi: a pipeline for processing Illumina microarray. Bioinformatics 2008; 24:1547-8; PMID:18467348; http://dx.doi.org/10.1093/bioinformatics/btn224
- Baldi P, Long AD. A Bayesian framework for the analysis of microarray expression data: regularized t -test and statistical inferences of gene changes. Bioinformatics 2001; 17:509-19; PMID:11395427; http://dx.doi.org/10.1093/bioinformatics/17.6.509
- Nebbioso A, Clarke N, Voltz E, Germain E, Ambrosino C, Bontempo P, Alvarez R, Schiavone EM, Ferrara F, Bresciani F, et al. Tumor-selective action of HDAC inhibitors involves TRAIL induction in acute myeloid leukemia cells. Nature medicine 2005; 11:77-84; PMID:15619633; http://dx.doi.org/10.1038/nm1161