
Abstract
Metastatic melanoma is a deadly treatment-resistant form of skin cancer whose global incidence is on the rise. During melanocyte transformation and melanoma progression the expression profile of many genes changes. Among these, a gene implicated in several steps of melanocyte development, TFAP2A, is frequently silenced; however, the molecular mechanism of TFAP2A silencing in human melanoma remains unknown. In this study, we measured TFAP2A mRNA expression in primary human melanocytes compared to 11 human melanoma samples by quantitative real-time RT-PCR. In addition, we assessed CpG DNA methylation of the TFAP2A promoter in these samples using bisulfite sequencing. Compared to primary melanocytes, which showed high TFAP2A mRNA expression and no promoter methylation, human melanoma samples showed decreased TFAP2A mRNA expression and increased promoter methylation. We further show that increased CpG methylation correlates with decreased TFAP2A mRNA expression. Using The Cancer Genome Atlas, we further identified TFAP2A as a gene displaying among the most decreased expression in stage 4 melanomas vs. non-stage 4 melanomas, and whose CpG methylation was frequently associated with lack of mRNA expression. Based on our data, we conclude that TFAP2A expression in human melanomas can be silenced by aberrant CpG methylation of the TFAP2A promoter. We have identified aberrant CpG DNA methylation as an epigenetic mark associated with TFAP2A silencing in human melanoma that could have significant implications for the therapy of human melanoma using epigenetic modifying drugs.
Abbreviations
| TCGA | = | The Cancer Genome Atlas |
| TFAP2A | = | Transcription Factor Activating Enhancer Binding Protein 2 Alpha |
| qRT-PCR | = | quantitative real-time Reverse Transcription Polymerase Chain Reaction |
Background
Melanoma is a cancer originating from melanocytes or melanocyte precursors and develops in the skin. Cells of the melanocyte lineage undergo malignant transformation to melanoma cells in response to environmental and genetic factors. Metastatic melanoma occurs when melanoma cells spread to anatomical sites distant from the primary tumor site. Metastatic melanoma is very difficult to treat and metastatic disease typically correlates with poor prognosis. Therefore, new therapeutic strategies are needed to treat this deadly form of skin cancer. The incidence of malignant melanoma in the general population is astonishing; according to the SEER statistics data (http://seer.cancer.gov/statfacts/html/melan.html) based on the rates from 2007–2009, nearly 2% of all people born today in the United States will develop melanoma during their lifetime. When discovered early as a localized disease, the 5-year survival rate is 98%; however, when the melanoma has spread to regional lymph nodes or to distant sites, these rates plummet to 64% and 15%, respectively, making metastatic melanoma a high value disease for therapeutic intervention.
Gene expression data indicate that as melanocytes undergo malignant transformation they become progressively less differentiated. For instance, in a study by Nyormoi and Bar-Eli, expression of the gene encoding Transcription Factor Activating Enhancer Binding Protein 2 Alpha (TFAP2A) was found to be lost as melanomas progress from the radial growth phase to the vertical growth phase.Citation1 TFAP2A belongs to the Activator Protein 2 family of transcription factors, which has 5 members, TFAP2A-E. TFAP2A, the best characterized member of the family, appears to regulate the developmental choice between growth and differentiation in several embryonic tissues, specifically the neural crest and its derivatives (reviewed inCitation2-4). Notably, in several studies based on tumors collected primarily at a single hospital, expression of TFAP2A was found to be consistently downregulated in melanomas with respect to benign nevi.Citation5-7 Studies in mouse and zebrafish have shown that TFAP2A is necessary for normal melanocyte development.Citation8-11 In addition, mutations in TFAP2A cause Branchio Oculo Facial syndrome, which includes premature hair graying,Citation12 indicating that TFAP2A has functions in the maintenance of the melanocyte stem cell.
However, the molecular mechanism for the loss of TFAP2A expression in human melanoma is unknown. This study was designed to identify a possible molecular mechanism of TFAP2A silencing in metastatic melanoma. We hypothesized that aberrant cytosine methylation silences the expression of differentiation-promoting genes, including TFAP2A, as melanomas progress. To test this hypothesis, we used clinical human melanoma samples to assess the CpG DNA methylation profiles of the TFAP2A promoter and compared that with patterns of TFAP2A expression. The metastatic melanoma samples were frequently methylated and expressed little TFAP2A mRNA, whereas normal melanocytes that expressed abundant TFAP2A showed no methylation in this region. Our findings indicate that TFAP2A is a target of epigenetic repression during melanoma progression and suggest that pharmaceutical reactivation of TFAP2A by epigenetic modifying drugs might significantly benefit patients with metastatic melanoma.
Results
TFAP2A mRNA expression is silenced in malignant melanomas
Using The Cancer Genome Atlas (TCGA) data (cancergenome.nih.gov), we analyzed RNA-Seq-based gene expression patterns of clinical melanoma samples during melanoma progression.
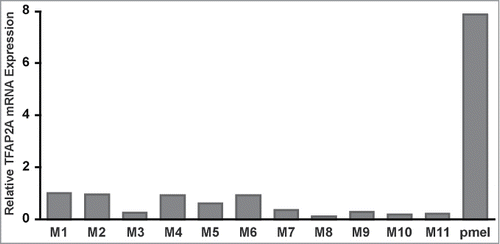
To identify genes that are downregulated during melanoma progression, we first identified genes whose average expression in less-advanced melanoma tumors (i.e., stages 0 through 3) was above a minimum threshold. We then ranked such genes by virtue of their fold-decrease in expression in stage 4 melanoma versus in stages 0–3 using a threshold of 0.2, meaning that values in non-T4 had to be above 0.2 of the highest value in any sample in the SKCM melanoma collection in TCGA. Remarkably, out of 7665 genes, TFAP2A was third on the list ( and Supplementary Data). The only 2 genes more highly reduced were EDNRB and SNAI2, both likely to be targets of TFAP2A based on TFAP2A ChIP-SEQ in human melanocytes (RAC, unpublished). To confirm and extend these results, we assessed TFAP2A mRNA expression using quantitative real-time RT-PCR (qRT-PCR) in 11 human melanomas obtained from The University of Iowa (). Compared to primary human melanocytes, which showed high expression of TFAP2A, all human melanomas showed considerably lower levels of TFAP2A mRNA expression. Furthermore, we observed varying degrees of TFAP2A mRNA expression among the human melanomas, ranging from 0.11-fold to 0.95-fold, as compared to human melanoma sample M1. Among the human melanomas, M1 and M2 showed the highest and M8 and M10 showed the lowest TFAP2A mRNA expression.
Table 1. Top fifteen of the most downregulated genes in human melanoma. RNA-Seq-based gene expression patterns during melanoma progression were extracted from The Cancer Genome Atlas (TCGA) database. Genes were first filtered by high expression in early stage melanoma (0–3) and then ranked by “greatest decrease in expression” in stage 4 melanoma vs. all other non-stage 4 melanoma stages. For the complete list of expression ranked genes see Supplemental Data
Figure 1. TFAP2A mRNA expression in human melanomas is markedly decreased compared to primary human melanocytes. TFAP2A mRNA expression was determined by qRT-PCR and analysis was performed with normalization to 18S mRNA. M1–11: human melanoma samples; pmel: primary human melanocytes.
Human melanomas display higher than normal CpG DNA methylation at the TFAP2A promoter
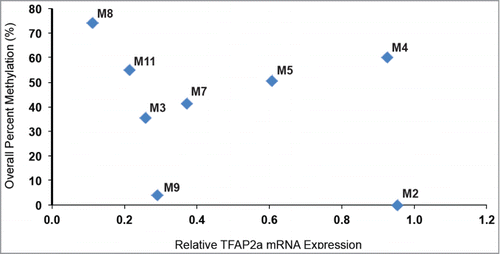
We hypothesized that decreased TFAP2A expression in melanomas in comparison to primary melanocytes might result from increased CpG DNA methylation of the TFAP2A promoter in the melanoma cells. To assess the CpG DNA methylation status of the CpGs near the TFAP2A promoter we deployed bisulfite sequencing of primary melanocytes and all of the melanoma tumor samples where DNA quality was adequate for this analysis (8 of the 11 samples assessed for RNA expression). The methylation status of 35 individual CpG dinucleotides in the TFAP2A promoter (Chr6:10,415,495–10,416,180) is depicted in In primary melanocytes, where TFAP2A expression was high, nearly no methylation was found in the analyzed region. In contrast, in human melanomas levels of CpG DNA methylation were generally higher than in melanocytes. Interestingly, among the 8 human melanoma samples for which both mRNA expression and DNA methylation data were available, human melanomas with higher TFAP2A mRNA expression showed lower levels of CpG DNA methylation and vice versa. For example, no CpG DNA methylation was observed in melanoma M2, which expressed relatively high TFAP2A levels in comparison to the other melanomas. In contrast, relatively high CpG DNA methylation was found in melanoma M8, which expressed TFAP2A at very low levels (). These data suggest a relationship between overall CpG DNA methylation and TFAP2A expression in human melanoma.
Figure 2. The TFAP2A promoter is aberrantly CpG methylated in human melanomas compared to normal melanocytes. (A) Schematic representation of the CpG distribution in the 5′-regulatory region of the human TFAP2A gene. CpG sites are represented by vertical tick marks. A total of 35 CpG dinucleotides were analyzed in the indicated region (Chr6:10,415,495–10,416,180). The transcription start site of TFAP2A is represented as a bent arrow. The locations of the 4 CpG sites analyzed in are indicated as down facing arrows. (B) Genomic DNA of clinical human melanoma samples was bisulfite converted and sequenced. Each row of boxes on the grids shows the CpG DNA methylation profile of an individual clone and each box represents a single CpG within the amplified region. Gray boxes represent methylated CpG dinucleotides; white boxes represent unmethylated CpG dinucleotides. M2–11: human melanoma samples; pmel: primary human melanocytes.
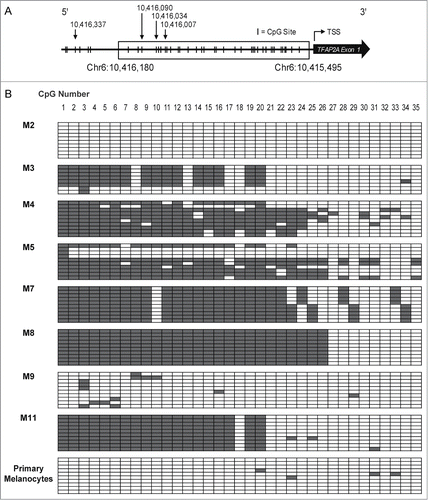
Figure 3. TFAP2A mRNA expression is associated with DNA cytosine methylation. TFAP2A mRNA expression of 8 human clinical melanoma samples was plotted against overall CpG DNA methylation of the TFAP2A promoter. The data reveal that aberrant cytosine methylation of the TFAP2A promoter is associated with reduced TFAP2A mRNA expression in these clinical melanoma samples.
TCGA analysis reveals a similar pattern of methylation vs. expression
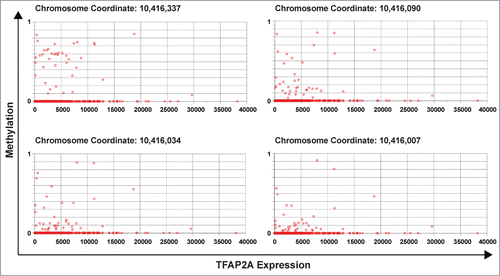
Due to the limited sample size of human melanomas in this study, we extended our efforts to the newly available TCGA data for skin cutaneous melanoma (SKCM) to assess whether the decreases in TFAP2A expression in clinical melanoma samples are associated with increased DNA cytosine methylation similar to what we observed in our clinical samples. Examination of the melanoma data for TFAP2A mRNA expression as a function of DNA methylation using the “Graph” tool in the TCGA Compass (https://research.icts.uiowa.edu/compass/) revealed that indeed TFAP2A is commonly downregulated in human melanomas in association with increased TFAP2A gene methylation. shows methylation at CpG address Chr6:10,416,337 vs. mRNA expression, and similar patterns were seen across CpGs from Chr6:10,416,007–10,416,337 in the 5′-end of the TFAP2A gene in human melanomas. Together, the data from our human melanoma samples and the 184 samples at TCGA strongly support the notion that cytosine methylation is a common mechanism of TFAP2A silencing in malignant melanoma.
Figure 4. TFAP2A mRNA expression is frequently associated with DNA cytosine methylation in human melanoma. TCGA data was extracted and expression (from RNA-seq) was plotted against methylation (from Illumina HumanMethylation450 Bead Chip) for 4 cytosine residues at position Chr6:10,416,007 to Chr6:10,416,337 in the 5′-end of the human TFAP2A gene. These data were extracted and plotted using a unique tool developed at The University of Iowa Institute for Clinical & Translational Science ( https://research.icts.uiowa.edu/compass/). The data across 184 human clinical melanoma samples reveal that aberrant cytosine methylation of this CpG in the TFAP2A gene is associated with transcriptional silencing of TFAP2A mRNA expression in a subset of human melanomas.
Discussion
Here, we present evidence for increased methylation of the TFAP2A promoter in advanced melanoma tumors in comparison to early-stage melanoma tumors. Using The Cancer Genome Atlas, we found that TFAP2A is the third most downregulated in advanced tumors (stage 4) compared to less advanced tumors (stage 3 or lower). Using 11 tumor samples collected at The University of Iowa Hospitals and Clinics, we were able to confirm that TFAP2A is highly downregulated in the tumors compared to primary human melanocytes. By bisulfite sequencing techniques, we found that in a majority of the samples analyzed there was aberrant methylation of the promoter region of TFAP2A. When comparing TFAP2A expression to methylation in these samples a trend similar to that of the TCGA data was seen. Typically, when there is high expression, there is less methylation and vice versa. These results suggest that aberrant methylation of the TFAP2A promoter contributes to the silencing of TFAP2A in advanced melanoma.
TFAP2A has consistently been shown to be downregulated in melanoma.Citation5-7 The data from TCGA has confirmed these findings and our results from 11 melanoma samples are consistent with these previous studies. These results are significant, as TFAP2A is involved in the differentiation of the neural crest and melanocytes during embryonic development. The downregulation of TFAP2A could signify that the melanoma cells are less differentiated than those of a healthy melanocyte. This less differentiated state could be responsible for the invasive and migratory state of melanoma, characteristics that are shared with the neural crest cell population.
Our data indicate that DNA methylation and additional mechanisms contribute to silencing of TFAP2A expression in advanced melanoma, consistent with earlier reports. We observed several patterns of TFAP2A expression and promoter methylation in TCGA data and the samples we analyzed: low expression and high methylation (upper right quadrant and samples M3, M5, M7, M8, M11), high expression and low methylation (lower right quadrant and sample M2), and low expression and low methylation (lower left quadrant and sample M9). In the first 2 groups of tumors the level of TFAP2A expression correlates inversely with CpG methylation, however in the third group it does not. Consistent with these observations, 2 groups have reported that aberrant CpG methylation is associated with TFAP2A gene silencing in both human breast and prostate carcinoma cells.Citation13,14 Additionally, another group showed that TFAP2A was epigenetically activated by 5-aza-2′-deoxycytidine (5-aza-dC), which inhibits CpG methylation, in human breast carcinoma cells.Citation15 Moreover, to explain the third group, there is evidence that the microRNA miR-214Citation16 and the transcription factor CREBCitation17 contribute to TFAP2A silencing in metastatic melanoma in some instances.
Finally, these findings could hold significant therapeutic value, as there is a deficiency in therapies for metastatic melanoma. Currently, front line treatment of metastatic melanoma includes vemurafinib (PLXB4032), a BRAF inhibitor, for patients with a BRAF mutation; however, response to this drug is typically very short term.Citation18,19 By studying the role of DNA cytosine methylation in melanoma, we can better understand the potential benefit of using DNA methyltransferase inhibitors such as 5-aza-2′-deoxycytidine (5-aza-dC, decitabine)Citation20 in combination with other melanoma therapies. Potentially, such treatment will lead to a more differentiated state of tumor, which would slow melanoma progression, leading to better patient survival.
Conclusions
Our data show that the promoter of TFAP2A is highly methylated in human melanoma samples, with low TFAP2A mRNA expression. We further show that TFAP2A gene silencing is common in human malignant melanoma. In summary, our findings suggest that hypermethylation of the TFAP2A promoter is a novel and likely causal mechanism for the loss of TFAP2A expression in human melanoma. Importantly, the observations in this study suggest that TFAP2A might provide a clinically relevant biomarker to assess drug efficacy of epigenetic modifying drugs in metastatic melanoma treatment. Treatment with epigenetic modifying drugs constitutes a mechanism to reactivate TFAP2A expression and, thus, to potentially slow the progression of melanoma.
Methods
Human melanomas
All research related to human subjects was IRB approved and conducted in strict compliance with regulations of The University of Iowa IRB. De-identified specimens of human melanomas were collected by surgical biopsy at The University of Iowa Hospitals and Clinics between 2009 and 2012. Details of individual melanomas are described in . These specimens represent melanomas from a variety of sites, but most were metastatic either to lymph nodes or distant organs.
Table 2. Clinical Characteristics of human melanoma samples used in this study. De-identified specimens representing melanomas from varying sites were collected by surgical biopsy at The University of Iowa Hospitals and Clinics. NOS: not otherwise specified
Quantitative real-time RT-PCR
Total RNA of human melanoma samples was extracted from frozen sections using TRIzol reagent (Invitrogen, Grand Island, NY) by The University of Iowa Tissue Procurement Core. Adjacent sections were assessed microscopically to assure sections contained ≥ 70% tumor cells. RNA samples were quantified using a ND1000 NanoDrop spectrophotometer. RNA from primary melanocytes was purchased from ScienCell Research Laboratories (Carlsbad, CA). Total RNA (500 ng) was reverse transcribed for 2 h at 37°C using the High Capacity cDNA Archive Kit (Applied Biosystems, Foster City, CA) and subsequently used for qRT-PCR analysis. Prepared cDNA (10 ng) was used for each qRT-PCR reaction. TFAP2A mRNA expression was measured using the TFAP2A primer probe Hs01029413_m1 from Life Technologies (Carlsbad, CA). 18S mRNA expression was used as a control gene using the following primer sequences: 18S forward primer: 5′-GCAATTATTCCCCATGAACG-3′, reverse primer: 5′-GGGACTTAATCAACGCAAGC-3′. For each qRT-PCR reaction (10 μL reaction volume), TaqMan Universal PCR Master Mix (Applied Biosystems) was used for TFAP2A along with the primer probe at a final concentration of 1×. For 18S the SYBR Green PCR Master Mix (Applied Biosystems) was used along with primer pairs at 0.5 μM. The PCR protocol was as follows: DNA polymerase heat-activation at 95°C for 10 min followed by 40 cycles, denaturing at 95°C for 15 s, annealing and elongating at 60°C for 1 min. For data collection the ABI PRISM 7500 sequence detection system (Applied Biosystems) was used. For each sample the cycle threshold (CT) was calculated by selecting an amplification threshold in the linear range of each sample. The relative mRNA expression levels were calculated as follows: ΔCT (sample) = CT (TFAP2A) – CT (18S); ΔΔCT = ΔCT (melanoma) – ΔCT (melanoma M1); relative expression = 2−ΔΔCT.
Bisulfite sequencing
Genomic DNA of de-identified human melanoma samples was provided by the Melanoma and Sarcoma Tissue (MAST) Resource in the Holden Cancer Center at The University of Iowa. DNA from primary melanocytes was purchased from ScienCell Research Laboratories. A total of 1 μg of DNA was bisulfite converted using the EZ DNA Methylation Kit (Zymo Research Corporation, Irvine, CA). The bisulfite converted DNA was subsequently amplified in a nested PCR reaction using HotStarTaq Master Mix (Qiagen, Valencia, CA) and primer pairs at 0.5 μM. TFAP2A primers were designed using the MethPrimer online tool.Citation21 Primers were designed to amplify the bisulfite converted TFAP2A promoter (Chr6:10,415,495–10,416,180, UCSC Genome Browser Human Feb. 2009 (GRCh37/hg19) Assembly). The outer PCR (10 μl reaction volume) was set up using the following primers: Bis_out forward primer: 5′-TTGAATATTAATTTGAATTGTTAGTTGGTT-3′, Bis_out reverse primer: 5′-CCCAAATAAAACTACTCTCTAAATAAAC-3′ (986 bp). The reaction was heated to 95°C for 10 min followed by 40 cycles, denaturing at 95°C for 1 min, annealing at 50°C for 1 min and elongating at 72°C for 1 min 10 s followed by a final elongation step at 72°C for 5 min. For the nested inner PCR (25 μl reaction volume) the following primers were used: Bis_in forward primer: 5′-TGGAGTTGTTAAGTAATTTTTTTAGGG-3′, Bis_in reverse primer: 5′-AATAAAAACTTTTCCCTTTTCCAAC-3′ (685 bp). The reaction was amplified as above but elongation was carried out at 72°C for 1 min. The PCR reactions were subsequently run on an agarose gel and the correct bands were excised and extracted from the gel using the Qiagen Gel Extraction Kit. The CloneJet PCR Cloning Kit (Thermo Scientific) was used for cloning of the purified PCR products into the pJET1.2 vector and the ligation mixtures were used for transformation of competent E. coli DH5α. Plasmids were isolated using the PureLink Quick Plasmid Miniprep Kit (Invitrogen) and digested with BglII (New England Biolabs, Ipswich, Massachusetts) for 20 min at 37°C. Plasmids with the correct insert were sequenced at The University of Iowa DNA Sequencing Facility, and the methylation status of each individual CpG dinucleotide in the PCR products was assessed. Samples M1, M6, and M10 were not successfully bisulfite sequenced as the quality of the DNA sample was not suited for PCR amplification due to the nature of the tumor tissue.
TCGA Analysis
Data were downloaded from the TCGA portal and processed with the TCGA Compass (https://research.icts.uiowa.edu/compass/) developed in the Institute for Clinical & Translational Studies at The University of Iowa. All expression values for each gene were normalized by dividing the value in each tumor sample by the highest value detected in any melanoma sample. For analysis of genes with most reduced expression in T4 (mean value) versus T0-T3 (mean value), we restricted the analysis to genes whose expression in T0-T3 samples was greater than 200 units (0.2).
Disclosure of Potential Conflicts of Interest
The authors declare that Dr. Milhem receives support from Hoffmann-La Roche, Inc.; Novartis Corporation; Science Applications International Corporation; Genentech, Inc.; GlaxoSmithKline, Inc.; Janssen Research & Development, Inc.; MabVax Therapeutics, Inc.; Merck Sharp & Dohme Company; Amgen, Inc.; BioVex, Inc.; Polynoma LLC; ZIOPHARM Oncology, Inc.; Bristol-Myers Squibb Company; Novartis Pharmaceuticals Corporation; Pharma Mar, S.A. Sociedad Unipersonal; Prometheus Therapeutics and Diagnostics; Altor BioScience Corporation; ARIAD Pharmaceuticals, Inc.; AstraZeneca AB; Celgene Corporation; CytRx Corporation; Eisai, Inc.; Janssen Research and Development, LLC; Leidos Biomedical Research, Inc. aka SAIC-Frederick; Morphotek, Inc.; Prometheus Laboratories, Inc.; Threshold Pharmaceuticals, Inc.
Authors' Contributions
ARH and SUV conducted the study, performed experiments, analyzed data, generated figures and drafted the manuscript. ARH performed bisulfite sequencing and analyzed sequencing data. DRH and KC assisted with experiments and data collection. MMM provided IRB approved access to clinical samples. RAC and FED conceived of the study, and participated in its design and coordination. FED helped to draft the figures and the manuscript. All authors edited the manuscript and read and approved the final manuscript.
Supplemental_Data.xlsx
Download MS Excel (1.7 MB)Acknowledgments
The authors express their gratitude to Tina Knutson and Rita Sigmund for sample provision and processing. We thank James Schappet for assistance with TCGA data analysis supported by NIH CTSA award 2 UL1 TR000442–06.
Funding
This work was also supported in part by The University of Iowa's Melanoma Research Program (FED), NIH Cancer Center Support Grant 5P30 086862–14, and by NIH R01 AR062547 (RAC) and NSF IOS-114722 (RAC). SUV received salary support from SRP Training Core P42 ES013661–5110. DRH and ARH were supported in part by the Summer Undergraduate Research Program (SURP) administered by the Interdisciplinary Graduate Program in Molecular and Cellular Biology at The University of Iowa. The funders had no role in study design, data collection and analysis, decision to publish, or preparation of the manuscript.
References
- Nyormoi O, Bar-Eli M. Transcriptional regulation of metastasis-related genes in human melanoma. Clin Exp Metastasis 2003; 20:251-63; PMID:12741683; http://dx.doi.org/10.1023/A: 1022991302172
- Eckert D, Buhl S, Weber S, Jager R, Schorle H. The AP-2 family of transcription factors. Genome Biol 2005; 6:246; PMID:16420676; http://dx.doi.org/10.1186/gb-2005-6-13-246
- Wenke AK, Bosserhoff AK. Roles of AP-2 transcription factors in the regulation of cartilage and skeletal development. FEBS J 2010; 277:894-902; PMID:20050923; http://dx.doi.org/10.1111/j.1742-4658.2009.07509.x
- Hilger-Eversheim K, Moser M, Schorle H, Buettner R. Regulatory roles of AP-2 transcription factors in vertebrate development, apoptosis and cell-cycle control. Gene 2000; 260:1-12; PMID:11137286; http://dx.doi.org/10.1016/S0378-1119(00)00454-6
- Huang S, Jean D, Luca M, Tainsky MA, Bar-Eli M. Loss of AP-2 results in downregulation of c-KIT and enhancement of melanoma tumorigenicity and metastasis. EMBO J 1998; 17:4358-69; PMID:9687504; http://dx.doi.org/10.1093/emboj/17.15.4358
- Tellez C, McCarty M, Ruiz M, Bar-Eli M. Loss of activator protein-2alpha results in overexpression of protease-activated receptor-1 and correlates with the malignant phenotype of human melanoma. J Biol Chem 2003; 278:46632-42; PMID:12975361; http://dx.doi.org/10.1074/jbc.M309159200
- Berger AJ, Davis DW, Tellez C, Prieto VG, Gershenwald JE, Johnson MM, Rimm DL, Bar-Eli M. Automated quantitative analysis of activator protein-2alpha subcellular expression in melanoma tissue microarrays correlates with survival prediction. Cancer Res 2005; 65:11185-92; PMID:16322269; http://dx.doi.org/10.1158/0008-5472.CAN-05-2300
- Brewer S, Feng W, Huang J, Sullivan S, Williams T. Wnt1-Cre-mediated deletion of AP-2alpha causes multiple neural crest-related defects. Dev Biol 2004; 267:135-52; PMID:14975722; http://dx.doi.org/10.1016/j.ydbio.2003.10.039
- Knight RD, Javidan Y, Nelson S, Zhang T, Schilling T. Skeletal and pigment cell defects in the lockjaw mutant reveal multiple roles for zebrafish tfap2a in neural crest development. Dev Dyn 2004; 229:87-98; PMID:14699580; http://dx.doi.org/10.1002/dvdy.10494
- O'Brien EK, d'Alencon SC, Bonde G, Li W, Schoenebeck J, Allende ML, Gelb BD, Yelon D, Eisen JS, Cornell RA. Transcription factor Ap-2alpha is necessary for development of embryonic melanophores, autonomic neurons and pharyngeal skeleton in zebrafish. Dev Biol 2004; 265:246-61; PMID:14697367; http://dx.doi.org/10.1016/j.ydbio.2003.09.029
- Van Otterloo E, Li W, Bonde G, Day KM, Hsu MY, Cornell RA. Differentiation of zebrafish melanophores depends on transcription factors AP2 α and AP2 epsilon. PLoS Genet 2010; 6:e1001122; PMID:20862309; http://dx.doi.org/10.1371/journal.pgen.1001122
- Milunsky JM, Maher TM, Zhao G, Wang Z, Mulliken JB, Chitayat D, Clemens M, Stalker HJ, Bauer M, Burch M, et al. Genotype-phenotype analysis of the branchio-oculo-facial syndrome. Am J Med Genet A 2011; 155A:22-32; PMID:21204207; http://dx.doi.org/10.1002/ajmg.a.33783
- Douglas DB, Akiyama Y, Carraway H, Belinsky SA, Esteller M, Gabrielson E, Weitzman S, Williams T, Herman JG, Baylin SB. Hypermethylation of a small CpGuanine-rich region correlates with loss of activator protein-2alpha expression during progression of breast cancer. Cancer Res 2004; 64:1611-20; PMID:14996719; http://dx.doi.org/10.1158/0008-5472.CAN-0318-2
- Makhov PB, Golovine KV, Kutikov A, Canter DJ, Rybko VA, Roshchin DA, Matveev VB, Uzzo RG, Kolenko VM. Reversal of epigenetic silencing of AP-2alpha results in increased zinc uptake in DU-145 and LNCaP prostate cancer cells. Carcinogenesis 2011; 32:1773-81; PMID:21940908; http://dx.doi.org/10.1093/carcin/bgr212
- Zeng L, Jarrett C, Brown K, Gillespie KM, Holly JM, Perks CM. Insulin-like growth factor binding protein-3 (IGFBP-3) plays a role in the anti-tumorigenic effects of 5-Aza-2′-deoxycytidine (AZA) in breast cancer cells. Exp Cell Res 2013; 319:2282-95; PMID:23810988; http://dx.doi.org/10.1016/j.yexcr.2013.06.011
- Penna E, Orso F, Cimino D, Vercellino I, Grassi E, Quaglino E, Turco E, Taverna D. miR-214 coordinates melanoma progression by upregulating ALCAM through TFAP2 and miR-148b downmodulation. Cancer Res 2013; 73:4098-111; PMID:23667173; http://dx.doi.org/10.1158/0008-5472.CAN-12-3686
- Melnikova VO, Dobroff AS, Zigler M, Villares GJ, Braeuer RR, Wang H, Huang L, Bar-Eli M. CREB inhibits AP-2alpha expression to regulate the malignant phenotype of melanoma. PLoS One 2010; 5:e12452; PMID:20805990; http://dx.doi.org/10.1371/journal.pone.0012452
- Livingstone E, Zimmer L, Piel S, Schadendorf D. PLX4032: does it keep its promise for metastatic melanoma treatment? Expert Opin Investing Drugs 2010; 19:1439-49; PMID:20942773; http://dx.doi.org/10.1517/13543784.2010.527945
- Solit DB, Rosen N. Resistance to BRAF inhibition in melanomas. N Engl J Med 2011; 364:772-4; PMID:21345109; http://dx.doi.org/10.1056/NEJMcibr1013704
- Gollob JA, Sciambi CJ, Peterson BL, Richmond T, Thoreson M, Moran K, Dressman HK, Jelinek J, Issa JP. Phase I trial of sequential low-dose 5-aza-2′-deoxycytidine plus high-dose intravenous bolus interleukin-2 in patients with melanoma or renal cell carcinoma. Clin Cancer Res 2006; 12:4619-27; PMID:16899610; http://dx.doi.org/10.1158/1078-0432.CCR-06-0883
- Li LC, Dahiya R. MethPrimer: designing primers for methylation PCRs. Bioinformatics 2002; 18:1427-31; PMID:12424112; http://dx.doi.org/10.1093/bioinformatics/18.11.1427