
Abstract
The electrical response of plants to environmental stimuli can be measured and quantitatively related to the intensity of several stimulating sources, like temperature, solar radiation, soil water content, evapotranspiration rates, sap flow and dendrometric cycles. These relations can be used to assess the influence of different environmental situations on soil water availability to plants, defined as a steady state condition between leaf transpirative flow and soil water flow to plant roots. A restricted soil water flow due to soil dryness can trigger water stress in plants, if the atmospheric evaporative demand is high, causing partial stomata closure as a physiological response to avoid plant dehydration; water stressed and unstressed plants manifest a differential electrical response. Real time plant electrical response measurements can anticipate actions that prevent the plant reaching actual stress conditions, optimizing stomata gas exchange and photosynthetic rates. An electrophysiological sensor developed in this work, allows remote real-time recording information on plant electrical potential (EP) in the field, which is highly related to EP measurements obtained with a laboratory Keithley voltmeter sensor used in an highly controlled experimental setup. Our electrophysiological sensor is a wireless, autonomous devise, which transmits EP information via Internet to a data server. Using both types of sensors (EP electrodes with a Keithley voltmeter and the electrophysiological sensor), we measured in real time the electrical responses of Persea americana and Prunus domestica plants, to induced water deficits. The differential response for 2 scenarios: irrigation and water restriction is identified by a progressive change in slope on the daily maximal and minimal electric signal values in stressed plants, and a zero-slope for similar signals for well-watered plants. Results show a correspondence between measured signals obtained by our electrophysiological sensor and the EP electrodes connected to the Keithley voltmeter in each irrigation stage. Also, both sensors show a daily cyclical signal (circadian cycle).
Abbreviations
| EP | = | electrical potential |
Introduction
Different researchers agree that the generation and transmission of electrical signals in plants is related to the need to respond to environmental stressors, as an adaptive process to prevent dehydration,Citation1-4 based on experimental evidences to different stimuli.Citation5-19 Differential plant electrical responses have been measured for water status variations.Citation20-22
Phloematic tissue is the main route of electrical signal transmission over long distances, similar to a simple neural network, allowing physiological information transfer between tissues and organs.Citation10,19,23,24 Evidence of this electrical transport over long distances in plants have been documented by Fromm and Fei,Citation25 who first reported the occurrence of stomata closure prior to a decrease in leaf turgor in Zea mays. Fromm and Lautner,Citation26 indicated that leaf stomata apparently receive direct information related to soil water status, irrespective of leaf water potential. Grams et al.Citation27 also reported changes in EP in Zea mays plants subjected to soil drying, with a signal propagating at a rate of 1 cm−1 between roots and leaves, also associated with positive increments both in stomata conductance and CO2 absorption, which are initiated 60 s after rehydration. These data indicate that fast, other than hydraulic signalsCitation28 or hormonal signals,Citation29 should serve as an information link between various plant organs, in response to changes in soil water availability.
Long-distance electrical signaling plays an important role in the physiological regulation of photosynthesis due to water stress.Citation26 Stomata conductance and intensity of the photosynthetic process have been used as indicators of water stress.Citation30-33 Specific evidence of the effect of electrical signals on stomata regulation is also reported,Citation7,34 showing that the evocation of a VP (Variation Potential) with an heat pulse in a leaf, promote a decrease in the uptake of CO2 in Populus trichocarpa plants. Evidence of decreased stomata conductance and CO2 assimilation has been documented,Citation25 after subjecting Zea mays plants to a steady decline in soil water content, correlating it with EP variations. Reports on plants that respond efficiently to soil water status,Citation21,25 generating electrical responses; however, Fromm and Lautner,Citation26 suggested the need to understand the role of electrical signaling in photosynthetic response in further, more basic kind of research.
This paper present new and stronger evidence of EP transmission as a long distance plant response to restricted soil water availability, occurring even before water stress can be detected by stomata conductance or CO2 uptake rates, and that EP changes can be measured with a combination of measuring and reference electrodes inserted in the stem of woody plants. These EP measurements are similarly detected both by a Keithley voltmeter and by the electrophysiological sensor developed in this work, for the purpose of irrigation scheduling control.
Stomata conductance (Gs, Wm2s−1) and assimilation CO2 (A, μmolm−2s−1) rates were determined as integrated indicators of the degree of plant stress; these parameters have been previously reported as significant indicators of soil water availability to plants.Citation35-37 A reduced diffusion of CO2 from the atmosphere to the site of carboxylation within the chloroplast, as reported byCitation32,38 is a major cause for the decrease in CO2 assimilation capacity under drought stress situations.
Results reported by Rios-Rojas,Citation39 indicate that woody plant responses to soil water restricted availability can be detected by its EP behavior, opening the possibility to use EP as a sensitive water stress indicator that integrates plant water stress in relation to soil water availability conditions.
Results
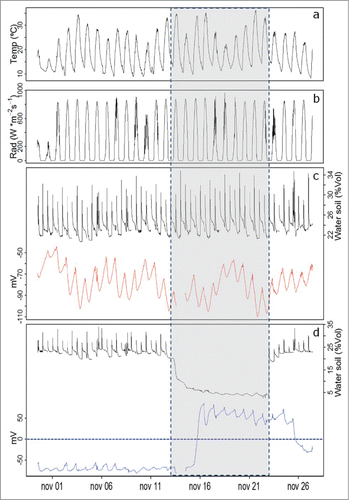
According to reports byCitation3,4,26,39 plants respond electrically to stimuli generated in its micro-environment, and strong evidence indicates that soil water availability directly influences the electrical response of plants. Our results sustain these early reports. Plant EP behavior is presented in , measured using the Keithley voltmeter setup for Persea americana and Prunus domestica, respectively, as related to the influence of micro-environmental conditions. A representative plant EP behavior on each group (red line for continuous water supply and blue line for a plant with total water withdrawal), is presented, also indicating daily solar radiation and air temperature evolutions. The highest daily EP value shows a near zero slope, prior to the total water restriction period in both plant sets. When water is restricted, maximum daily EP values show a significant, positive change in the trend. Once irrigation is restored, after the restriction period, plants react electrically to rehydration; this response is represented by a negative trend in the maximum daily EP value, in both species. No data is available for days 13 and 14 November 2013, due to a general electric supply failure.
A daily EP cyclic response is identified, as reported by Rios-Rojas.Citation39 In , the climatic effect on EP in well-watered plants (red line) is observed with successive changes in the slope of the daily maximum EP values, in coordination with changes in air temperature and solar radiation (). A change in EP maximum daily values of significant greater magnitude and duration is observed for the water restriction period in Persea americana (blue line). Only 2 d after irrigation is restarted, the EP signal initiates a negative change in its daily maximum EP values, as an indicator of recovery ().
Figure 1. Electrophysiological response of Persea americana plants measured with the Keithley voltmeter.
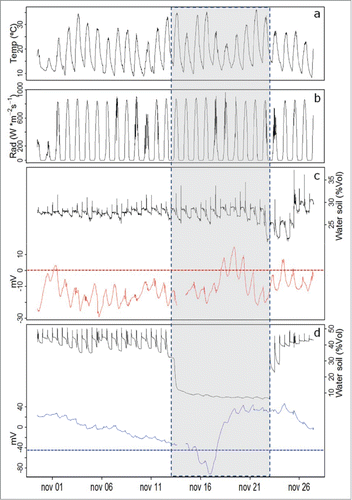
For Prunus domestica plants, the slope of the daily maximum EP values initiates a positive trend only 3 d after water restriction is started, with values in the range of 30 to 85 mV day−1. One day after irrigation is restarted, the slope changes to a negative trend, as plant rehydration recovery period starts ().
Figure 2. Electrophysiological response of Prunus domestica plants, measured with the Keithley voltmeter.
Prunus domestica plants presented; a change on the slope of maximum daily EP values sets almost 4 d after the initiation of the water restriction period as compared to the 2 day restriction period needed by Persea americana plants to start the negative slope reported in .
Small changes in the slope of maximum daily EP values occur in some periods in Prunus domestica plants under constant irrigation, as a result weather (solar radiation and temperature) effects on the plant electrical behavior. For the water restriction period, the slope change is not immediate, taking about 3 d to be detectable by the Standard Normal Homogeneity Test.Citation40 In the case of Persea americana the slope change occurs exactly on 15.11.2013, at 15:00 h, and for Prunus domestica, on 16.11.2013, at 07:30 h.
These slope changes are quantitatively detected as a “change in the continuity of the series, T(k),” namely, when the maximum T(k) is reached, as proposed by Khaliq and Ouarda,Citation41 to detect in homogeneity break points in time series. This T(k) value, would represent the value at which the plant clearly begins a process of water stress.
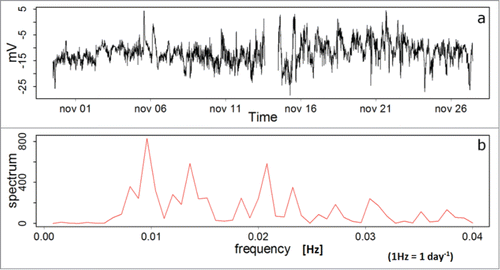
Results presented in for the electrical behavior of a dead Persea americana plant, are evidence of the electrical behavior of living plants and their response to different environmental conditions, generating stimuli to which plants respond electrically, according to the data referenced in this experimental work. The dead plant has been connected to the measurement system from the beginning of the experimental setup (July 2012). In , a spectral analysis is presented by the Fast Fourier Transform technique,Citation42 showing that the dead plant generates a noisy signal listed as “white noise,” has no clear spectrum, or a dominant frequency time.
Figure 3. (A) EP for a dead Persea americana plant. (B) Spectral analysis for the EP of the dead plant. Data was measured with the Keithley voltmeter.
The electric response of Persea americana living plants, measured both with the electrophysiological sensor (black line) and the Keithley sensor (red line) setups, are presented in . These results show a daily cyclic response (24 hours) in well-watered plants. Correlation coefficient is 0.68 at a probability <0.01% and the confidence interval fluctuates between 0.62 and 0.73 for a 95% significance level. The spectral analysis for the well watered plants is presented in , as compared to the spectral analysis corresponding to the water stressed plants (). A second maximum near the frequency 0.02, is detected, with a spectrum of lesser magnitude, compared with the spectrum of the frequency of 0.01, corresponding to a "typical" behavior of Persea americana plants, as reported in Ríos-Rojas,Citation39 for well-watered plants.
Figure 4. (A) EP for a living Persea americana plant, measured with the Keithley voltmeter (redline) and the electrophysiological sensor (black line), during the non - restriction water period. (B) and (C) Spectral analysis obtained from data collected by the Keithley - voltmeter and the electrophysiological sensor, respectively.
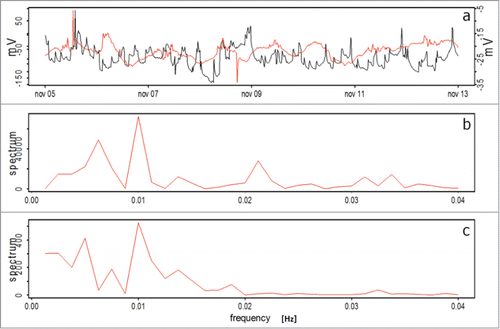
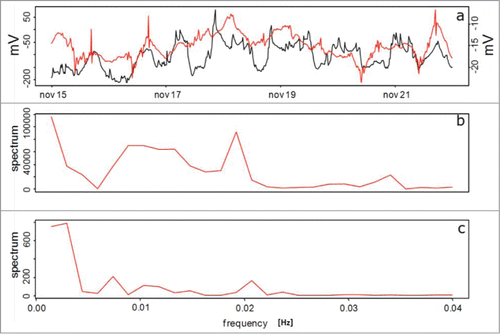
Plant EP in Persea americana under water stress is presented in ; the spectrum shows a dominant frequency of 0.54 d (Frequency 0.02), measured with the electrophysiological sensor. However, the Keithley voltmeter setup signal shows a dominant frequency of 1.4 d The second frequency shows a value equal to the electrophysiological sensor for this period (0.54 days), which means that a state of stress before a water shortage, is expressed by the plant by the increasing frequency of EP signals (). Correlation intervals for the 2 signals for the water restriction period is 0.59 [P < 0.001], with a 95% confidence interval of 0.52 to 0.66.
Figure 5. (A) EP of Persea americana plants, measured with the Keithley voltmeter setup (red line) and with the electrophysiological sensor setup (black line), during the water restriction period (B) Spectral analysis for a well-watered plant. (C) Spectral analysis for a water stressed plant, both during the water restriction period.
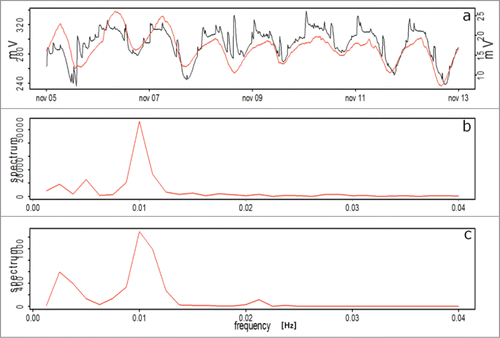
For Prunus domestica, EP measured with both sensors are presented in , for the well-watered period, showing a similar response to Persea americana (), showing a cycle of 1.04 days, as measured with both types of sensors.
Figure 6. EP for Prunus domestica plants during the initial well-watered period. (A) Keithley - voltmeter (red line) and electrophysiological sensor setup (black line), (B) and (C) Frequency analysis corresponding to the Keithley - voltmeter and the electrophysiological sensor setups, respectively.
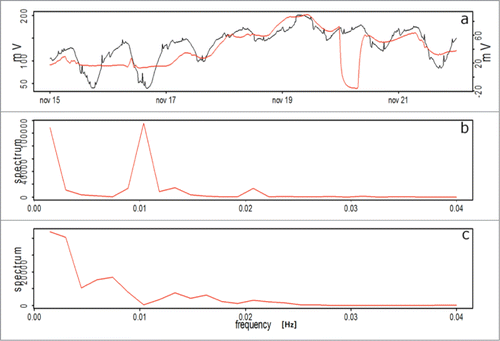
Interestingly, during the water restriction period presented in , Prunus domestica plants do not express exact EP cycles of 12 hours, as measured with the Keithley voltmeter, being the dominant frequency of 1.1 cycle days, and the second frequency of 0.78 d ().However, with the electrophysiological sensor setup an additional 0.5 second cycle, preceded by a 1.0 day cycle () is recorded. The correlation for the 2 sensor signals is 0.55, (P < .001), and a 95% confidence interval of 0.47 to 0.62.
Figure 7. EP for Prunus domestica. (A) Keithley voltmeter (red line) and electrophysiological sensor (black line) setups, respectively, for the water restriction period (B) and (C) Frequency analysis for the Keithley sensor and the electrophysiological sensor setups, respectively.
In order to assess plant stress level measurements of stomata conductance and CO2 assimilation (A) were performed on all plants on 22.11.2013 at 3 different hours: 9:00, 13:30 and 17:30. After that date, only 5 of the 10 plants on each species are subjected to a continuous total water restriction for 11 d At the end of this restrictive period, measurements of Gs, A and Ci, on 6 leaves of each of the 20 experimental plants (both species) were performed.
A non-parametric analysis approach of Gs, A and Ci data was considered, to find significant differences between treatments (plants under irrigation and water restriction regimes). Previously, a Shapiro-Wilks test,Citation43 recommended for n < 30, was performed to corroborated the existence of non-normality distribution of the data (P < 0.05). Subsequently, a Mann Whitney statistical analysisCitation44 on the same data is performed, verifying that the medians are statistically different (P < 0.05); median analysis was needed to identify a change on the parameter distribution, to compare the effect of each substrate water availability treatment, due to the fact that Gs, A and Ci values are physically variable over time, throughout the day.
For Persea americana (), results show significant median differences for Gs, A and Ci variables, for both water availability treatments throughout the day, with the exception of A measurements made at 17:30 PM, coinciding with lower CO2 assimilation rates. Also, for Prunus domestica (), Gs and Ci had a different median distribution, which was statistically different between treatments; however for A measurements, median distribution is similar for both treatments.
Table 1. Mann Whitney Analysis for A, Gs and Ci in (A) Persea americana and (B) Prunus domestica plants measured at the end of a 11 day water restriction period.
Discussion
Results obtained in this experiment are consistent with those published in Rios –Rojas,Citation39 related to the effects of an extended water restriction in plants leading on EP trends. Environmental conditions have an effect on plant electrical behavior, generating EP slope changes, even under conditions of no water stress. Changes in substrate moisture content in the experimental period, leading to differential trends in the slope of the EP signal, suggests that substrate water deficit can be detected by an electrophysiological sensor, enabling early water stress detection directly on the plant.
Spectral analyzes of data on plant electrical behavior under water deficit indicate that unstressed plants have a 24 hour cyclic behavior, with a single daily maximum EP value, as compared to plants under water restrictions, showing a 12 hour cycle on its maximum EP values (), coincident to hours of high evaporative atmospheric demand; when climatic intensity conditions are reduced, approaching sunset, a new maximum EP is detected in water stressed plants.Citation39
Both the Keithley voltmeter and the electrophysiological sensor setups were able to detect woody plant EP behavior under water stressed and no stressed conditions, with very close EP data set; which do not show statistical differences. The wireless electrophysiological sensor developed in this work can be installed in many plants inside at a specific orchard, in widely spaced plants, because each sensor is provided with an independent EP data transmitted via WiFi to the intern, and no in-site voltmeter equipment is required.
Plant water stress recovery after a significant drought period, evaluated using its EP behavior, indicates that the recovery process after rehydration does not start instantaneously after water is restored to the plant substrate. This behavior was clearly evidenced for Persea americana and Prunus domestica, where the recovery, detected though an EP slope change, started only 2 and 1 d after substrate watering, respectively. It took stressed plants almost 10 d to reach EP values similar to those measured in continuous irrigated plants, supporting data Citation32,45 for processes such as transpiration and photosynthesis taking several days to fully recover after rehydration.
The association between EP and both Gs and Ci measurements taken at the end of the water stress period, can be expressed through Gs and Ci non-parametric data analysis. The analyzes for the species studied show that indeed there are significant changes in the measured variables: Ci and Gs, a change that may be related to water stress experienced by the plant, with prolonged water deficit, as the one experienced during the evaluation period. At all times A was lower for water restricted plants, but showed significant differences only for Persea americana (P < 0.05). Higher A values were consistent with higher Gs and lower Ci values in well watered plants of both Persea americana (P < 0.05) and Prunus domestica (P < 0.05). Moreover, higher Ci values in water restricted plants despite lower values Gs is indicative of non-stomatal photosynthetic reduction, i.e. mesophyll damage.
Spectral analysis of EP frequency signals enabled us to statistically separate the effects of substrate water availability treatments on plant EP behavior from EP effects due to its natural circadian cycle behavior, thus, making a proper representation of plant EP as related solely to substrate water availability.
Thus, EP measurements under substrate water restriction conditions could represent a suitable tool for continuously monitoring plant physiological processes, such as gas exchange, CO2 absorption and assimilation; further research is needed to quantitatively correlate EP signaling to these processes, and validate this hypothesis.
Materials and Methods
Plant material and experimental setup
Experimental material corresponds to 10 plants 4-years old Persea Americana Mill, cv Hass grafted on Mexicola graft plants, and 10 Prunus domestica plants, cv D' Agen, grafted on Mariana pattern 2624 plants. Plants were grown in individual 20 Ls pots, with perlite as an inert substrate, and irrigated with a nutrient solution, using an automated irrigation setup; water stress conditions were achieved in 2–3 days, when no irrigation water was supplied. Both experimental species were located within grounded Faraday cages, isolating plants from environmental electromagnetic effects.
Electrical connections in plants
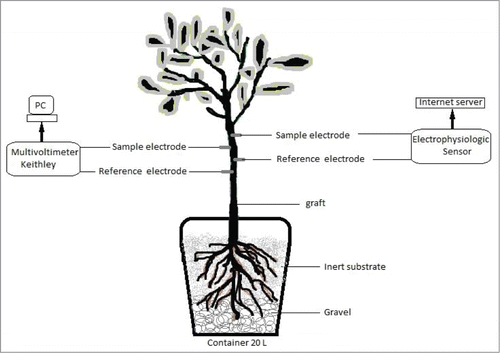
Each plant was provided with 2 electrodes inserted in phloematic tissue: one measuring electrode (positive terminal) and one reference electrode (negative terminal), located 20cm and 30 cm above the graft attachment, respectively (). Each electrode consists of a Simpson Strong Tie® solid stainless steel rod type 304 SS model 316, 3.18 cm long and 0.2 cm in diameter, attached to a 0.5 mm copper conductor, through an electrical connector. Electrodes and connectors were isolated with a flexible water proof plastic sealing tape, to avoid the effect of air humidity on EP measurements.
Figure 8. Connections at the voltmeter sensor.
Plant EP was registered with a 10 s frequency, using a Keithley voltmeter model 2701, provided with an electric signal amplifier and 2 model 7700 multiplexers with 20 channels each; a computing utility ExceLINX® platform recorded EP information from the voltmeter in Microsoft Excel type spreadsheets; this information was analyzed using an algorithm written in R® programming language.Citation46
Electrophysiological sensor
The electrophysiological sensor reported in this investigation, has 2 electrodes, with the same characteristics described above and also inserted into the plant phloematic tissue in similar fashion. Electronic equipment, developed for this sensor simulate the Keithley voltmeter functions with a similar amplifier precision and gain, but each unit (2 electrodes) is independent () and transmits EP information data every 15 minutes via WiFi to an Internet server; a comparative analysis between these 2 sensors is reported.
Sensors measure EP differences, sending the signal in the 4–20 mA range, providing a strong reduction of electrical noise. The amplified signal is transferred, recorded and stored in the DropControl® platform, at the WiseConn S.A. company servers. This platform, provided with an automatic weather station including a solar radiometer, air temperature and humidity and wind intensity/direction sensors, and soil moisture sensors, enables relating micro-environmental data measured at the experimental site with EP measurements in tree trunks. Micro-meteorological data is recorded, stored and analyzed in the DropControl® platform, at the WiseConn S.A. server, which integrates an algorithm for the calculation of potential evapotranspiration, based on the Penman-Monteith model, as revised by FAO.Citation47 EP data measured both by the electrophysiological sensor and the Keithley voltmeter setups are analyzed in connection with micro-climatic variables, using the algorithm developed in R® programming language.Citation46
Plant physiology measurements
To check plant water stress status in response to a prolonged total water restriction (11 days), 3 measurements Gs and A were performed during a day (at 9:00, 13:30 and 17:30 hours) throughout the irrigation period and then, during the period of water restriction, selecting 6 leaves per plant, measured in 60 leaves with similar sun exposure conditions, for each hour throughout the day. During the period of total water restriction, non-parametric analysis is performed at 30 leaves, in 5 irrigated plants and 30 leaves of 5 plants in total water restriction. Gs, A and Ci, measurements were performed with the physiological sensor CI-340®.Citation48
Soil moisture and irrigation regimes
Substrate moisture is measured in real-time with a capacitance sensor Decagon® 10HS model (2014). Volumetric soil water contents for the experimental period were: 32–38%, with 2 daily irrigations, for the irrigation period from05to 13 November 2013, with enough water to induce a 10% drainage recovery below the inert substrate. Then, plants were subjected to a 10 day period of total water restriction, from13 to 23 November 2013; during this water restriction period, volumetric water content varied in the range of 36 to 5%. These plants were then are submitted to an 11 day recovery period, with one irrigation event per day, with enough water to create a 10% drainage flow, from 23 November to 04 December 2013, with volumetric water contents in the range of 28–30%;the plant hydration recovery process continued until the last day of measurements.
Conclusions
Data presented in this paper represent further evidence of plant electrical response to environmental stimuli, specifically substrate water availability. The magnitude of plant EP signaling can be measured in orchards, non-destructively and in real time, with a rather inexpensive electrophysiological sensor developed in this work, which provide very similar results to those obtained using expensive multichannel voltmeters; the sensor can also transmit the EP information directly to the Internet,
The electrophysiology sensor developed, coupled with standard weather sensors, can provide information on the micro-environment changes and their effects on plant electric behavior. Data handling through spectral frequency analysis enable considering plant physiological effects due to water availability separately from plant responses due to their natural EP circadian cycle. However, these results are not sufficient evidence to be generalized to all fruit bearing wood species; further investigation is required to determine the electrical behavior of other species.
The electrophysiological sensor is not recommended as the unique instrument for irrigation scheduling decisions; it can replace equipment used to measure plant water status, which are tissue-destructive and do not operate on a real-time basis, but volume irrigation water depths and timing determinations must be integrated to accurate data obtained from soil moisture, and potential evapotranspiration sensors based on weather station technology.
Disclosure of Potential Conflicts of Interest
No potential conflicts of interest were disclosed.
Funding
This research was partially financed by Fondo de Innovación Agraria (FIA), Ministry of Agriculture, Chile. Grant N° PYT – 2011 - 0038
References
- Fromm J, Lautner S. Electrical signals and their physiological significance in plants. Plant Cell Environ 2007; 30:249-57; PMID:17263772; http://dx.doi.org/10.1111/j.1365-3040.2006.01614.x
- Sukhov V, Nerush V, Orlova L, Vodeneev V. Simulation of action potential propagation in plants. J Theor Biol 2011; 291:47-55; PMID:21959317; http://dx.doi.org/10.1016/j.jtbi.2011.09.019
- Volkov A, Plant electrophysiology. Signaling and responses. 2012. Berlin, Heidelberg: Springer Verlag.
- Gurovich, L. Electrophysiology of woody plants. In: Electrophysiology - From Plants to Heart. 2012.Saeed Oraii ( Ed.), Croatia: In Tech Publishers.
- Schroeder J, Hedrich R. Involvement of ion channels and active transport in osmoregulation and signaling of higher plant cells. Trends Biochem Sci 1989; 14:187-92; PMID:2475930; http://dx.doi.org/10.1016/0968-0004(89)90272-7
- Shepherd V. From semi-conductors to the rhythms of sensitive plants: the research of J.C. Bose. Cell Mol Biol 2005; 51:607-19; PMID:16359611
- Lautner S, Grams T, Matyssek R, Fromm, J. Characteristics of electrical signals in poplar and responses in photosynthesis. Plant Physiol, 2005; 138:2200-209; PMID:16040648; http://dx.doi.org/10.1104/pp.105.064196
- Trebacz K, Dziubinska H, Krol E. Electrical signals in long-distance communication in plants. In Communication in Plants – Neuronal Aspects of Plant Life (Baluška F, Mancuso S, and Volkmann D. Eds.). 2006. Berlin Heidelberg: Springer-Verlag.
- Volkov A, Ranatunga R. Plants as environmental biosensors. Plant Signal Behav 2006; 1:105-15; PMID:19521490; http://dx.doi.org/10.4161/psb.1.3.3000
- Volkov A, Lang L, Volkova-Gugeshashvili M. Electrical signaling in Aloe vera induced bylocalized thermal stress. Bioelectrochemistry 2007; 71:192-97l; PMID:17544342
- Heil M, Ton J. Review. Long-distance signaling in plant defense. Trends Plant Sci 2008; 13: 264-72; PMID:18487073; http://dx.doi.org/10.1016/j.tplants.2008.03.005
- Wang Z, Leng Q, Huang L, Zhao L, Xu Z, Hou R, Wan C. Monitoring system for electrical signals in plants in the greenhouse and its applications. Biosyst Eng 2009; 3:1-11; http://dx.doi.org/10.1016/j.biosystemseng.2009.01.013
- Kai L, Xi G, Fan L, Meng X, Gao X, Liu Q. The changes of electrical signals in corn at different temperatures. Proc. 3rd International Conference on Environmental Science and Information Application Technology (ESIAT 2011). In; Procedia Environmental Sciences 2011; 10: 39-44. Berlin Heidelberg. Elsevier. Available on line at www.sciencedirect.com. Consulted 5 February 2014
- Cabral E, Pecora P, Céspedes A, Bruno A, Costa E. The oscillatory bioelectrical signal from plants explained by a simulated electrical model and tested using Lempel–Ziv complexity. Comput Electron Agr 2011; 76: 1-5; http://dx.doi.org/10.1016/j.compag.2010.12.001
- Brenner E, Stahlberg R, Mancuso S, Vivanco J, Baluška F, Van Volkenburgh E. Plant neurobiology: an integrated view of plant signaling. Trends Plant Sci 2006; 8: 413-9; PMID:16843034; http://dx.doi.org/10.1016/j.tplants.2006.06.009
- Pavlovic A, Mancuso S. Electrical signaling and photosynthesis: Can they co-exist together?. Plant Signal Behav 2011; 6:840-2; PMID:21558815; http://dx.doi.org/10.4161/psb.6.6.15170
- Wagner E, Lehner L, Veit J, Normann J. Albrechtová. Biosystems analysis of plant development concerning photoperiodic flower induction by hydro-electrochemical signal transduction. Plant Electrophysiology Springer Verlag, Berlin, Heidelberg (2012)
- Volkov A, Waite A, Wooten J, Markin V. Circadian rhythms in biologically closed electrical circuits of plants. Plant Signal Behav 2012; 168:1753-60
- Fromm J, Hajirezaei M, Becker V, Lautner S. Electrical signaling along the phloem and its physiological responses in the maize leaf. Front Plant Sci 2013; 4:239; PMID:23847642; http://dx.doi.org/10.3389/fpls.2013.00239
- Gurovich L, Hermosilla P. Electric signaling in fruit trees in response to water applications and light–darkness conditions. J Plant Physiol 2009; 166: 290-300; PMID:18760501; http://dx.doi.org/10.1016/j.jplph.2008.06.004
- Oyarce P, Gurovich L. Electrical signals in avocado trees. Responses to light and water availability conditions. Plant Signal Behav 2010; 5:34-41; PMID:20592805; http://dx.doi.org/10.4161/psb.5.1.10157
- Oyarce P, Gurovich L. Evidence for the transmission of information through electric potentials in injured avocado trees. J Plant Physiol 2011; 168:103-8; PMID:20630616; http://dx.doi.org/10.1016/j.jplph.2010.06.003
- Mancuso E. Hydraulic and electrical transmission of wound-induced signals in Vitis vinifera. Aust J Plant Physiol 1999; 6:55-61.
- Zimmermann M, Maischak H, Mithofer A, Boland W.Felle H. System potentials, a novel electrical long-distance apoplastic signal in plants induced by wounding. Plant Physiol 2009; 149:1593-1600; PMID:19129416; http://dx.doi.org/10.1104/pp.108.133884
- Fromm J, Fei H. Electrical signaling and gas exchange in maize plants of drying soil. Plant Sci 1998; 132:203-13
- Fromm J, Lautner S. Generation, Transmission, and Physiological Effects of Electrical Signals in Plants. In: Volkov A. Plant Electrophysiology. Berlin Heidelberg: Springer – Verlag; 2012; 207-32.
- Grams T, Koziolek C, Lautner S, Matyssek R, Fromm J. Distinct roles of electric and hydraulic signals on the reaction of leaf gas exchange upon re-irrigation in Zea mays L. Plant Cell Environ 2007; 30:79-84; PMID:17177878; http://dx.doi.org/10.1111/j.1365-3040.2006.01607.x
- Mullendore D, Windt C, Van As H, Knoblaucha M. Sieve tube geometry in relation to phloem flow. Plant Cell 2010; 22:579-93; PMID:20354199; http://dx.doi.org/10.1105/tpc.109.070094
- Rodríguez-Gamir J, Ancillo G, González M, Primo-Millo E, Iglesias D, Fomer G. Root signaling and modulation of stomata closure in flooded citrus seedlings. Plant Physiol Biochem 2011; 49:636-45; PMID:21459591; http://dx.doi.org/10.1016/j.plaphy.2011.03.003
- Farquhar G, Sharkey T. Stomata conductance and photosynthesis. Plant Mol Biol 1982; 33:317-45.
- Yoon T, Richter H. Seasonal changes in stomatal responses of sweet cherry and plum to water status in detached leaves. Physiol Plant 1990; 80:520-26; http://dx.doi.org/10.1111/j.1399-3054.1990.tb05673.x
- Flexas J, Barón M, Bota J, Ducruet JM, Gallé A, Galmés J, Jiménez M, Pou A, Ribas-Carbó M, Sajnani C et al. Photosynthesis limitations during water stress acclimation and recovery in the drought-adapted Vitis hybrid Richter-110 (V. berlandieri x V. rupestris). J Exp Bot 2009; 60:2361-77; PMID:19351904; http://dx.doi.org/10.1093/jxb/erp069
- Guardia M, Fernández J, Elena G, Fleck I. Stomatal patchiness in the Mediterranean holm oak (Quercus ilex L.) under water stress in the nursery and in the forest. Tree Physiol 2012; 32:829-38; PMID:22539636; http://dx.doi.org/10.1093/treephys/tps035
- Grams T, Lautner, S, Felle HH, Matyssek R, Fromm J. Heat-induced electrical signals affect cytoplasmic and apoplastic pH as well as photosynthesis during propagation through the maize leaf. Plant Cell Environ 2009; 32:319-26; PMID:19054346; http://dx.doi.org/10.1111/j.1365-3040.2008.01922.x
- Kopyt M, Ton Y, Ben-Ner Z, Bachrach A. A trial of the phytomonitoring technique for roses.Acta Hortic 2001; 547:112-120.
- Meinzer F. Coordination of vapor and liquid phase water transport properties in plants. Plant Cell Environ 2002; 25:265-74; PMID:11841669
- Gurovich L, Gratacos E. Uso de la técnica del fitomonitoreo como indicador del estado hídrico del kiwi y su uso en riego programado. Cien Invest Agrar 2003; 30:113-37.
- Chaves M, Oliveira M. Mechanisms underlying plant resilience to water deficits: prospects for water-saving agriculture. J Exp Bot 2004; 55:2365-84; PMID:1547537
- Rios-Rojas L, Tapia F, Gurovich L. Electrophysiological assessment of water stress in fruit-bearing woody plants. J Plant Physiol 2014; 171:799-806; PMID:2487767
- Alexandersson H, Moberg A. Homogenization of Swedish temperature data. Part I: homogeneity for linear trends. Int J Climatol, 1997; 17: 25-34.
- Khaliq M, Ouarda T. On the critical values of the standard normal homogeneity test (SHNT). Int J Climatol, 2007; 27:681-687.
- Duhamel P and Vetterli M. 1990, Fast Fourier transforms: a tutorial review and a state of the art, Signal Processing 1990; 19:259-299.
- Shapiro S. An analysis of variance test for normality (complete samples). Biometrika 1965; 52:591-611.
- Kasuya, E. Mann-Whitney U test when variances are unequal. Anim Behav 2001; 61:1247-1249.
- Zufferey V, Cochard H, Ameglio T, Spring J, Viret O. Diurnal cycles of embolism formation and repair in petioles of grapevine (Vitis vinifera cv. Chasselas). J Exp Bot 2011; 62:3885-3894.
- R Development Core Team. R: A Language and Environment for Statistical Computing. Vienna, Austria : the R Foundation for Statistical Computing. ISBN: 3-900051-07-0. 2011. Available online at http://www.R-project.org/
- Allen R, Pereira L, Raes D, Smith M. Crop evapotranspiration: guidelines for computing crop water requirements. FAO Irrigation and Drainage Paper 56, FAO, Rome, Italy, 1998; 299 pp.
- CID Bio-Science Inc. Reviwed on line at:http://cid-inc.com/photosynthesis-system/ci-340-accessories. ( May 15th, 2014)