Abstract
Natural variation for drought tolerance is a major issue in adaptation and geographic distribution of terrestrial plants. Despite the importance, little is known about the genes and molecular mechanisms that determine its naturally occurring diversity. We analyzed the intraspecific drought tolerance variation between 2 accessions of Arabidopsis thaliana, Columbia (Col)-0 and Wassilewskija (Ws)-2. Measurement of weight loss in detached seedlings demonstrated a clear difference between drought-tolerant Col-0 and drought-sensitive Ws-2. They also differed in their stomatal response under drought condition. Using a quantitative genetic approach, we found a significant quantitative locus on chromosome 1. Surveying in the locus, we extrapolated that the SLAC1 gene, which is associated with stomatal closure, was likely responsible for the difference of drought tolerance. Comparison of their nucleotide and amino acid sequences revealed that there were few differences in regions encoding SLAC1 protein but was a large deletion in SLAC1 promoter of Ws-2. Histochemical GUS staining showed that the SLAC1 expressed dominantly in guard cells of Col-0, but did less in guard cells of Ws-2. Quantitative PCR analysis also showed that transcript level of SLAC1 in guard cells was higher in Col-0 than in Ws-2. The SLAC1 transcription analyses indicate low accumulation of SLAC1 in guard cells of Ws-2. When taken together, our results suggest that the low drought tolerance of Ws-2 was associated with the deletion of the promoter region of Ws-2 SLAC1.
Abbreviations
| ABA | = | abscisic acid |
| Arabidopsis | = | Arabidopsis thaliana (L.) Heynh |
| Col | = | Columbia |
| GUS | = | β-glucuronidase |
| QTL | = | quantitative trait locus |
| RIL | = | recombinant inbred line |
| SLAC1 | = | slow anion channel-associated 1 |
| Ws | = | Wassilewskija |
Introduction
Plants cope with severe climatic conditions through physiological acclimatization and evolutionary adaptation. Water availability and temperature strongly limit the natural distribution of terrestrial plant species.Citation1,2 Since water deficiency can inhibit plant growthCitation3-6 and limit the propagation of wild plants and crop yields,Citation7,8 understanding plant responses to water deficiency is of great importance to know their adaptation to the environments.
To understand how plants response to water-deficient stress, detailed genetic analyses of plant physiological responses to the stress have been carried out in a few crop and model species.Citation9-11 In Arabidopsis thaliana (L.) Heynh. (Arabidopsis), genes associated to drought response have been identified largely through the use of knockout mutants and transgenic plants.Citation12 Although analyses using these tools are useful, we are able to examine the function of only one gene at a time. When many genes work at the same time under drought condition,Citation13 we need to examine not only each single gene function but also their harmonious function for studying plant adaptation to local environmental conditions.
Arabidopsis is distributed widely in the Northern Hemisphere and has experienced a wide range of climatic conditions and selective pressure for thousands of generations.Citation14 Large genetic variation between naturally occurring Arabidopsis populations provides a unique resource to study its effects on stress tolerance. The differences in traits affecting drought tolerance, such as stomatal closure, reduction in leaf growth, and water use efficiency for biomass production, have been documented among different natural accessions of Arabidopsis.Citation15-18 A locus or gene that affects natural adaptation can be identified by quantitative trait locus (QTL) mapping. In Arabidopsis, several recombinant inbred lines (RILs) have been generated from genetically and phenotypically distinct parents and used for QTL mapping for a variety of traits involved in adaptation to local climatic conditions, including seed dormancy, flowering time and disease resistance.Citation14 Although several studies have reported differences in drought responses among Arabidopsis accessions,Citation19 the genes responsible for the differences between the accessions in adaptation to drought have not been identified.
In this study, we used natural variation between 2 Arabidopsis accessions, Columbia (Col)-0 and Wassilewskija (Ws)-2, and carried out QTL mapping of drought tolerance. An alteration in the SLAC1 promoter was sufficient to change the transcript level of SLAC1 in the guard cells. We conclude that this alteration may affect the level of the SLAC1 protein in the guard cells and cause the difference in stomatal closure response under drought conditions in the 2 accessions.
Results and Discussion
Col-0 shows higher drought tolerance than Ws-2
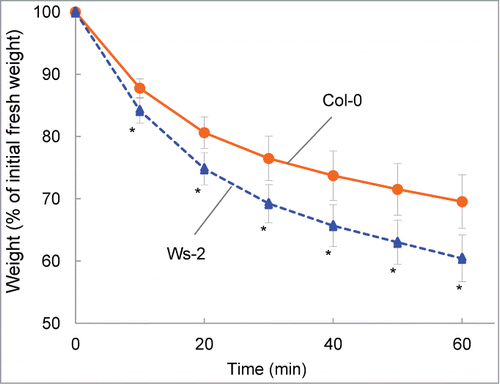
We preliminarily compared weight loss in detached aerial parts of plants of 41 Arabidopsis accessions. Accessions ranged from extremely drought tolerant to hyper sensitive, with Ws-2 showing the most weight loss. The most tolerant accession, which showed little weight loss, was Hodja-obi-Garm (Supplemental Fig. S1). Although RILs from a cross between Ws-2 and Hodja-obi-Germ would be the best to identify genes involved in drought tolerance, we used RILs from a cross between Ws-2 and Col-0, because the latter has been used to determine the entire genome sequence of ArabidopsisCitation20, and almost all Arabidopsis resources, including mutants and T-DNA tagged lines, have been derived from the accession. Measurements of weight loss of Col-0 and Ws-2 for up to 60 min at 10-min intervals revealed that the weights of both accessions decreased over time (). By the end of the experiment, the weight of Ws-2 was 20% less than that of Col-0, indicating that Ws-2 was less tolerant to drought than Col-0.
Figure 1. Comparison of drought tolerance in Col-0 and Ws-2. Data are expressed as the relative decrease in fresh weight (the value at 0 min was set to 100%). Values are means ± SD (n=11 for Col-0; n=10 for Ws-2). Asterisks indicate significant differences from Col-0 (P < 0.01).
The natural variations between Col and Ws have been studied for such traits as photosystem II function, freezing tolerance, ozone sensitivity and induction of volatile terpenes by herbivores.Citation21-24 Ozone-induced visible injury correlated with water loss from detached leavesCitation25 and Tamaoki et al.Citation21 showed that Ws-2 is more susceptible to ozone than Col-0. Our results that Ws-2 is less tolerant to drought than Col-0 are in line with these findings.
Stomatal response to drought is faster in Col-0 than in Ws-2
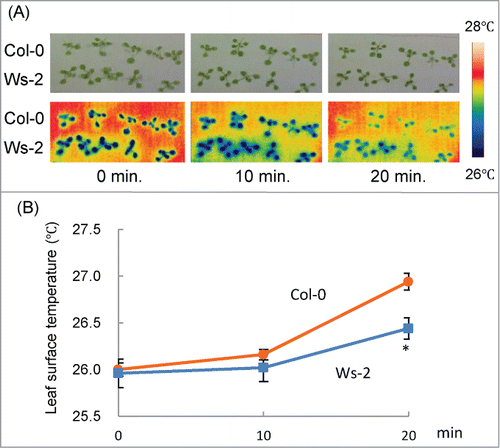
It is well known that, when stomata close in response to drought stress, the leaf surface temperature rises because of a decrease in water evaporation. To characterize the difference in stomatal responses between Col-0 and Ws-2, we measured the leaf surface temperatures of detached seedlings via thermal imaging (). In both accessions, leaf surface temperature was stable within 10 min of detachment (). At 20 min, the temperature was higher in Col-0 than in Ws-2 (). Stomatal density of Col-0 (119 ± 29 mm2) was not significantly different from that of Ws-2 (121 ± 37 mm2), indicating that Col-0 closed its stomata more efficiently than Ws-2 in response to drought. To the best of our knowledge, our study is the first to show that the stomatal response differs between Arabidopsis accessions under water-limited conditions.
Figure 2. Changes in leaf surface temperature under drought condition in detached seedlings. (A) Upper panels: visible light images of Col-0 and Ws-2 at 10-min intervals after detachment. Lower panels: false-color thermal images of the leaf surface of the same seedlings. Color coding is explained on the right side. (B) Average leaf surface temperature of Col-0 and Ws-2. Data represent means ± SD. Asterisk indicates a significant difference from Col-0 (P < 0.01).
QTL analysis for the difference of drought tolerance in a Col-0 × Ws-2 RIL population
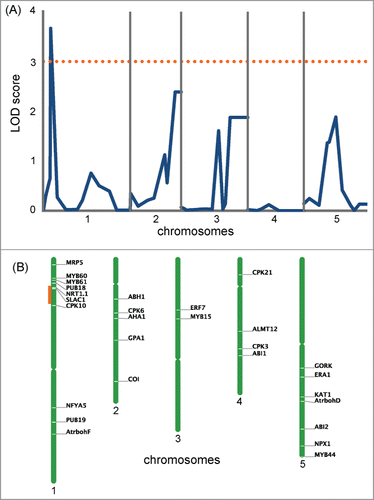
To identify gene loci responsible for the difference of drought tolerance between Col-0 and Ws-2, we examined weight loss at 30 min for 59 Col-0 × Ws-2 RILs and used the data for QTL analysis. Only one peak with a significant LOD score (>3), located on chromosome 1 (jv26/27 marker locates at 12.6 cM), was detected (), suggesting this QTL as a possible candidate. To narrow down the location of this QTL, we searched the vicinity of the detected peak for genes known to be involved in stomatal movement,Citation26 and found that the jv26/27 marker lied close to the SLOW ANION CHANNEL–ASSOCIATED 1 (SLAC1; At1g12480) gene, which encodes a central guard cell S-type anion channel. This gene is essential for stomatal closure in response to abscisic acid (ABA), CO2, ozone, humidity changes and light/dark cycles.Citation27-29 In guard cells, ABA triggers a cascade of reactions that leads to stomatal closure, with an increase in intracellular Ca2+ concentration,Citation30-32 which activates slow-sustained (S-type, e.g., SLAC1) and rapid-transient anion channels. The release of anions from the guard cells through these channels and the following release of potassium ions through potassium channels reduce turgor pressure in the cells.Citation33 Thus, SLAC1 was a good candidate for the gene that contributes to the difference in drought tolerance between Col-0 and Ws-2 by controlling stomatal response.
Figure 3. Genome scans for drought tolerance of Col-0 and Ws-2. (A) QTL likelihood maps produced by composite interval mapping using the drought tolerance experiment data at 30 min. The dotted orange line shows the LOD score of 3. (B) Location of the genes known to be involved in the regulation of stomatal movement in Arabidopsis (Daszkowska-Golec and Szarejko, 2013) is shown at the right of each chromosome. The region marked in orange corresponds to the highest LOD peak found in (A).
Comparison of genomic structure upstream of SLAC1 in Col-0 and Ws-2
We examined the nucleotide sequence of SLAC1 and found only one amino acid substitution (alanine to methionine at position 8) in Ws-2 SLAC1 (Supplemental Fig. S2). SLAC1 has 10 transmembrane α-helices and has a central 5-helix transmembrane pore, which compose a gating pore.Citation34 In Col-0, both the slac1–1 and slac1–2 mutations were detected in the predicted transmembrane segments of SLAC1, indicating that the transmembrane segments are functionally important.Citation27,29 Since the detected substitution is located outside the composed transmembrane segments of the SLAC1 anion channel and is almost at the end of N-terminal tail, we presume that the substitution could hardly influence its gating role and that the difference in drought tolerance between Col-0 and Ws-2 is not associated with the amino acid substitution.
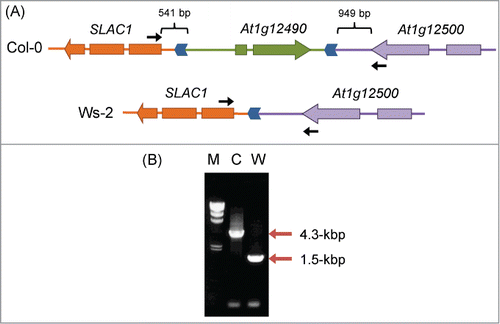
We next investigated the promoter region of SLAC1. To amplify this region, we performed PCR with a primer pair designed for the last exon of the neighboring gene At1g12490 and the first exon of SLAC1 (see ). These primers amplified a fragment of ∼1.5 kbp from Col-0, but no PCR product was detected from Ws-2 (data not shown). Therefore, we replaced the primer corresponding to At1g12490 with a primer designed for the last exon of At1g12500, located downstream of At1g12490 (see ); this primer combination amplified a 1.5-kbp fragment from Ws-2 and a 4.3-kbp fragment from Col-0 (). Sequencing of both PCR products revealed a ∼2.8 kbp deletion in Ws-2, which contained the distal part of the SLAC1 promoter and the entire At1g12490 (). The deletion started 541 bp upstream of the start codon of SLAC1 and ended 949 bp downstream of the stop codon of At1g12500. Col-0 and Ws-2 share the proximal part of the SLAC1 promoter spanning 541 bp, of which the 377-bp region proximal to the SLAC1 start codon is identical in both accessions. The remaining 164 bp represent a repeated region; another repeated region (with forward direction) is found between At1g12490 and At1g12500 in the Col-0 genome (), indicating that the 2.8-kbp deletion in Ws-2 might have occurred as a result of a homologous recombination at the direct repeat site. It seems possible that the deletion in the SLAC1 promoter or the elimination of At1g12490 in Ws-2 has altered its tolerance to drought.
Figure 4. Differences in genomic structure upstream of SLAC1 between Col-0 and Ws-2. (A) Genomic structure upstream of SLAC1. Genes are shown as arrows in the direction of transcription. Regions syntenic in Col-0 and Ws-2 are indicated by the same color. Direct repeats in the SLAC1 promoter are shown as blue chevron arrows. Locations of the primers used in (B) are shown by black arrows. (B) PCR amplification of the SLAC1 promoter region. Positions of PCR products are indicated by red arrows. M, λ/Hind III size marker; C, Col-0; W, Ws-2.
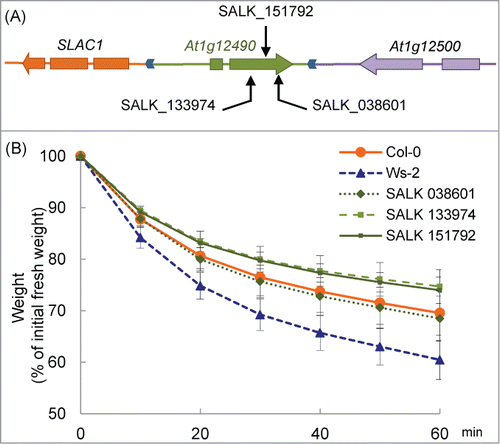
Drought tolerance in Arabidopsis is not controlled by At1g12490
We compared drought tolerance in detached Arabidopsis plants of At1g12490 knockout lines. At1g12490 encodes an F-box–associated ubiquitination effector protein, but its function has not been completely understood. In three lines (SALK_038601, SALK_133974 and SALK_151792 in the Col-0 background) in which this gene was disrupted by T-DNA insertions (), the weight loss of detached plants was measured (). There was no significant difference between Col-0 and the 3 SALK lines throughout the course of the experiment. Significant difference was detected between Ws-2 and the 3 SALK lines at 10 min and it increased during the treatment (p < 0.05). These results indicate that At1g12490 does not affect the drought tolerance of Col-0.
Figure 5. Drought tolerance in At1g12490 knockout mutants. (A) Locations of the T-DNA insertions in At1g12490 are indicated by arrows. (B) Drought tolerance in Col-0, Ws-2 and knock-out plants. Data are expressed as the relative decrease in fresh weight (the value at 0 min was set to 100%). Values are means ± SD. n=11 for Col-0, n=11 for Ws-2 and n=3 for the other 3.
The SLAC1 transcript level in guard cells is low in Ws-2
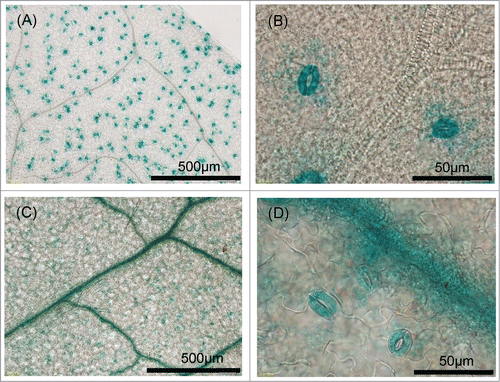
To examine effects of alteration of SLAC1 promoter, we generated transgenic plants carrying GUS under the control of the SLAC1 promoter derived from Col-0 and Ws-2 (Supplemental Fig. S3). In plants carrying the pSLAC1-Col::GUS construct, GUS activity was predominantly localized to the guard cells (), in line with a previous study.Citation29 Only trace levels of GUS activity were detected in vascular strands, and no GUS activity was observed in other organs (data not shown). In plants carrying the pSLAC1-Ws::GUS construct, GUS activity was predominantly observed in the vascular strands (), with trace levels detected in the guard cells, although prolonged incubation resulted in clear GUS activity (data not shown). These results indicate that the Ws-2 SLAC1 promoter has lower activity in the guard cells but higher activity in the vascular strands than the tested fragment of the Col-0 SLAC1 promoter.
Figure 6. Histochemical localization of GUS activity in transgenic plants. (A, B) GUS staining in the leaves of Col-0 transformants carrying of pSLAC1-Col::GUS was specifically observed in guard cells. (C, D) GUS staining in the leaves of Ws-2 transformants carrying pSLAC1-Ws::GUS was detected in guard cells and predominantly in leaf veins.
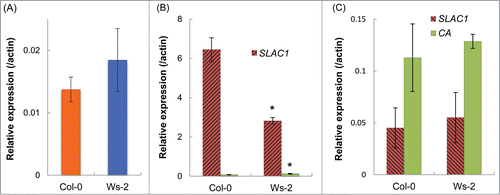
To confirm the difference in the SLAC1 transcript levels between the guard cells of Col-0 and Ws-2, we used quantitative-PCR analyses. In leaves, the SLAC1 transcript level had no significant difference between Col-0 and Ws-2 (). In Col-0 guard cell protoplasts, the transcript level was 2.5 times that in Ws-2 (). In mesophyll protoplasts, the level of this transcript was very low in comparison with that in the guard cells and similar without any significant difference in Col-0 and Ws-2 (). Taken together, these data suggest that alteration of the SLAC1 promoter influences the SLAC1 transcript level in the guard cells.
Figure 7. SLAC1 expression in leaves. (A) Transcript levels of SLAC1 in whole leaves. (B) Transcript levels of SLAC1 and Carbonic anhydrase (CA) in guard cell protoplasts. CA expression was assessed to check the purity of guard cell protoplasts. Low level of CA expression shows that the guard cells were highly purified. (C) Transcript levels of SLAC1 and CA in mesophyll protoplasts. Transcript level of each gene is presented relative to the Actin expression level. Values are means ± SD (n = 3). Asterisks indicate significant differences from Col-0 (P <0.01).
The difference in the SLAC1 transcript level between Col-0 and Ws-2 may depend on the structure of SLAC1 promoter. In this region, we found a number of (T/A)AAAG elementsCitation35 in both Col-0 (5 on the sense strand and 7 on the antisense strand) and Ws-2 (7 on the sense strand and 11 on the antisense strand) (Supplemental Fig. S4). Galbiati et al.Citation36 suggested that a cluster of at least 3 (T/A)AAAG elements located on the same strand within a 100-bp region is important for guard cell–specific gene expression. Both Col-0 and Ws-2 have several such clusters (Supplemental Fig. S4). While on the other hand, 2 cis-elements, ABA-responsive element (ABRE; ACGTGT) and the core motif of the dehydration-responsive element (DRE; ACCGAT), were found only in the SLAC1 promoter of Col-0 (Supplemental Fig. S4). These elements are present in many ABA-inducible genes and play important roles in drought stress responses downstream of ABA.Citation37,38 These elements in the SLAC1 promoter of Col-0 may contribute to the high level of SLAC1 transcription in the guard cells and to the efficient response to drought stress in this accession. The contribution of these elements to SLAC1 transcription in the guard cells of Col-0 under non-stress conditions should be clarified in further experiments.
Conclusions
The results presented here indicate that the higher drought tolerance in Col-0 than in Ws-2 depends on its more efficient stomatal closure. The difference between the 2 accessions is caused by a deletion in a part of the promoter of the gene for the anion channel SLAC1 in Ws-2. It is interesting to extend it in another accession of Arabidopsis. Using PCR, we analyzed the SLAC1 promoter (see ) in 41 Arabidopsis accessions used in our initial drought tolerance experiment (Supplemental Fig. S1) and found that all accessions belonged to either the Col-0 type (4.3-kbp) or the Ws-2 type (1.5-kbp) according to the length of the PCR products. Yet there was no correlation between the type of the SLAC1 promoter and drought tolerance (data not shown).Thus, this deletion is not the only factor affecting the differences in drought tolerance among Arabidopsis accessions. Further experiments are needed to understand the wide range of adaptations of Arabidopsis accessions to drought conditions.
Materials and Methods
Plant material and growth conditions
Seeds of Arabidopsis thaliana (L.) Heynh. Accessions used in the initial screening of drought tolerance were obtained from the Arabidopsis Biological Resource Center (ABRC, Columbus, OH, USA; Supporting information Supplemental Table S1). Seeds of homozygous T-DNA knockout lines for At1g12490 (SALK_038601, SALK_133974 and SALK_151792) were also obtained from the ABRC. All seeds were sown on blocks of rockwool (Rockwool Grodan, Roermond, The Netherlands). Seeds were vernalized for 1 week at 4°C. Except for quantitative PCR analysis, seedlings were grown in a growth chamber at 25°C, a relative humidity of 50% to 60% and a photosynthetic photon flux density (PPFD) of 100 μmol photons m–2 s–1 under a 14-h light/10-h dark cycle. For quantitative PCR, seedlings were grown in a growth chamber at 22°C at the same relative humidity and PPFD under a 8-h light/16-h dark cycle. Two weeks after germination, plants were transplanted individually into pots (7 cm × 7 cm) filled with vermiculite (VERMI, Fukushima, Japan) and PROMIX (PREMIER HORTICULTURE INC., PA, USA) (1:1, v/v). All plants were watered with Hyponex liquid fertilizer (NPK = 6–10–5; Hyponex Japan, Osaka, Japan) diluted 1:2000.
Drought tolerance examination and observation of stomatal conductance by infrared thermal imaging
All experiments were carried out with 2-week-old plants. For examining drought tolerance, aerial parts of 10 plants were detached and placed on a tray abaxial side up. They were weighed immediately (0 min) and every 10 min to 60 min. Weight loss was expressed as a percentage of the initial fresh weight. For infrared thermal imaging, the aerial parts of each plant (Col-0, Ws-2) were detached and arranged on filter paper, and the leaf surfaces were photographed with an infrared camera (CPA-E60; FLIR Systems, Inc.., OR, USA) immediately (0 min) and at 10 and 20 min. The images were analyzed with FLIR Tools ver. Four software (FLIR Systems).
RIL population and QTL analysis of drought tolerance
QTLs for Arabidopsis drought tolerance were analyzed by using a recombinant inbred (RI) population of 59 lines derived from 6 independent crosses between Col-0 (as the male plant) and Ws-2 (as the female plant). The F1 seeds from each cross were sown individually, and each plant was allowed to self-pollinate. Six or 7 additional cycles of single-seed descent were performed to obtain F7 or F8 seeds. Sixty DNA markers, distributed along all chromosomes at 15-cM intervals, were used to determine genotypes in the RI population.
All RI population plants were analyzed for drought tolerance. Linkage analysis was performed by interval mappingCitation39 as implemented in the program R/qtlCitation40 using the expectation-maximization algorithm.Citation41 The recombination fractions were converted to cM by using the Haldane mapping function.Citation42 Putative QTLs were also detected by R/qtl.
Quantitative PCR analysis
Two-week-old leaves were used for RNA isolation. Guard cell protoplasts and mesophyll protoplasts were isolated from 9-week-old plants according to Pandey et al.Citation43; the overnight large-scale isolation method was used to isolate guard cell protoplasts. Leaf and protoplast RNA was extracted with an RNeasy Plant Mini Kit (Qiagen) and reverse-transcribed into single-strand cDNA using a ReverTra Ace qPCR RT Master Mix with gDNA Remover (Toyobo, Japan). Genomic DNA was extracted from the leaves of 2-week-old plants with a Plant Genomic DNA Extraction Miniprep System (Viogene, USA). Serial dilutions of genomic DNA were used for standard curves for each gene. The cDNA samples and genomic samples were then mixed with KOD SYBR qPCR Mix (Toyobo, Japan). Quantitative PCR analysis (20-μL samples) was performed on a LightCycler 480 (Roche Diagnostics, Basel, Switzerland) as follows: 98°C for 2 min, followed by 55 cycles of 98°C for 10 s, 60°C for 10 s, and 68°C for 1.5 min for At1g12480 and Actin (At3g18780) or for 1 min for Carbonic anhydrase (At3g01500). The expression ratios were calculated as the expression of each gene relative to that of Actin. Primer pairs are shown in the Supplemental Table S2.
Construct preparation and plant transformation
The SLAC1 promoter regions were amplified from Col-0 and Ws-2 genomic DNA by PCR with primers shown in the Supplemental Table S2. The fragments were cloned into pDrive vector (Qiagen), excised by BamHI and XbaI restriction enzymes (at the flanking sites present in the vector) and re-cloned into the same sites of the binary vector pBI101-Hm3.Citation44 The resulting constructs (pSLAC1-Col::GUS and pSLAC1-Ws::GUS) carrying β-glucuronidase (GUS) under the control of the Col-0 or Ws-2 SLAC1 promoter were transformed into Col-0 or Ws-2 plants by the Agrobacterium-mediated floral-dip method. T3 homozygous lines were used for all experiments.
Histochemical GUS staining
Aerial parts of 2-week-old transgenic plants were immersed in staining solution (50 mM sodium hydrogen phosphate buffer solution, pH 7.0, 0.1% (v/v) Triton, 10 mM EDTA, 0.5 mM potassium hexacyanoferrate (II), 0.5 mM potassium hexacyanoferrate (III) and 1 mM 5-bromo-4-chloro-3-indolyl-β-D-glucuronide) and vacuum-infiltrated 3 times (5 min each) in a vacuum desiccator. The samples were then incubated in the staining solution at 37°C for 3 to 5 h, the staining solution was removed and the samples were washed with several changes of ethanol:water:glycerol (7:2:1, v/v/v) to remove chlorophyll. GUS staining was detected under an Olympus BX53 microscope (Olympus, Tokyo, Japan).
Disclosure of Potential Conflicts of Interest
No potential conflicts of interest were disclosed.
Table_S2.pptx
Download MS Power Point (55.2 KB)Table_S1.pptx
Download MS Power Point (188.1 KB)Figure_S4.pptx
Download MS Power Point (65.3 KB)Figure_S3.pptx
Download MS Power Point (79.5 KB)Figure_S2.pptx
Download MS Power Point (69.3 KB)Figure_S1.pptx
Download MS Power Point (77.5 KB)Acknowledgments
We thank Ms Momoko Nakajima (National Institute for Environmental Studies) for her great assistance.
Supplemental Material
Supplemental data for this article can be accessed on the publisher's website.
References
- Stebbins GL. Aridity as a stimulus to plant evolution. Am Nat 1952; 86; 33-44; DOI: 10.1086/281699.
- Whittaker RH. Communities and Ecosystems 1975; Macmillan, New York.
- Alward RD. Grassland vegetation changes and nocturnal global warming. Science 1999; 283:229-31; http://dx.doi.org/10.1126/science.283.5399.229
- Morillon R, Lassalles J-P. Water deficit during root development: effects on the growth of roots and osmotic water permeability of isolated root protoplasts. Planta 2002; 214:392-9; PMID:11855644; http://dx.doi.org/10.1007/s004250100626
- Andrioli KG, Sentelhas PC. Brazilian maize genotypes sensitivity to water deficit estimated through a simple crop yield model. Presq Agropev Bras, Brasilia 2009; 44:653-660.
- Balducci L, Deslauriers A, Giovannelli A, Rossi S, Rathgeber CBK. Effects of temperature and water deficit on cambial activity and woody ring features in Picea mariana saplings. Tree Physiol 2013; Oct;33:1006-17; http://dx.doi.org/ 10.1093/treephys/tpt073
- Weaver J, Albertson F. Resurvey of grasses, forbs, and underground plant parts at the end of the great drought. Ecological Monographs 1943; 13:63-117.
- Boyer JS. Plant productivity and environment. Science 1982; 218:443-8; PMID:17808529; http://dx.doi.org/10.1126/science.218.4571.443
- Bray EA. Plant responses to water deficit. Trends Plant Sci 1997; 2:48-54; http://dx.doi.org/10.1016/S1360-1385(97)82562-9
- Bartels D, Sunkar R. Drought and Salt Tolerance in Plants. Cri RevPlant Sci 2005; 24:23-58; http://dx.doi.org/10.1080/07352680590910410
- Bressan R, Bohnert H, Zhu J. Abiotic stress tolerance : from gene discovery in model organisms to crop improvement. Mol Plant 2009; 2:1-2; PMID: 19529825; http://dx.doi.org/10.1093/mp/ssn097
- Golldack D, Li C, Mohan H, Probst N. Tolerance to drought and salt stress in plants: unraveling the signaling networks. Front Plant Sci 2014; 5:1-10; PMID:24795738; http://dx.doi.org/10.3389/fpls.2014.00151
- Bhatnagar-Mathur P, Vadez V, Sharma KK. Transgenic approaches for abiotic stress tolerance in plants: retrospect and prospects. Plant Cell Rep 2008; 27:411-24; PMID:18026957; http://dx.doi.org/10.1007/s00299-007-0474-9
- Alonso-Blanco C, Aarts MGM, Bentsink L, Keurentjes JJB, Reymond M, Vreugdenhil D, Koornneef M. What has natural variation taught us about plant development, physiology, and adaptation? Plant Cell 2009; 21:1877-96; PMID:19574434; http://dx.doi.org/10.1105/tpc.109.068114
- Hausmann NJ, Juenger TE, Sen S, Stowe KA, Dawson TE, Simms EL. Quantitative trait loci affecting delta13C and response to differential water availibility in Arabidopsis thaliana. Evolution 2005; 59:81-96; PMID:15792229
- McKay JK, Richards JH, Nemali KS, Sen S, Mitchell-Olds T, Boles S, Stahl EA, Wayne T, Juenger TE. Genetics of drought adaptation in Arabidopsis thaliana II. QTL analysis of a new mapping population, KAS-1 x TSU-1. Evolution 2008; 62:3014-26; PMID:18691264; http://dx.doi.org/10.1111/j.1558-5646.2008.00474.x
- Juenger TE, Sen S, Bray E, Stahl E, Wayne T, McKay J, Richards JH. Exploring genetic and expression differences between physiologically extreme ecotypes: comparative genomic hybridization and gene expression studies of Kas-1 and Tsu-1 accessions of Arabidopsis thaliana. Plant, Cell Environ 2010; 33:1268-84; PMID:20302603; http://dx.doi.org/10.1111/j.1365-3040.2010.02146.x
- Monda K, Negi J, Iio A, Kusumi K, Kojima M, Hashimoto M, Sakakibara H, Iba K. Environmental regulation of stomatal response in the Arabidopsis Cvi-0 ecotype. Planta 2011; 234:555-63; PMID: 21553123; http://dx.doi.org/10.1007/s00425-011-1424-x
- Verslues PE, Juenger TE. Drought, metabolites, and Arabidopsis natural variation: a promising combination for understanding adaptation to water-limited environments. Curr Opin Plant Biol 2011; 14:240-5; PMID: 21561798; http://dx.doi.org/10.1016/j.pbi.2011.04.006
- The Arabidopsis Genome Initiative. Analysis of the genome sequence of the flowering plant Arabidopsis thaliana. Nature 2000; 408:796-815; PMID: 11130711; http://dx.doi.org/10.1038/35048692
- Tamaoki M, Matsuyama T, Kanna M, Nakajima N, Kubo A, Aono M, Saji H. Differential ozone sensitivity among Arabidopsis accessions and its relevance to ethylene synthesis. Planta 2003; 216:552-60; PMID:12569396; http://dx.doi.org/10.1007/s00425-002-0894-2
- McKhann HI, Gery C, Bérard A, Lévêque S, Zuther E, Hincha DK, De Mita S, Brunel D, Téoulé E. Natural variation in CBF gene sequence, gene expression and freezing tolerance in the Versailles core collection of Arabidopsis thaliana. BMC Plant Biol 2008; 8:105; PMID:18922165; http://dx.doi.org/10.1186/1471-2229-8-105
- Huang M, Abel C, Sohrabi R, Petri J, Haupt I, Cosimano J, Gershenzon J, Tholl D. Variay tion of herbivore-induced volatile terpenes among Arabidopsis ecotypes depends on allelic differences and subcellular targeting of two terpene synthases, TPS02 and TPS03. Plant Physiol 2010; 153:1293-310. PMID:20463089; http://dx.doi.org/10.1104/pp.110.154864
- Yin L, Fristedt R, Herdean A, Solymosi K, Bertrand M, Andersson MX, Mamedov F, Vener AV, Schoefs B, Spetea C. Photosystem II function and dynamics in three widely used Arabidopsis thaliana accessions. PloS one 2012; 7:e46206; PMID:23029436; http://dx.doi.org/10.1371/journal.pone.0046206
- Brosché M, Merilo E, Mayer F, Pechter P, Puzõrjova I, Brader G, Kangasjärvi J, Kollist H. Natural variation in ozone sensitivity among Arabidopsis thaliana accessions and its relation to stomatal conductance. Plant, Cell Environ 2010; 33:914-25; PMID:20082669; http://dx.doi.org/10.1111/j.1365-3040.2010.02116.x
- Daszkowska-Golec A, Szarejko I. Open or close the gate - stomata action under the control of phytohormones in drought stress conditions. Front Plant Sci 2013; 4:138; PMID:23717320; http://dx.doi.org/10.3389/fpls.2013.00138
- Negi J, Matsuda O, Nagasawa T, Oba Y, Takahashi H, Kawai-Yamada M, Uchimiya H, Hashimoto M, Iba K. CO2 regulator SLAC1 and its homologues are essential for anion homeostasis in plant cells. Nature 2008; 452:483-6; PMID:18305482; http://dx.doi.org/10.1038/nature06720
- Saji S, Bathula S, Kubo A, Tamaoki M, Kanna M, Aono M, Nakajima N, Nakaji T, Takeda T, Asayama M, et al. Disruption of a gene encoding C4-dicarboxylate transporter-like protein increases ozone sensitivity through deregulation of the stomatal response in Arabidopsis thaliana. Plant Cell Physiol 2008; 49:2-10; PMID:18084014; http://dx.doi.org/10.1093/pcp/pcm174
- Vahisalu T, Kollist H, Wang Y-F, Nishimura N, Chan W-Y, Valerio G, Lamminmäki A, Brosché M, Moldau H, Desikan R, et al. SLAC1 is required for plant guard cell S-type anion channel function in stomatal signalling. Nature 2008; 452:487-91; PMID:18305484; http://dx.doi.org/10.1038/nature06608
- Schroeder J, Hagiwara S. Cytosolic calcium regulates ion channels in the plasma membrane of Vicia faba guard cells. Nature 1989; 338:427-30; PMID:2174559; http://dx.doi.org/10.1038/338427a0
- Hedrich R, Busch H, Raschke K. Ca2+ and nucleotide dependent regulation of voltage dependent anion channels in the plasma membrane of guard cells. EMBO J 1990; 9:3889-92; PMID:1701140
- McAinsh M, Brownlee C, Hetherington A. Abscisic acid-induced elevation of guard cell cytosolic Ca2+ precedes stomatal closure. Nature 1990; 2014 Jun 29; 343:186-8; http://dx.doi.org/10.1038/343186a0
- Siegel RS, Xue S, Murata Y, Yang Y, Nishimura N, Wang A, Schroeder JI. Calcium elevation-dependent and attenuated resting calcium-dependent abscisic acid induction of stomatal closure and abscisic acid-induced enhancement of calcium sensitivities of S-type anion and inward-rectifying K channels in Arabidopsis guard cells. Plant J 2009; 59:207-20; PMID:19302418; http://dx.doi.org/10.1111/j.1365-313X.2009.03872.x
- Chen Y-H, Hu L, Punta M, Bruni R, Hillerich B, Kloss B, Rost B, Love J, Siegelbaum SA, Hendrickson WA. Homologue structure of the SLAC1 anion channel for closing stomata in leaves. Nature 2010; 467:1074-80; PMID:20981093; http://dx.doi.org/10.1038/nature09487
- Plesch G, Ehrhardt T, Mueller-Roeber B. Involvement of TAAAG elements suggests a role for Dof transcription factors in guard cell-specific gene expression. Plant J 2001; 28:455-64; PMID:11737782; http://dx.doi.org/10.1046/j.1365-313X.2001.01166.x
- Galbiati M, Simoni L, Pavesi G, Cominelli E, Francia P, Vavasseur A, Nelson T, Bevan M, Tonelli C. Gene trap lines identify Arabidopsis genes expressed in stomatal guard cells. Plant J 2008; 53:750-62; PMID:18036199; http://dx.doi.org/10.1111/j.1365-313X.2007.03371.x
- Yamaguchi-Shinozaki K, Shinozaki K. Organization of cis-acting regulatory elements in osmotic- and cold-stress-responsive promoters. Trends Plant Sci 2005; 10:88-94; PMID:15708346; http://dx.doi.org/10.1016/j.tplants.2004.12.012
- Hirayama T, Shinozaki K. Research on plant abiotic stress responses in the post-genome era: past, present and future. Plant J 2010; 61:1041-52; PMID:20409277; http://dx.doi.org/10.1111/j.1365-313X.2010.04124.x
- Lander ES, Botstein D. Mapping mendelian factors underlying quantitative traits using RFLP linkage maps. Genetics 1989; 121:185-99; PMID:2563713
- Broman KW, Wu H, Sen S, Churchill GA. R/qtl: QTL mapping in experimental crosses. Bioinformatics 2003; 19:889-90; PMID:12724300; http://dx.doi.org/10.1093/bioinformatics/btg112
- Haley CS, Knott SA. A simple regression method for mapping quantitative trait loci in line crosses using flanking markers. Heredity 1992; 69:315-24; PMID:16718932; http://dx.doi.org/10.1038/hdy.1992.131
- Haldane JBS. The combination of linkage values, and the calculation of distances between the loci of linked factors. J Genet 1919; 8:299-309; PMID: http://dx.doi.org/10.1016/j.biortech.2011.07.096
- Pandey S, Wang X-Q, Coursol SA, Assmann SM. Preparation and applications of Arabidopsis thaliana guard cell protoplasts. New Phytologist 2002; 153:517-26; http://dx.doi.org/10.1046/j.0028-646X.2001.00329.x
- Sato Y, Sentoku N, Miura Y, Hirochika H, Kitano H, Matsuoka M. Loss-of-function mutations in the rice homeobox gene OSH15 affect the architecture of internodes resulting in dwarf plants. EMBO J 1999; 18:992-1002; PMID:10022841; http://dx.doi.org/10.1093/emboj/18.4.992
