
Abstract
The development of mature adipocytes from pre-adipocytes is a highly regulated process. CD24 is a glycophosphatidylinositol-linked cell surface receptor that has been identified as a critical cell surface marker for identifying pre-adipocytes that are able to reconstitute white adipose tissue (WAT) in vivo. Here, we examined the role and regulation of CD24 during adipogenesis in vitro. We found that CD24 mRNA and protein expression is upregulated early during adipogenesis in the 3T3-L1 pre-adipocytes and in murine primary pre-adipocytes isolated from subcutaneous and visceral WAT, followed by downregulation in mature adipocytes. CD24 mRNA expression was found to be dependent on increased transcription due to increased promoter activity in response to activation of a pre-existing transcriptional regulator. Furthermore, either intracellular cAMP or dexamethasone were sufficient to increase expression in pre-adipocytes, while both additively increased CD24 expression. Preventing the increase in CD24 expression, by siRNA-mediated knock-down, resulted in fewer mature lipid-laden adipocytes and decreased expression of mature adipogenic genes. Therefore, conditions experienced during adipogenesis in vitro are sufficient to increase CD24 expression, which is necessary for differentiation. Overall, we conclude that the dynamic upregulation of CD24 actively promotes adipogenesis in vitro.
Abbreviations:
- WAT, white adipose tissue
- SVF, stromal vascular fraction
- ADSC, adipose-derived stem cell
- GR, glucocorticoid receptor
- IBMX, 3-isobutyl-1-methylxanthine
- Dex, dexamethasone
- NCS, newborn calf serum
- KRH, krebs-ringer-HEPES bicarbonate buffer
- CHX, cycloheximide
- ActD, actinomycin-D
- BCA, bicinchoninic acid
- adipoq, adiponectin
- PKG, cGMP-dependent protein kinase
Background
Obesity is caused by a positive imbalance in caloric intake vs. expenditure and is exacerbated by environmental and genetic factors.Citation1 White adipose tissue (WAT) plays critical roles in energy balance via storage of excess energy as triglycerides, and in hormonal regulation via secretion of appetite regulating hormones such as adiponectin and leptin.Citation2 WAT can increase in size throughout life due to a combination of increased cell size (hypertrophy) and increased cell number (hyperplasia).Citation2 WAT is composed of multiple cell types including adipocytes, pre-adipocytes, macrophages, lymphocytes, vascular cells, epithelial cells and adipose-derived stem cells (ADSC). WAT is located in multiple depots, including subcutaneous depots beneath the skin and visceral depots surrounding internal organs.
Differentiation of ADSCs or pre-adipocytes into mature lipid-laden adipocytes is a multi-stage process. Pre-adipocytes undergo clonal expansion followed by activation of transcriptional cascades that activate ‘master regulators’ CCAAT enhancer binding protein (C/EBP) α and peroxisome proliferator-activated receptor γ (PPARγ).Citation3-6 In addition, different WAT depots show varying degrees of differentiation potential.Citation2 While the later stages of adipogenesis have been well characterized, the very early molecular events defining pre-adipocyte lineage commitment, as well as the precise identity of the adipocyte progenitors are less well understood.
Mature adipocytes arise from multi-potent mesenchymal stem cells that can differentiate into osteoblasts, myoblasts, and adipocytes.Citation7 Cells committed to the adipocyte lineage arise from the perivascular region within WAT.Citation8 These pre-adipocytes express specific transcription factors, such as ZFP423, and other stem cell associated markers including SCA1 and CD34.Citation7 However, the precise molecular mechanisms that promote early pre-adipocyte lineage commitment are still under intense investigation.
Adipocyte differentiation is regulated by both pro-adipogenic and anti-adipogenic intracellular transcriptional regulators. For example, the transcription factor kruppel-like factor (KLF) 4 acts early during adipogenesis, along with the Krox20 transcription factor, to promote the expression of C/EBPβ and C/EBPδ.Citation9 PPARγ expression is then induced by the activity of C/EBPβ and C/EBPδ, along with KLF6, and can be modified by other regulators.Citation3-6,10 Similarly, C/EBPα expression is induced by the activity of C/EBPβ and C/EBPδ, along with KLF5.Citation3-6,10 C/EBPα and PPARγ expression are both necessary and sufficient to promote adipogenesis,Citation3-6 however, both the increase in pro-adipogenic gene expression and a decrease in anti-adipogenic gene expression are necessary for successful adipogenesis. For example, pre-adipocyte factor 1 (PREF1, also known as DLK1) is an inhibitor of adipocyte differentiation that is highly expressed in pre-adipocytes, but not detected in mature adipocytes.Citation11 PREF1 downregulation by the KLF6 transcription factor is a critical event to allow adipogenesis.Citation12
Adipogenesis is modeled successfully in vitro using either immortalized pre-adipocyte cell lines, such as 3T3-L1, or primary cells isolated from the WAT derived stromal vascular fraction (SVF).Citation2,13 Addition of supraphysiological levels of 3-isobutyl-1-methylxanthine (IBMX), dexamethasone (Dex) and insulin stimulates differentiation and highlights the importance of the cAMP, glucocorticoid and insulin/insulin-like growth factor-1 (IGF-1) signaling pathways in adipocyte development.Citation6 IBMX is a cyclic nucleotide phosphodiesterase inhibitor that dramatically increases intracellular cAMP levels.Citation14 The cAMP signal then activates C/EBPβ gene expression via the CREB transcription factor.Citation13 Dex is a synthetic glucocorticoid that induces gene expression,Citation15 and has been proposed to prime pre-adipocytes for differentiation along the adipogenesis pathway.Citation16 Insulin activates the IGF-1 signaling pathway by recruiting and phosphorylating insulin receptor substrate proteins. This leads to the activation of the phosphatidylinositol-3-kinase pathway, among others.Citation17 This cocktail of factors is essential and sufficient to direct adipogenic differentiation in vitro in both pre-adipocyte cell lines and primary pre-adipocytes.
Previously, a subpopulation of adipocyte progenitor cells was identified with the expression of the cell surface molecule CD24 being critically important for reconstitution of WAT function in vivo but apparently dispensable for adipogenesis in vitro.Citation18 More recently, it was shown that pre-adipocytes lose CD24 expression as they commit to the adipocyte lineage.Citation19 CD24 is a heavily glycosylated glycophosphatidylinositol (GPI)-linked cell surface receptor found on a variety of cell types including cancer cells, precursor B lymphocytes, neurons, epithelial cells, macrophages and pre-adipocytes, among others.Citation20 In general, it is highly expressed on progenitor cells and to a lesser extent on terminally differentiated cells. CD24 can regulate cell survival in a cell- type dependent manner in B lymphocytes, cancer cells, and neurons, as well as regulating activation of T cells and dendritic cells. It is overexpressed in many types of cancers, causing cancer cell growth, proliferation and metastasisCitation21; yet CD24 activation induces apoptosis in precursor B lymphocytes.Citation22 The molecular role of CD24 during pre-adipocyte commitment and adipogenesis is not known.
We hypothesized that if CD24 were an important factor in regulating adipogenesis, then its expression would be actively regulated during differentiation in vitro. Therefore, we analyzed CD24 expression in 3T3-L1 pre-adipocytes and primary pre-adipocytes from 2 different depots to show that CD24 expression is dramatically regulated during the early phases of adipogenesis. We show that this regulation depends on cAMP and glucocorticoid signaling. Moreover, we find that inhibiting CD24 expression during early commitment and differentiation using siRNA significantly reduces adipocyte development and mature adipocyte gene expression. Thus, the dynamic increase in CD24 expression during early adipogenesis is an important functional contributor to adipocyte differentiation in vitro.
Results
CD24 mRNA and protein levels increase at initiation of adipogenesis in vitro
To determine at which stage in adipogenesis CD24 may contribute, we first assessed if the expression level of CD24 changed over the course of adipogenesis. In order to analyze adipogenic-induced changes in gene expression in as many discrete stages as possible, we chose to induce adipogenesis by adding the IBMX/Dex initiation solution 48 h prior to addition of insulin, rather than in one cocktail. We then analyzed the mRNA levels of CD24 and other genes known to be important in adipogenesis in 3T3-L1 pre-adipocyte cell line by quantitative RT-PCR (RT-qPCR) (). We found that the expression of the pre-adipocyte associated gene Pref1 decreased with adipocyte differentiation even though the decrease was not statistically significant by 1-way ANOVA analysis. As expected, Pparγ, Cebpα and adiponectin (Adipoq) expression increased significantly over the course of adipogenesis with the highest expression seen at maturity, demonstrating successful adipocyte development at the transcript level. Strikingly, CD24 expression significantly increased 6 h after adipogenesis was initiated by IBMX + Dex addition, followed by a return to baseline levels 48 h later, coincident with addition of insulin, a stage termed progression.
Figure 1. CD24 and adipogenic mRNA expression over the course of adipogenesis in 3T3-L1 pre-adipocytes. The mRNA expression of CD24 and known adipogenic genes was determined at the indicated stages of the adipogenesis assay (Prol: proliferating pre-adipocytes; Conf: 100% confluent; Init: 6 h after addition of IBMX + Dex; Prog: 6 h after addition of insulin; Mat: 5 days after addition of insulin). Expression levels of Pref1, Pparγ, Cebpα, Adiponectin and CD24 were determined by RT-qPCR followed by normalization to the internal control gene Rplp0. Relative expression levels are shown with respect to levels in proliferating cells. Data is shown as log2 transformed mean ± s.e.m., n = 3-4. Different lower case letters indicate a significant difference at P < 0.05.
To determine if this dynamic change in CD24 mRNA expression also occurred in primary pre-adipocytes undergoing adipogenesis, cells isolated from the SVF of visceral epididymal (eSVF) or subcutaneous inguinal WAT (siSVF) were induced to undergo adipogenesis in culture (). We found that Pref1 expression decreased upon differentiation to mature adipocytes in the eSVF as expected but showed increased expression at progression and maturity cells from siSVF. In the case of Pparγ, both depots had increased expression as cells matured, but siSVF had an earlier and higher response than eSVF cells. Similarly, adiponectin increased by maturity in cells from both depots with an earlier and more profound increase in siSVF. Cebpα expression increased significantly at maturity in siSVF but we did not observe any change in Cebpα from eSVF in the timeframe examined ().
Figure 2. CD24 and adipogenic mRNA expression over the course of adipogenesis in primary cultures from epididymal and inguinal white adipose tissue depots. The mRNA expression of CD24 and known adipogenic genes were determined from pre-adipocytes isolated from visceral epididymal WAT (eSVF) or subcutaneous inguinal WAT (siSVF), at the indicated stages of the adipogenesis assay, as described in . Expression levels of Pref1, Pparγ, Cebpα, Adiponectin and CD24 were determined by RT-qPCR followed by normalization to the internal control gene Rplp0. Relative expression levels are shown with respect to levels in confluent cells. Data is shown as log2 transformed mean ± s.e.m., n = 8. Different letters indicate a significant difference at P < 0.05 (upper case: eSVF, lower case: siSVF).
The expression of CD24 increased dynamically over the course of adipogenesis in cells from both depots (). Cells from the eSVF had increased expression of CD24 on response to addition of IBMX + Dex (initiation) and this increase persisted after the replacement of progression media with insulin. By maturity, the expression returned to levels statistically similar to confluent cells. There was a more dynamic regulation of CD24 in siSVF with significantly increased expression to a higher magnitude than eSVF in response to IBMX + Dex, followed by a swift reversal to initial levels at progression and maturity, in a manner similar to that seen with the 3T3-L1 pre-adipocytes. Strikingly, both the increase and decrease in CD24 expression were more pronounced in pre-adipocytes from siSVF compared to eSVF.
To determine if changes to CD24 mRNA expression correlated with changes to total protein expression, we examined CD24 protein expression levels in the 3T3-L1 cells at different stages of adipogenesis. We found that total CD24 protein levels, as determined by western blot, increased 6 h after initiation of adipogenesis with IBMX + Dex, and remained high for 24 h, followed by a reduction to baseline after addition of insulin containing progression media 48 h later (). Thus, changes to total CD24 protein mirrored the changes in mRNA expression.
Figure 3. Total and surface CD24 protein over the course of adipogenesis in 3T3-L1 cells. (A) Total protein expression of CD24 in 3T3-L1 cells was determined by western blot analysis at the indicated stages of adipogenesis (Conf: 100% confluent; I-6 h: 6 h after addition of IBMX + Dex; I-24 h: 24 h after IBMX + Dex addition; Prog: 6 h after addition of insulin; Mat: 5 days after addition of insulin). Actin is used the loading control and the location of molecular mass standards (kDa) are indicated on the right. One representative of 3 independent experiments is shown. (B) Surface CD24 protein expression in 3T3-L1 cells was detected by flow cytometry using anti-CD24-APC or isotype-APC staining control at the indicated stages of adipogenesis, as above (I-20 h: 20 h after IBMX + Dex). All treated samples are compared to a time-matched untreated confluent control. The dashed line indicates the cut-off for CD24-positive vs. negative cells. One representative experiment is shown. (C) Right panel: The relative surface expression of CD24 was calculated relative to the time matched control using mean fluorescence intensity. Left panel: The percent CD24-positive cells were calculated at each time point. Data shown as mean ± s.e.m., n = 6-7. Different lower case letters indicate a significant difference at P < 0.05.
Since CD24 is a surface protein, we next analyzed surface CD24 surface protein expression using flow cytometry where the mean fluorescent intensity (MFI) at each stage was compared to a time matched confluent control (). We found that the relative level of surface expression increased significantly in response to 20 h, but not 6 h, of IBMX/Dex treatment, remained high throughout progression, and decreased by maturity (). Overall, both the increase and decrease in CD24 surface protein expression was delayed compared to total protein expression and mRNA expression. However, similar to mRNA and total protein, the surface expression levels decreased to control levels by maturity (). We also observed that there was bimodal expression of CD24 with 80% of confluent cells clearly positive for CD24 surface expression (). In response to 20 h of IBMX + Dex treatment, there was a shift in the population so that there was a normal distribution with over 90% cells positive for CD24 expression. The time-matched control also exhibited a shift in population dynamics toward a more uniform distribution of surface CD24 suggesting that culture conditions and time also alter CD24 expression, albeit in a less dramatic manner. The percentage of CD24-positive cells remained high (90.7 ± 0.6%) throughout maturity demonstrating the most cells retain CD24 expression once they acquire it, but at a lower overall level.
To determine if changes to CD24 protein expression also occurred in primary pre-adipocytes, surface CD24 protein was analyzed at select stages of adipogenesis in cells from siSVF since these cells showed a more robust change in CD24 mRNA expression compared to eSVF. We observed that these cells had a clear bimodal distribution of CD24 expression with 43 ± 5% of cells CD24-positive at the confluent stage (). There was an initial decrease in the number of CD24-positive cells with 6 h of IBMX + Dex treatment, which was followed by a significant increase in CD24-positive cells and a loss of the 2 distinct populations at progression (). By maturity, the majority of the cells had become CD24-negative with an overall shift to a normal distribution of surface expression (). Similar to the 3T3-L1 cells, both the increase and decrease in CD24 surface expression was delayed compared to the changes in mRNA. Because of the limited numbers of SVF cells that were collected, we were unable to obtain a time-matched confluent control for every stage and so relative quantitative analysis of surface expression could not be performed. However, there did not appear to be an increase in the expression of CD24 on CD24-positive cells, rather there was a shift in the number of low-expressing or CD24-negative cells to high-expressing cells, and vice versa.
Figure 4. Surface CD24 protein over the course of adipogenesis in primary pre-adipocytes. (A) Surface CD24 protein expression on cells isolated from siSVF was determined by flow cytometry, at select stages of adipogenesis, using the biotinylated anti-CD24 M1/69 antibody. Streptavidin-FITC (Strep-FITC) alone is used as the negative control for staining. One representative experiment is shown. (B) The percent of CD24 + cells from each individual animal (×) and the mean (−) is indicated, n = 4 sets of cells pooled from 2 mice each. Different lower case letters indicate a significant difference at P < 0.05.
cAMP and glucocorticoid signaling cooperate to upregulate CD24 mRNA expression via transcriptional activation
The dynamic increase in CD24 expression in pre-adipocytes has never been described previously, therefore we performed additional characterizations on the regulation of CD24 mRNA by IBMX + Dex treatment. To determine which components of the initiation media are necessary to increase CD24 expression we treated cells with media only, IBMX, Dex or both compounds and CD24 mRNA levels were analyzed (). We found that while treatment with IBMX or Dex significantly increased CD24 expression, treatment with both caused an additive increase in CD24 expression. However, based on the statistical analysis, the induction of IBMX was not significantly differently than the induction by IBMX + Dex, suggesting that IBMX is a stronger activator than Dex.
Figure 5. cAMP and Dex cooperate to increase CD24 mRNA expression in confluent 3T3-L1 pre-adipocytes. Confluent 3T3-L1 cells were treated for 6 h with 10%FBS/DMEM media alone (control), dexamethasone (Dex), IBMX, IBMX + Dex (I/D), insulin (Ins), Forskolin or the inactive Forskolin analog (iForskolin), as indicated. (A, B, D) CD24 mRNA expression was determined by RT-qPCR and normalized to the internal control Rplp0 and calculated relative to levels in control cells. Data is shown as log2 transformed mean ± s.e.m., n = 4. The fold increase of CD24 by Forskolin over iForskolin is indicated. (C) Intracellular cAMP levels were determined by ELISA. Data shown as mean ± s.e.m., n = 3. nd = not detected in the number of samples indicated in parenthesis. Different lower case letters indicate a significant difference at P < 0.05.
We next tested if insulin affected the induction CD24 expression since adipogenesis can be induced if all 3 compounds are added simultaneously. We found that addition of insulin to IBMX + Dex treatment did not affect the IBMX + Dex-mediated increase in CD24 expression (). Therefore, while the addition of both IBMX and Dex is necessary to maximally increase CD24 mRNA levels, insulin does not contribute to either promoting or limiting the increase in CD24.
IBMX treatment increases intracellular cAMP levelsCitation14 and Dex has been shown to inhibit cAMP phosphodiesterase expression at later time points, further increasing cAMP levels.Citation23 Therefore, we assessed the change in cAMP levels in response to IBMX, Dex or both IBMX + Dex (). As expected, IBMX alone substantially increased cAMP levels to a similar level at all time points examined. In contrast, treatment with Dex alone had no effect on cAMP levels at early time points, and a very minimal effect with 4 h of treatment. Importantly, stimulation with both IBMX and Dex did not significantly increase the level of intracellular cAMP compared to IBMX alone at any time point. Therefore, IBMX is mostly likely acting via cAMP while the effect of Dex on CD24 is cAMP-independent.
Next we assessed if an increase in cAMP is sufficient to increase CD24 mRNA expression by treating cells with increasing concentrations of forskolin, which increases intracellular cAMP levels via activation of adenylate cyclase and not phosphodiesterase inhibition.Citation24 We found that treatment with all concentrations of forskolin tested, but not the inactive forskolin analog (1,9-dideoxy-forskolin) or DMSO alone, increased the level of CD24 mRNA to a similar level to that of IBMX + Dex treatment (). The increase in CD24 was maximal at all doses of forskolin tested suggesting that regulation of CD24 expression by cAMP requires a threshold of cAMP concentration that is met at all concentrations of forskolin tested.
Previous studies have shown that CD24 mRNA levels can be regulated by activating transcriptionCitation25,26 or by regulating mRNA stability.Citation27 To determine if the increase in CD24 mRNA requires active transcription, 3T3-L1 cells were pre-treated with actinomycin D (ActD), an inhibitor of RNA synthesisCitation28 for 1 h followed by treatment with IBMX + Dex for 6 h. Treatment with ActD completely blocked the increase in CD24 expression seen with IBMX + Dex treatment (), showing that the initial increase in CD24 mRNA levels requires activation of the transcriptional machinery.
Figure 6. Active transcription, but not de novo protein synthesis, is necessary to induce CD24 expression in response to IBMX + Dex. A-C. Expression of CD24 mRNA was determined by RT-qPCR and were normalized to the internal control Rplp0 and calculated relative to levels in cells treated with DMSO (not shown). (A) Confluent 3T3-L1 cells were treated with actinomycin-D (ActD) for 1 h to inhibit transcription, followed by IBMX + Dex (I/D) 6 h. n = 3-4, (B) Confluent 3T3-L1 cells were treated with I/D for 6 h followed by ActD for 6 h. Data are shown as log2 transformed mean ± s.e.m., n = 3, (C) Confluent 3T3-L1 cells treated with cyclohexamide (CHX) for 1 h, followed by I/D for 6 h. Data are shown as log2 transformed mean ± s.e.m., n = 5. (D) 3T3-L1 cells were transfected with pGL4.17 reporter vector, with or without the indicated CD24 promoter, along with the pRL-SV40 transfection control vector. Cells were stimulated for 24 h as indicated and promoter activity calculated as relative expression of Firefly/Renilla in response to I/D stimulation compared to DMSO treated cells. Data are mean ± s.e.m., n = 3.*P < 0.05.
Even though active transcription was found to be necessary to increase CD24 mRNA levels initially, there is still the possibility that maintenance of high levels are in response to decreased mRNA degradation. Therefore, to determine if active transcription is also necessary to maintain CD24 mRNA levels, 3T3-L1 cells were first treated with IBMX + Dex for 6 h to raise CD24 levels followed by treatment with ActD to inhibit further transcription (). There was a substantial and significant decrease in CD24 levels in the absence of active transcription, indicating that transcription is also necessary for the maintenance of CD24 transcript levels.
Activation of transcription factors can occur via increased expression of a transcriptional activator or via post-translation modification to a pre-existing transcriptional activator. To determine which one of these possibilities is the case for CD24, 3T3-L1 cells were pre-treated with cycloheximide (CHX), which blocks translational elongationCitation29 for 1 h followed by treatment with IBMX + Dex for 6 h. We found that addition of CHX did not reduce the IBMX + Dex-mediated increase in CD24 expression (). We observed a significant increase in CD24 expression following treatment with CHX alone, which is consistent with the response of other early response genes to CHX treatment.Citation30,31 Therefore, the increase in CD24 mRNA expression does not require de novo protein synthesis and is most likely due to activation of a pre-existing regulatory protein.
Lastly, we analyzed the response of the CD24 promoter region immediately upstream of the transcriptional start site (). We found IBMX + Dex treatment caused a significant increase in promoter activity compared to the control treatment as measured by luciferase production. Together, these data demonstrate that IBMX + Dex induces transcription of CD24, most likely through activation of a pre-existing transcription factor binding to the CD24 promoter.
Increased CD24 expression is necessary for mature adipocyte formation
The dynamic increase in CD24 early during adipogenesis suggests that this increase in CD24 may contribute to the regulation of adipogenesis. To determine if CD24 regulates adipogenesis, we transfected proliferating 3T3-L1 pre-adipocytes with siRNA to block the IBMX + Dex-induced increase in CD24 expression (). We confirmed that CD24 mRNA levels were decreased in response to CD24 siRNA at all 3 stages examined (confluent, initiation, and maturity), with the knock-down of mRNA showing statistical significance at initiation and with a trend toward significance at maturity (). Analysis of CD24 protein surface expression revealed a significant decrease in the percentage of cells expressing CD24 at both confluent and initiation stages (). Furthermore, as measured by relative MFI, siRNA treatment significantly reduced the level of surface expression by 32 ± 7% (P < 0.01) in confluent cells and 54 ± 4% (P < 0.001) 20 h after addition of IBMX + Dex. Overall, cells that retained CD24 expression did so at a lower level (). Therefore, the dynamic increase in CD24 expression in response to IBMX + Dex was severely and significantly blunted at both the mRNA and protein levels.
Figure 7. An increase in CD24 mRNA expression is necessary for adipocyte differentiation. (A) Proliferating 3T3-L1 cells were transfected with scrambled control siRNA or CD24 siRNA, and then induced to undergo adipogenesis as described for . The mRNA expression of CD24 was determined by RT-qPCR when cells were confluent (Conf), 6 h after addition of IBMX + Dex (Init) and 5 days after addition of insulin (Mat). CD24 expression was normalized to the internal control gene Rplp0 and relative expression levels are shown with respect to levels in confluent control siRNA cells. Data shown as log2 transformed mean ± s.e.m., n = 7. (B) Surface CD24 protein expression was determined by flow cytometry in confluent cells (confl), and 20 h after addition of IBMX + Dex (I-20 h). Percent CD24-positive cells are shown as mean ± s.e.m., n = 3. (C) Intracellular lipid was stained with Oil Red O and cells imaged. Scale bar = 200 μm. One representative field of view of 5 independent experiments is shown. (D) Quantification of Oil Red O shown as mean ± s.e.m., n = 4. *P < 0.05, **P < 0.01.
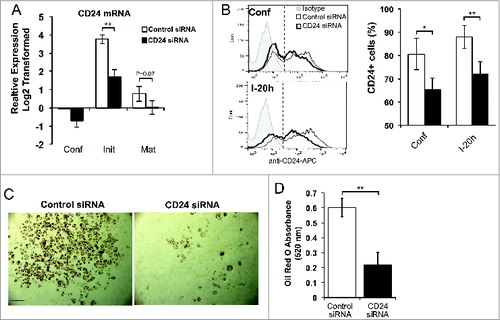
We found that this reduced expression of CD24 substantially reduced the development of mature adipocytes as assessed visually by overall lipid accumulation at maturity (), which was revealed to be statistically significant by quantification of Oil Red O staining ().
We then analyzed the effect of blunting the increase in CD24 on the changes in adipogenic gene expression (). We found that expression of the late adipogenic genes Pparγ, Cebpα, and adiponectin were substantially and significantly decreased, but not completely abrogated, at maturity in the CD24 knock-down cells. In addition, Cebpα expression at initiation was reduced to below the amount expressed in a confluent cells, to a degree that approached statistical significance. Surprisingly, the expression of Pref1 was found to be significantly increased at maturity with CD24 knock-down. Together, these data suggest that overall gene expression associated with adipogenic development was altered. Thus, we can conclude that the increase in CD24 expression that normally occurs early during adipogenesis in response to IBMX + Dex treatment is necessary for maximum differentiation but that a reduced level of adipocyte gene expression induction can still occur.
Figure 8. An increase in CD24 mRNA expression is necessary to increase mature adipocyte gene expression and decrease Pref-1 expression. The mRNA expression of Pref1, Pparγ, Cebpα, and Adiponectin was determined from cells that had been transfected with scrambled control siRNA or CD24 siRNA as for . mRNA levels were determined by RT-qPCR when cells were confluent (Conf), 6 h after addition of IBMX + Dex (Init) and 5 days after addition of insulin (Mat) followed by normalization to the internal control gene Rplp0. Relative expression levels are shown with respect to levels in confluent cells. Data shown as log2 transformed mean ± s.e.m., n = 4. *P < 0.05, **P < 0.01.
Discussion
Here, we show for the first time that the expression of CD24 is dynamically regulated at the mRNA and protein levels during adipogenesis in the 3T3-L1 pre-adipocyte cell line and in primary pre-adipocytes. This increase in CD24 mRNA is driven by activation of transcription from the CD24 promoter and is dependent on activation of a pre-existing transcriptional regulatory protein. Furthermore, increasing intracellular cAMP or Dex treatment was sufficient to increase CD24 mRNA levels, with these factors acting additively to cause the maximal increase in CD24 mRNA expression. Lastly, we demonstrate that this dynamic upregulation of CD24 is necessary for the formation of mature adipocytes and to allow maximal expression of mature adipogenic genes, as well as downregulation of the pre-adipocyte gene Pref1.
We observed that the increase in CD24 expression preceded the increased expression of known adipogenic genes Pparγ, Cebpα and adiponectin in both 3T3-L1 cells and primary cells. In addition, the increase in CD24 expression preceded the decrease in Pref1 expression. Therefore, the initial regulation of CD24 expression occurs in a very early stage in the differentiation process. The increase in surface CD24 protein was delayed compared to the upregulation of either total protein or mRNA. This delay is consistent with the requirement for transcription followed by subsequent post-transcriptional modifications of CD24, including addition of the GPI-anchor and glycosylations known to be present on surface CD24.Citation20
We observed a rapid increase, then decrease, in CD24 expression in both 3T3-L1 and siSVF cells while eSVF cells had a rapid increase but delayed, gradual decrease in expression. In addition to differences in CD24 regulation, we also observed several differences in the regulation of adipogenic gene expression between 3T3-L1 pre-adipocytes and those isolated from siSVF and eSVF. We observed that eSVF pre-adipocytes show a similar trend as the 3T3-L1 cell line with respect to the downregulation of Pref1, which are consistent with published data.Citation11,32 In contrast, siSVF had a significant increase in Pref1 expression, which is maintained once cells reach maturity. It is unclear why Pref1 expression increases in siSVF cultures in correlation with the increase in mature adipogenic genes since Pref1 is known to inhibit adipogenesis.Citation11,32 However, this may be due to the fact that the cells isolated from WAT depots are heterogeneous and therefore contain cells that are at various stages of commitment along the adipocyte lineage. Subcutaneous WAT possess more adipogenic progenitors than visceral WAT depots,Citation33-35 which is consistent with our observed increase in the expression of late adipogenic markers in siSVF compared to eSVF. Therefore, an increase in ADSC in siSVF could result in an increase and then decrease in Pref1 expression as these cells commit to the adipocyte lineage.
All 3 types of cells showed the expected increase in PPARγ expression, however, cells from siSVF displayed an earlier and more substantial increase than either of the other cell types, similar to previous reports.Citation33,35 Unexpectedly, in eSVF cells we only observed a modest increase in adiponectin expression and no increase in Cebpα expression, while both of these genes showed a robust regulation in both 3T3-L1 and siSVF cells. The loss of Pref1, absence of Cebpα increase, and maintenance of CD24 in eSVF suggest there may be an arrest of cells in an earlier stage of differentiation that prevents or delays the differentiation of these cells, and therefore impedes the acquisition of PPARγ and adiponectin. It is important to note, that the mature cells were sampled only 5 days after addition of insulin, and it has been consistently reported that pre-adipocytes can continue to differentiate for up to 10 days after addition of insulin (e.g.Citation16,33,36). Therefore, it is likely we are observing a delay in differentiation of the eSVF cultures compared to siSVF and 3T3-L1 pre-adipocytes. Nevertheless, together these data support earlier conclusions that subcutaneous pre-adipocytes have more differentiation potential than visceral pre-adipocytes and that this difference is maintained at the gene expression level.Citation2 Moreover, with the exception of Pref1, 3T3-L1 cells appear to model the changes in gene expression of siSVF more closely than eSVF.
We found that increasing cAMP, by addition of IBMX or Forskolin, or the addition of Dex were sufficient to increase CD24 expression with these messengers acting additively to maximal increase expression during initiation of adipogenesis. The primary role of IBMX, identified thus far, appears to be to activate the CREB transcription factor, which in turn activates C/EBPβ to drive Cebpα and PPARγ expression.Citation13 Dex, on the other hand, activates the GR and appears to prime pre-adipocytes to undergo further differentiation and acts either prior to, or simultaneously with, the actions of IBMX.Citation16 However, 3T3-L1 cells can be directed toward the osteoblastic lineage under specific conditions,Citation37 a process which also requires Dex but has no reported association with CD24 expression. Therefore, the additive effect of IBMX and Dex on CD24 expression may be to increase CD24 expression above an undefined threshold that contributes to adipocyte lineage commitment and subsequent differentiation.
Here, we demonstrate that active transcription is necessary for both the initial increase and to maintain high levels of CD24 mRNA levels in response to IBMX + Dex. Furthermore, although we found a partial increase in CD24 mRNA with CHX treatment alone, there was no reduction in IBMX + Dex-induced increase in CD24 mRNA when protein synthesis was inhibited by CHX treatment. Therefore, we can conclude that protein synthesis is not necessary for the IBMX + Dex induced transcription of CD24. Furthermore, the CD24 promoter region was responsive to IBMX + Dex. These data suggest that activation of a pre-existing regulatory protein, most likely a transcription factor, causes the increase in CD24 promoter activity resulting in increased mRNA levels. There are several transcription factors that can regulate CD24 expression, such NFAT5 (also known as TonEBP), which upregulates CD24 expression in T-lymphocytesCitation38 and TWIST1, which downregulates CD24 expression in breast cancer cells,Citation25 however it is not clear which, if either of these, regulates CD24 in response to IBMX + DEX. Therefore, studies are currently ongoing to determine the precise identity of the signaling molecules and transcription factor(s) responsible for regulating CD24 expression.
Rodeheffer et al.Citation18 established CD24 as a lineage marker for pre-adipocytes that were able to reconstitute fat pads in vivo but was dispensable for in vitro adipogenesis. As we show here, the addition of IBMX + Dex increases the expression level of CD24 mRNA and protein in both 3T3-L1 cells and primary pre-adipocytes. Furthermore, in primary pre-adipocytes we observed a clear decrease in the CD24-negative population of cells upon stimulation of adipogenesis in vitro, clearly demonstrating that CD24-negative cells can acquire CD24 expression in vitro. This dynamic regulation of CD24 has also been observed in cancer cells.Citation39 Therefore, the ability of sorted CD24-negative pre-adipoctyes to undergo adipogenesis in vitro can be explained by the induction of CD24 expression in response to IBMX + Dex during the in vitro adipogenesis assay. In contrast, in vivo acquisition of CD24 after injection of sorted CD24-negative cells into A-Zip mice may not have occurred in the absence of substantial and local increases in, as of yet undefined, extracellular mediators that can activate intracellular cAMP and GR.
The precise role of CD24 in regulating adipogenesis is not clear. The dynamic increase in expression that occurred early during differentiation with reduced expression by maturity in all 3 cell types suggests that CD24 is acting very early in the in vitro differentiation process. Prevention of the early increase in expression by siRNA resulted in a severe reduction in overall adipogenesis as measured by lipid accumulation and a significant reduction in the expression of mature adipogenic genes. This suggests that either CD24 serves as a modifier for adipogenesis to allow early changes in the differentiation process or that the low levels of CD24 remaining in the siRNA-treated cells are sufficient to allow for some maturation to occur. Future analysis to track CD24 expression and subsequent differentiation at the single cell level may reveal if the degree of increase in CD24 expression correlates with adipogenesis in a cell autonomous manner, in order to distinguish between these possibilities.
Work in developing B lymphocytes, has shown that CD24 controls the development of hematopeiotic cells past an early checkpoint after B lymphocyte lineage commitment,Citation40,41 with CD24 demonstrating a similar rise and fall in expression over the course of development.Citation42 While the development of early adipocytes has not been staged as finely as with B lymphocytes, the similarity in expression profiles early during pre-adipocyte development shown here and previously,Citation19 as well as our finding that the increase in CD24 expression is necessary for full differentiation, suggests that CD24 may be playing a similar role in controlling a developmental checkpoint in pre-adipocyte commitment.
In summary, this work demonstrates that upregulation of CD24 early during in vitro adipogenesis is a dynamic process that actively promotes adipogenesis.
Materials and Methods
Cell lines, mice, and antibodies
The 3T3-L1 pre-adipocyte cell line was purchased from ATCC (Manassas, VA, USA). Male C57BL/6 mice were purchased from Charles River (Wilmington, MA, USA) and used between 3 and 6 weeks of age. All animal use was approved the Institutional Animal Use and Care Committee at Memorial University.
For protein gel blot, the antibodies (Abs) against CD24 (HIS50) and actin, and all secondary Abs were purchased from Santa Cruz Biotechnology, Inc. For FACS analysis, biotinylated anti-CD24 M1/69 antibody, streptavidin-FITC, anti-CD24 M1/69-APC and the isotype control Rat IgG-APC were purchased from eBioscience, Inc.
Adipogenesis assay
All media and supplements were obtained from Life Technologies Co., unless otherwise indicated. 3T3-L1 cells were maintained in high-glucose DMEM supplemented with 10% newborn calf serum and 1% antibiotic/antimycotic (DMEM/NCS). 3T3-L1 cells were grown to confluency in 6-well (for western blot or FACS analysis) or 12-well plates (for RNA analysis), for 24 h prior to further manipulations.
To initiate adipogenesis, initiation media containing 0.5 mM IBMX and 1 μM Dex (Millipore) in DMEM supplemented with 10% FBS and 1% antibiotic/antimycotic (DMEM/FBS) was added to the cells 48 h post-confluency. Media was replaced with 10 μg/ml insulin (Sigma-Aldrich) in DMEM/FBS (progression media) 48 h later followed by replacement with DMEM/FBS 48 h later. Cells were maintained in this media for 5 days, replacing the media every 2 days, at which time ≥40% of cells were visually verified to have accumulated lipid droplets. As negative controls for adipogenesis, 3T3-L1 cells were maintained in DMEM/NCS while untreated SVF cultures were maintained in DMEM/FBS.
Cells were lysed in Trizol (Life Technologies) for mRNA analysis, or RIPA lysis buffer (50 mM Tris-HCl, 0.02% w/v NaN3, 0.5% w/vsodium deoxycholate, 0.1% w/v SDS, 1% w/v NP-40, 150 mM NaCl, 1 mM PMSF, 1 mM sodium orthovanadate, 1 ug/ml aprotinin, 1× HALT Phosphatase inhibitor [Thermoscientific]) for protein gel blot analysis.
When indicated, confluent cells were treated with the appropriate vehicle controls, forskolin or inactive forskolin (Millipore) at various concentrations (1, 2.5, 10, or 20 μM), 20 μg/ml of cycloheximide (CHX) (Millipore), or 1 μg/ml of actinomycin (ActD) (Millipore) in DMEM/FBS.
Isolation and culture of primary pre-adipocytes
The stromal vascular fraction (SVF) was isolated from subcutaneous WAT from the inguinal hindlimb depot or visceral WAT from the epididymal depot followed by digestion with 15 μg/ml Collagenase type 1 (Life Technologies) in Krebs-Ringer-HEPES bicarbonate buffer (pH 7.4) containing 200 nM adenosine and 1% bovine serum albumin (KRH) for 1 h at 37°C [modified fromCitation43]. Tissue debris was removed by filtering through a 100 μm mesh and the SVF collected by centrifuging for 5 minutes at 400 × g. The cells were washed 3 times in KRH buffer, plated in DMEM/FBS, and then grown until confluency in 10 cm plates (for FACS analysis) or in 6-well plates (for RNA isolation).
RNA isolation, DNase treatment and cDNA synthesis
RNA was isolated using Trizol (Life Technologies), contaminating DNA removed with TURBO DNase (Life Technologies) and cDNA synthesized from 500 ng of RNA using MMLV-RT (Life Technologies), following the manufacturer's protocols.
Quantitative reverse transcriptase PCR (RT-qPCR)
Fermentas Maxima SYBR Green qPCR Master Mix (2×) (ThermoScientific) was used to carry out quantititative Reverse Transcriptase PCR (RT-qPCR) from 10 ng of cDNA in an Eppendorf Mastercycler instrument. Forward (F) and Reverse (R) primer sequences, amplification efficiencies (E) and amplicon sizes (S) used for each gene are as follows: Cd24 (E = 1.07, S = 109 bp), F: 5′-ACT CAG GCC AGG AAA CGT CTC T-3′, R: 5′-AAC AGC CAA TTC GAG GTG GAC-3′; Rplp0 (E = 1.03, S = 101 bp), F: 5′-TCA CTG TGC CAG CTC AGA AC-3′, R: 5′-AAT TTC AAT GGT GCC TCT GG-3′; Pref1 (E = 1.01, S = 182 bp), F: 5′- CCC CCT TCG TGG TCC GCA AC-3′, R: 5′-GGT GGG TCG CAT TCA GCC CC-3′; Cebpα (E = 1.00, S = 127 bp), F: 5′-TGG ACA AGA ACA GCA ACG AG-3′, R: 5′-TCA CTG GTC AAC TCC AGC AC-3′; Pparγ (E = 1.00, S = 145 bp), F: 5′-TGT TAT GGG TGA AAC TCT GGG-3′, R: 5′-AGA GCT GAT TCC GAA GTT GG-3′;
Adipoq (E = 1.00, S = 192 bp), F: 5′-GTT GCA AGC TCT CCT GTT CC-3′, R: 5′-TCT CCA GGA GTG CCA TCT CT-3′. Ct values were analyzed for relative quantity after 40 cycles according to the equation described by Pfaffl.Citation44 All primer sets were validated and primer efficiencies determined according to the MIQE guidelines.Citation45
Western blot
Protein concentration was determined using the Bicinchoninic Acid (BCA) Protein Assay Reagent (ThermoScientific) according to the manufacturer's protocol and 20 μg of protein was run on a 10% SDS-PAGE gel followed by transfer to nitrocellulose membranes. Antibodies were diluted in TBST+ 5% skim milk as follows: CD24 (HIS50) 1:500, actin 1:2000. goat-anti-rabbit IgG-HRP 1:2000, and goat-anti-mouse IgM-HRP 1:2000. Immobilon Western Chemiluminescent HRP Substrate (Millipore) was used for signal detection. Images were acquired using an AlphaImager Gel Documentation system with FluorChem HD2 software, version 3.4.0. Image manipulation was limited to adjustments to brightness and contrast of the entire image.
FACS analysis
Cells were recovered by scraping into cold FACS buffer (1.9 mM NaH2PO4, 8.4 mM Na2HPO4, 0.15 mM NaCl, pH 7.2 with 1% heat inactivated FBS) at the indicated stages of adipogenesis. All following incubations were at 4°C in the dark. 3T3-L1 cells were washed 3 times in FACS buffer followed by incubation of 0.5 μg of APC-labeled M1/69 antibody or isotype control per 1 × 10⁶ cells for 30 minutes. Cells from siSVF were washed 3 times in FACS buffer followed by incubation with or without 0.5 μg of biotinylated M1/69 antibody per 1 × 10⁶ cells for 30 minutes in the dark, then 3 washes in FACS buffer, followed by a 30 min incubation with 0.5 μg Streptavidin-FITC for 30 min. In both cases, following an additional 3 washes in cold FACS buffer, cells were fixed at room temperature in 100 μl of IC Fixation buffer (eBioscience) for 20 minutes and then diluted with 500 μl of FACS buffer and stored at 4°C in the dark until run on a BD FACSCalibur using Cell Quest Pro software. Data were analyzed by FlowJo v10 (TreeStar Inc.).
cAMP analysis
3T3-L1 cells were lysed in 1% Triton X-100 in 0.1 M HCl. cAMP concentrations were determined using the direct cAMP ELISA kit (ENZO Life Sciences, Inc.) following the manufacturer's instructions.
Luciferase reporter assay
The CD24 promoter, as defined by the location corresponding to the transcription start site, was amplified with the GC-RICH Primer system (Roche, Indianapolis, IN, USA) using the following primers: Forward −688 to -666: 5′- GTT GGA TGC TCC CGG GTA TGG -3′, Reverse +1 to −20: 5′ – GGA GCG CGG CCG GCC GGC GG -3′ and then cloned into the BglII and HindIII sites upstream of the luciferase gene in the pGL4.17 reporter vector (Promega). All sequences were verified by sequence analysis. Proliferating 3T3-L1 cells were transfected with 0.5 μg of the pGL4.17 with or without the CD24 promoter and 20 ng pRL-SV40 vector using Jetprime (Polyplus Transfection) according to the manufacturer's protocol. After 24 h of transfection, the media was replaced with fresh DMEM/NCS for 6 h followed by treatment with DMSO, or 0.5 mM IBMX and 0.1 μM Dex, in DMEM/FBS for 24 h. Cells were lysed with 1× passive lysis buffer and assayed for Firefly and Renilla Luciferase activities using the Dual-Luciferase reporter assay kit (Promega) according to the manufacturer's instructions.
siRNA knock down of CD24 and lipid staining in 3T3-L1 cells
3T3-L1 cells were transfected with 100 nmol of siRNA for CD24 (MMC.RNAI.N009846.12.1, IDT, Coralville, Iowa) or 100 nmol of control scrambled siRNA (51-01-19-08, IDT) using a combination of Jetprime (4 μl) and Interferin (2 μl) (PolyPlus Transfection) according to the manufacturer's protocol for Jetprime. Mature adipocytes were stained with 0.36% Oil Red O in 60% isopropanol, following the instructions from the Adipogenesis Assay Kit (Millipore), 5 days after addition of insulin. Images taken using the Axio PrimoVert inverted microscope with an AxioCam HR Rev3 using AxioVision software v 4.8.2.0 (Carl Zeiss Microscopy). Image manipulation was limited to adjustments to brightness and contrast of both images equally. Extracted Oil Red O was quantified at 520 nm.
Statistic analysis
Statistical analysis was performed using a one-way ANOVA followed by a Tukey post hoc test if significant, using R, version 3,Citation46 when comparing more than 2 samples. If comparing 2 samples, the Student's t-test was used (Excel, version 14.1.0). Differences were considered significant at P < 0.05.
Disclosure of Potential Conflicts of Interest
No potential conflicts of interest were disclosed.
Acknowledgments
We thank Sukhinder Cheema for helpful discussions and sharing of reagents. We gratefully acknowledge the technical contributions of Shamara Alexander and Lisa Pinto.
Funding
This work was funded by the Research and Development Corporation (RDC) of Newfoundland and the Canadian Institutes of Health Research (CIHR) Institute of Nutrition, Metabolism and Diabetes.
References
- Chaput JP, Doucet E, Tremblay A. Obesity: a disease or a biological adaptation? An update. Obesity Rev 2012; 13:681-91; PMID:22417138; http://dx.doi.org/10.1111/j.1467-789X.2012.00992.x
- Berry DC, Stenesen D, Zeve D, Graff JM. The developmental origins of adipose tissue. Development 2013; 140:3939-49; PMID:24046315; http://dx.doi.org/10.1242/dev.080549
- Lin FT, Lane MD. Antisense CCAAT/enhancer-binding protein RNA suppresses coordinate gene expression and triglyceride accumulation during differentiation of 3T3-L1 preadipocytes. Genes Dev 1992; 6:533-44; PMID:1373117; http://dx.doi.org/10.1101/gad.6.4.533
- Lin FT, Lane MD. CCAAT/enhancer binding protein alpha is sufficient to initiate the 3T3-L1 adipocyte differentiation program. Proc Natl Acad Sci U S A 1994; 91:8757-61; PMID:8090719; http://dx.doi.org/10.1073/pnas.91.19.8757
- Rosen ED, Sarraf P, Troy AE, Bradwin G, Moore K, Milstone DS, Spiegelman BM, Mortensen RM. PPAR gamma is required for the differentiation of adipose tissue in vivo and in vitro. Mol Cell 1999; 4:611-7; PMID:10549292; http://dx.doi.org/10.1016/S1097-2765(00)80211-7
- Rosen ED, MacDougald OA. Adipocyte differentiation from the inside out. Nat Rev Mol Cell Biol 2006; 7:885-96; PMID:17139329; http://dx.doi.org/10.1038/nrm2066
- Cawthorn WP, Scheller EL, MacDougald OA. Adipose tissue stem cells meet preadipocyte commitment: going back to the future. J Lipid Res 2012; 53:227-46; PMID:22140268; http://dx.doi.org/10.1194/jlr.R021089
- Tang W, Zeve D, Suh JM, Bosnakovski D, Kyba M, Hammer RE, Tallquist MD, Graff JM. White fat progenitor cells reside in the adipose vasculature. Science 2008; 322:583-6; PMID:18801968; http://dx.doi.org/10.1126/science.1156232
- Birsoy K, Chen Z, Friedman J. Transcriptional regulation of adipogenesis by KLF4. Cell Metab 2008; 7:339-47; PMID:18396140; http://dx.doi.org/10.1016/j.cmet.2008.02.001
- Wu Z, Wang S. Role of kruppel-like transcription factors in adipogenesis. Dev Biol 2013; 373:235-43; PMID:23142072; http://dx.doi.org/10.1016/j.ydbio.2012.10.031
- Smas CM, Sul HS. Pref-1, a protein containing EGF-like repeats, inhibits adipocyte differentiation. Cell 1993; 73:725-34; PMID:8500166; http://dx.doi.org/10.1016/0092-8674(93)90252-L
- Li D, Yea S, Li S, Chen Z, Narla G, Banck M, Laborda J, Tan S, Friedman JM, Friedman SL, et al. Kruppel-like factor-6 promotes preadipocyte differentiation through histone deacetylase 3-dependent repression of DLK1. J Biol Chem 2005; 280:26941-52; PMID:15917248; http://dx.doi.org/10.1074/jbc.M500463200
- Tang QQ, Lane MD. Adipogenesis: from stem cell to adipocyte. Annu Rev Biochem 2012; 81:715-36; PMID:22463691; http://dx.doi.org/10.1146/annurev-biochem-052110-115718
- Essayan DM. Cyclic nucleotide phosphodiesterases. J Allergy Clin Immunol 2001; 108:671-80; PMID:11692087; http://dx.doi.org/10.1067/mai.2001.119555
- Chapman AB, Knight DM, Ringold GM. Glucocorticoid regulation of adipocyte differentiation: hormonal triggering of the developmental program and induction of a differentiation-dependent gene. J Cell Biol 1985; 101:1227-35; PMID:3900088; http://dx.doi.org/10.1083/jcb.101.4.1227
- Pantoja C, Huff JT, Yamamoto KR. Glucocorticoid signaling defines a novel commitment state during adipogenesis in vitro. Mol Biol Cell 2008; 19:4032-41; PMID:18653467; http://dx.doi.org/10.1091/mbc.E08-04-0420
- Hemati N, Ross SE, Erickson RL, Groblewski GE, MacDougald OA. Signaling pathways through which insulin regulates CCAAT/enhancer binding protein alpha (C/EBPalpha) phosphorylation and gene expression in 3T3-L1 adipocytes. Correlation with GLUT4 gene expression. J Biol Chem 1997; 272:25913-9; PMID:9325324; http://dx.doi.org/10.1074/jbc.272.41.25913
- Rodeheffer MS, Birsoy K, Friedman JM. Identification of white adipocyte progenitor cells in vivo. Cell 2008; 135:240-9; PMID:18835024; http://dx.doi.org/10.1016/j.cell.2008.09.036
- Berry R, Rodeheffer MS. Characterization of the adipocyte cellular lineage in vivo. Nat Cell Biol 2013; 15:302-8; PMID:23434825; http://dx.doi.org/10.1038/ncb2696
- Fang X, Zheng P, Tang J, Liu Y. CD24: from A to Z. Cell Mol Immunol 2010; 7:100-3; PMID:20154703; http://dx.doi.org/10.1038/cmi.2009.119
- Lee JH, Kim SH, Lee ES, Kim YS. CD24 overexpression in cancer development and progression: a meta-analysis. Oncol Rep 2009; 22:1149-56; PMID:19787233
- Suzuki T, Kiyokawa N, Taguchi T, Sekino T, Katagiri YU, Fujimoto J. CD24 induces apoptosis in human B cells via the glycolipid-enriched membrane domains/rafts-mediated signaling system. J Immunol 2001; 166:5567-77; PMID:11313396; http://dx.doi.org/10.4049/jimmunol.166.9.5567
- Ahlstrom M, Pekkinen M, Huttunen M, Lamberg-Allardt C. Dexamethasone down-regulates cAMP-phosphodiesterase in human osteosarcoma cells. Biochem Pharmacol 2005; 69:267-75; PMID:15627479; http://dx.doi.org/10.1016/j.bcp.2004.09.012
- de Souza NJ, Dohadwalla AN, Reden J. Forskolin: a labdane diterpenoid with antihypertensive, positive inotropic, platelet aggregation inhibitory, and adenylate cyclase activating properties. Med Res Rev 1983; 3:201-19; PMID:6345959; http://dx.doi.org/10.1002/med.2610030205
- Vesuna F, Lisok A, Kimble B, Raman V. Twist modulates breast cancer stem cells by transcriptional regulation of CD24 expression. Neoplasia 2009; 11:1318-28; PMID:20019840
- Wenger RH, Rochelle JM, Seldin MF, Kohler G, Nielsen PJ. The heat stable antigen (mouse CD24) gene is differentially regulated but has a housekeeping promoter. J Biol Chem 1993; 268:23345-52; PMID:8226859
- Zhou Q, Guo Y, Liu Y. Regulation of the stability of heat-stable antigen mRNA by interplay between two novel cis elements in the 3' untranslated region. Mol Cell Biol 1998; 18:815-26; PMID:9447978
- Sobell HM. Actinomycin and DNA transcription. Proc Natl Acad Sci U S A 1985; 82:5328-31; PMID:2410919; http://dx.doi.org/10.1073/pnas.82.16.5328
- Schneider-Poetsch T, Ju J, Eyler DE, Dang Y, Bhat S, Merrick WC, Green R, Shen B, Liu JO. Inhibition of eukaryotic translation elongation by cycloheximide and lactimidomycin. Nature Chem Biol 2010; 6:209-17; http://dx.doi.org/10.1038/nchembio.304
- Hershko DD, Robb BW, Wray CJ, Luo GJ, Hasselgren PO. Superinduction of IL-6 by cycloheximide is associated with mRNA stabilization and sustained activation of p38 map kinase and NF-kappaB in cultured caco-2 cells. J Cell Biochem 2004; 91:951-61; PMID:15034930; http://dx.doi.org/10.1002/jcb.20014
- Newton R, Adcock IM, Barnes PJ. Superinduction of NF-kappa B by actinomycin D and cycloheximide in epithelial cells. Biochem Biophys Res Commun 1996; 218:518-23; PMID:8561789; http://dx.doi.org/10.1006/bbrc.1996.0093
- Wang Y, Kim KA, Kim JH, Sul HS. Pref-1, a preadipocyte secreted factor that inhibits adipogenesis. J Nutr 2006; 136:2953-6; PMID:17116701
- Baglioni S, Cantini G, Poli G, Francalanci M, Squecco R, Di Franco A, Borgogni E, Frontera S, Nesi G, Liotta F, et al. Functional differences in visceral and subcutaneous fat pads originate from differences in the adipose stem cell. PLoS One 2012; 7:e36569; PMID:22574183; http://dx.doi.org/10.1371/journal.pone.0036569
- Joe AW, Yi L, Even Y, Vogl AW, Rossi FM. Depot-specific differences in adipogenic progenitor abundance and proliferative response to high-fat diet. Stem Cells 2009; 27:2563-70; PMID:19658193; http://dx.doi.org/10.1002/stem.190
- Tchkonia T, Giorgadze N, Pirtskhalava T, Tchoukalova Y, Karagiannides I, Forse RA, DePonte M, Stevenson M, Guo W, Han J, et al. Fat depot origin affects adipogenesis in primary cultured and cloned human preadipocytes. Am J Physiol Regul Integr Comp Physiol 2002; 282:R1286-96; PMID:11959668
- Qiu Z, Wei Y, Chen N, Jiang M, Wu J, Liao K. DNA synthesis and mitotic clonal expansion is not a required step for 3T3-L1 preadipocyte differentiation into adipocytes. J Biol Chem 2001; 276:11988-95; PMID:11278974; http://dx.doi.org/10.1074/jbc.M011729200
- Park JG, Lee DH, Moon YS, Kim KH. Reversine increases the plasticity of lineage-committed preadipocytes to osteogenesis by inhibiting adipogenesis through induction of TGF-beta pathway in vitro. Biochem Biophys Res Commun 2014; 446:30-6; PMID:24548409; http://dx.doi.org/10.1016/j.bbrc.2014.02.036
- Berga-Bolanos R, Drews-Elger K, Aramburu J, Lopez-Rodriguez C. NFAT5 regulates T lymphocyte homeostasis and CD24-dependent T cell expansion under pathologic hypernatremia. J Immunol 2010; 185:6624-35; PMID:21037089; http://dx.doi.org/10.4049/jimmunol.1001232
- Meyer MJ, Fleming JM, Ali MA, Pesesky MW, Ginsburg E, Vonderhaar BK. Dynamic regulation of CD24 and the invasive, CD44posCD24neg phenotype in breast cancer cell lines. Breast Cancer Res 2009; 11:R82; PMID:19906290; http://dx.doi.org/10.1186/bcr2449
- Hough MR, Chappel MS, Sauvageau G, Takei F, Kay R, Humphries RK. Reduction of early B lymphocyte precursors in transgenic mice overexpressing the murine heat-stable antigen. J Immunol 1996; 156:479-88; PMID:8543797
- Nielsen PJ, Lorenz B, Muller AM, Wenger RH, Brombacher F, Simon M, von der Weid T, Langhorne WJ, Mossmann H, Kohler G. Altered erythrocytes and a leaky block in B-cell development in CD24/HSA-deficient mice. Blood 1997; 89:1058-67; PMID:9028339
- Hardy RR, Carmack CE, Shinton SA, Kemp JD, Hayakawa K. Resolution and characterization of pro-B and pre-pro-B cell stages in normal mouse bone marrow. J Exp Med 1991; 173:1213-25; PMID:1827140; http://dx.doi.org/10.1084/jem.173.5.1213
- Joost HG, Schurmann A. Subcellular fractionation of adipocytes and 3T3-L1 cells. Methods Mol Biol 2001; 155:77-82; PMID:11293085
- Pfaffl MW. A new mathematical model for relative quantification in real-time RT-PCR. Nucleic Acids Res 2001; 29:e45; PMID:11328886; http://dx.doi.org/10.1093/nar/29.9.e45
- Bustin SA, Benes V, Garson JA, Hellemans J, Huggett J, Kubista M, Mueller R, Nolan T, Pfaffl MW, Shipley GL, et al. The MIQE guidelines: minimum information for publication of quantitative real-time PCR experiments. Clin Chem 2009; 55:611-22; PMID:19246619; http://dx.doi.org/10.1373/clinchem.2008.112797
- R Development Core Team. R: A Language and Environment for Statistical Computing. R Foundation for Statistical Computing, 2012. Retrieved from http://www.R-project.org