
Abstract
Obesity is linked to adipose tissue hypertrophy (increased adipocyte cell size) and hyperplasia (increased cell number). Comparative analyses of gene datasets allowed us to identify 1426 genes which may represent common adipose phenotype in humans and mice. Among them we identified several adipocyte-specific genes dysregulated in obese adipose tissue, involved in either fatty acid storage (acyl CoA synthase ACSL1, hormone-sensitive lipase LIPE, aquaporin 7 AQP7, perilipin PLIN) or cell adhesion (fibronectin FN1, collagens COL1A1, COL1A3, metalloprotein MMP9, or both (scavenger receptor FAT/CD36). Using real-time analysis of cell surface occupancy on xCELLigence system we developed a new method to study lipid uptake and differentiation of mouse 3T3L1 fibroblasts and human adipose stem cells. Both processes are regulated by insulin and fatty acids such as oleic acid. We showed that fatty acid addition to culture media increased the differentiation rate and was required for full differentiation into unilocular adipocytes. Significant activation of lipogenesis, i.e. lipid accumulation, by either insulin or oleic acid was monitored in times ranging from 1 to 24 h, depending on differentiation state, whereas significant effects on adipogenesis, i.e., surperimposed lipid accumulation and gene transcriptional regulations were measured after 3 to 4 d. Combination of selected times for analysis of lipid contents, cell counts, size fractionations, and gene transcriptional regulations showed that FAT/CD36 specific inhibitor AP5258 significantly increased cell survival of oleic acid-treated mouse and human adipocytes, and partially restored the transcriptional response to oleic acid in the presence of insulin through JNK pathway. Taken together, these data open new perspectives to study the molecular mechanisms commonly dysregulated in mouse and human obesity at the level of lipogenesis linked to hypertrophy and adipogenesis linked to hyperplasia.
Abbreviations:
- ACSL1, Acyl-CoA synthetase long chain family member 1
- AQP7, aquaporin 7
- (h)ASCs, (human)adipose stem cells
- (h)dA, (human) adipocytes differentiated in vitro
- bFGF, basic fibroblast growth factor
- BSA, bovine serum albumin, lipid-free
- CEBPA, CCAAT/enhancer binding protein (C/EBP) α
- CIDEA &
- CIDEC, cell death-inducing DFFA-like effectors a and c
- COL1A1 &
- COL1A3, Collagens 1 α
- subunits 1 and 3
- DMEM, Dulbecco's Modified Eagle's Medium
- ECM, extracellular matrix
- FABP1 and 4, fatty acid binding proteins 1 and 4
- FAT/CD36, fatty acid translocase
- FCS, foetal calf serum
- FN1, fibronectin
- GO, Gene Ontology
- HSPG, heparan sulfate proteoglycans
- IL6, interleukin 6
- IBMX, isobutylmethylxanthine
- JNK, Jun-NH2 kinase
- LIPE, hormone-sensitive lipase
- MMP9, matrix metallopeptidase 9
- PBS, phosphate buffered saline
- PLIN, perilipin
- PPARG, peroxisome-proliferator receptor gamma
- RT-qPCR, real-time quantitative polymerase chain reaction
- RTCA, Real-time Cell Analyzer
- TA, adipose tissue
- TNFA, tumor necrosis factor α
Introduction
Adipose tissue has been subjected to extensive studies during the last past decades since it plays a central role in lipid homeostasis, but also for its major contribution to hormonal regulations in metabolism. Consequently, metabolic deregulations due to modern lifestyle such as obesity may largely depend on adipose tissue functions. Resulting inflammatory processes influence adipose tissue integrity and function.Citation1-3
Adipocyte precursors are proliferating cells originating from mesenchymal pluripotent cells which are determined after growth arrest then clonal expansion through activation of mitogen-activated protein kinases.Citation4 Differentiation of these precursors depends on cyclic adenosine monophosphate production and activation of the transcription factor peroxisome-proliferator receptor gamma (PPARG) in presence of insulin. PPARG activation induces profound multilocularization and enhances mitochondrial biogenesis in adipocytes.Citation5 Lipogenesis, i.e. lipid accumulation into specific droplets, requires numerous proteins including the cell death-inducing DFFA-like effectors a and c CIDEA and CIDEC to increase in size and for the fusion into larger ones.Citation6 Both adipogenesis and lipogenesis are stimulated by insulin which increases adipocyte cell size Citation7 through transcriptional inhibition of apoptosis and activation of lipid droplet synthesisCitation8 but also controls the transcription and/or secretion of numerous secreted factors such as adiponectin.Citation9 Lipid uptake by adipocytes is performed through interaction with intracellular fatty acid binding proteins FABP1 and FABP4, with fatty acid translocase FAT/CD36, lipoprotein receptor heparan sulfate proteoglycans HSPG but also G-protein coupled receptors, then accumulation as triglycerides in lipid droplets,Citation10-18 however their respective functions in fatty acid storage and intracellular signaling need further investigations.
The differentiating process includes progressive lipid accumulation, called lipogenesis into droplets which finally fuse in a unique and large one, together with progressive expression and secretion of numerous adipokines, such as leptin and adiponectin but also pro-inflammatory cytokines such as tumor necrosis factor α (TNFA) or interleukin 6 (IL6).Citation19 Importantly, adipocyte secretome largely depends on adipocyte micro-environment such as high lipid accumulation and macrophage infiltration, with pathological consequences such as endothelial dysfunction as an early event of atherosclerosis.Citation20 The bimodal distribution in size of mature adipocytes which can be divided in 2 populations, the small adipocytes and the large adipocytes, is now largely considered as a major regulator of adipose tissue functions.Citation21
In obesity, lipid accumulation induces adipose tissue remodeling through hypertrophy of adipocytesCitation22 which has been shown in several studies to induce hyperplasia, i.e., increase differentiation of adipocyte precursors Citation23-25 and possibly increase proliferation of adipocyte precursors.Citation24,26,27
Numerous studies depict the mechanisms underlying adipose tissue renewal, differentiation, and function using experiments in rodents and humans. The aim of the present study was to identify common features dysregulated in obesity in both rodents and humans using combination of bio-informatics and real-time assays. In our study, we have performed experiments on the 3T3L1 mouse cell line and human adipocyte stem cells (hASCs) isolated from liposuctions and selectively amplified in presence of basic fibroblast growth factor (bFGF, 28). Building specific gene data sets representative of adipose tissue phenotype was used to identify which molecular pathways may be specifically related to adipogenesis and/or lipogenesis and possibly dysregulated in obesity. We developed a new method for real-time analysis of adipogenesis and lipogenesis. FAT/CD36 was then identified as a central player in adipogenesis by regulating both differentiation and lipogenesis.
Results
Candidate genes dysregulated in obesity are related to fatty acid storage and extracellular matrix
Gene sets linked to specific phenotypes, such as liver or adipose tissues, were retrieved from the literature and compared to genome to find specific over-representation, i.e. gene transcriptional regulation not due to chance (Supplementary Data 1). In a previous study, this method has been extensively depicted and led to characterize hepatocellular cancer cell phenotype in comparison to healthy liver.Citation29 In the present study, we raised a list of genes representative of human adipocyte lineage, called «human adipose» gene set (), which is a result of gene sets representative of human adipose-derived stem cells (hASC gene set), human adipose cell differentiated in vitro (hdA, Differentiating gene set) and adipose tissues (TA gene set), respectively, i.e., genes specifically detected in comparison to non-adipose cell types. Cumulative data obtained in mouse were also retrieved, leading to «Mouse adipose» gene set. Comparison of human and mouse adipose gene sets lead to identify a set of common 1426 genes which may represent adipose tissue lineage in both species (Supplementary Table 2). From this set, we searched for specific enrichment in Kyoto Encyclopedia of Genes and Genomes (KEGG) pathways using Fatigo+ software. Among the 136 pathways significantly over-represented in comparison to the genome (adjusted p-value less than 0.05), 48 were also over-represented in the set of genes dysregulated in obese adipose tissue, but only 16 were commonly over-represented in healthy adipose tissue (TA gene set), suggesting that these 16 pathways () may represent specific adipocyte functions altered in obesity. Classical pathways were affected, such as adipocytokine signaling, extracellular matrix, fatty acid metabolism, insulin, transforming growth factor β signaling, and glycolysis, but also pathways linked to cardiomyopathy and cancer. These pathways involve genes related to adipose functions, such as fatty acid storage (scavenger receptor FAT/CD36, acyl CoA synthase ACSL1, hormone-sensitive lipase LIPE, aquaporin 7 AQP7, perilipin PLIN) and extracellular proteins (fibronectin FN1, collagens COL1A1, COL1A3, metalloprotein MMP9) ().
Table 1. Gene data sets, their and their representativity in genome (n, number of genes, %, frequency in genome. References of gene sets are provided in Supplementary Data 1
Table 2. Genes specific of mouse and human adipose lineage that are dysregulated in obesity. Among the set of genes representative of adipocyte lineage in mouse and humans, the only 10 genes dysregulated in obesity and linked to differentiating adipocytes or adipose tissue are reported in the left panel according to their KEGG pathway. Abbreviations: ACSL1, acyl-CoA synthetase long-chain family member 1; ACTG1, actin gamma 1; AQP7, aquaporin 7; CD36, CD36 molecule (thrombospondin receptor); COL1A1, collagen type I α 1; COL3A1, collagen type III α 1; FN1, fibronectin 1; ID, gene identifier; LIPE, lipase hormone-sensitive; MMP9 matrix metallopeptidase 9; PLIN, perilipin
Figure 1. Pathways dysregulated in obese human adipose tissue. Gene datasets of either healthy adipose tissue or dysregulated in obesity were compared to genome in KEGG pathway enrichment using Fatigo+ software. Among the 54 pathways significantly over-represented in obesity, only the 16 pathways significantly over-represented in either differentiating and healthy adipose tissue are presented (adjusted p-value P < 0.05).
Real-time analysis of adipose lineage in vitro
A previous study has shown that induction of differentiation in 3T3L1 could be monitored with xCELLigence system at least during the first days.Citation30 In the present study we aimed to characterize the full differentiation process of both 3T3L1 fibroblasts and human hASCs on RTCA system, including cell growth and/or survival (i.e. cell number), morphological changes (i.e., cell size and cell force adhesion) in real-time assays on xCELLigence system to give a global image and point out specific events further characterized by complimentary approaches such as cell size analyses, lipid uptake measurements, cell growth and/or survival assays and cell imaging. In a previous study, we showed that cell density and media may greatly influence xCELLigence cell indexes (Berger et al, manuscript in revision). Therefore cell plating conditions were optimized for both 3T3L1 fibroblasts and hASCs using Scepter cell counter to monitor both cell number and health (frequency of cell debris), leading to identify healthy cell size and the respective distribution of healthy cells (Supplementary Data 3A). Moreover, experiments could be selected on the bases of accurate proliferation rate during the 24 h phase of cell growth before treatments, which is related to standardized experimental conditions. Interestingly, we observed that when plated at the same density, the proliferative rate of hASCs may slightly differ depending on the donor and/or on the passage, as well as their differentiation rate (data not shown). Therefore experiments could not be averaged but treatments were significant when reproduced in at least 3 independent experiments. Both 3T3L1 and hASCs proliferation and differentiation into mature adipocytes were monitored in real-time assays on xCELLigence system. The resulting cell index represents the surface occupancy by cells, thus takes into account cell size, number and adhesion force. At selected times, complementary analyses were performed to measure cell size using cell suspension counters (Scepter: diameters in the range of 6 to 36 μM Multisizer: diameters in the range of 6 to 60 μm or 24 to 240 μm depending on aperture; Supplementary Data 3A), cell number using both cell counts (cell size distribution of Gaussian curve indicates living cells versus dying cells and debris according to cell type; Fig. S3A) and nuclei counts using specific fluorescent labeling and automated counting; cell proliferation and/or death by cell cycle analysis in flow cytometry. Cell adhesion force could be altered by the density of cell contents such as lipids, which induce cell detachment (isolated adipocytes with high lipid contents float at the surface of media but do not lay down). Thus lipid uptake was monitored with fluorescent labeling of lipid droplet contents with AdipoRed and automated counting normalized to the number of nuclei. Preparations of samples for cell size analysis were performed using different methods with optimal results obtained with trypsin rather than accutase nor collagenase for cell culture dissociation, fixation with formalin for cell culture rather than osmic acid (Fig. S3B). We found that cell size distributions were greatly modulated during the differentiation processes, with diameters less than 30 μm for hASCs and up to 200 μm for fully differentiated hdA (Fig. S3C and D). We also found that well-plate size may affect the rate of differentiation although electrodes on E-plates did not significantly affected adipogenesis when cell cultures were performed in parallel to classical 96 well-plates and characterized by analysis of both cell cycle in flow cytometry at early steps of differentiation and cell size distributions (Fig. S3E).
Among the set of genes dysregulated in obese adipose tissue, we have focused on the fatty acid transporter FAT/CD36 due to its pleiotropic activities and we explored its role in adipose lineage. FAT/CD36 mediates lipid uptake of long-chain fatty acids, including oleic acid.Citation12 Thus FAT/CD36 activity was analyzed using a highly specific inhibitor AP5258 Citation31 in the presence or absence of either insulin or oleic acid, in order to study its role in proliferation and differentiation of adipocyte precursors and/or lipid uptake.
Adipocyte precursors accumulate oleic acid without a dose-dependent alteration of cell integrity
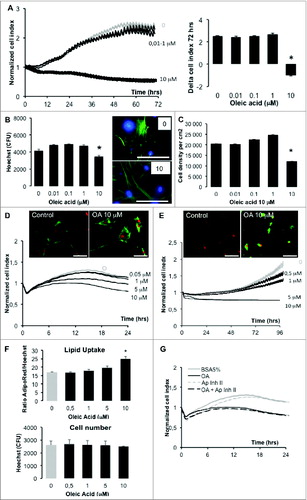
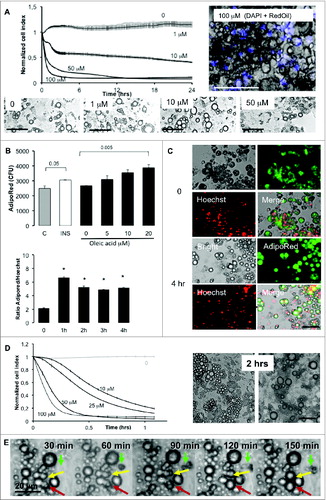
Mouse 3T3L1 fibroblasts and human ASCs were monitored in real-time on xCELLigence system in the presence of either oleate or vehicle at several concentrations (). For 3T3L1 fibroblasts cell index was reduced to a half 3 d after treatment with oleic acid 10 μM, with no significant effect at lowest concentrations (). At the end of the experiments, cells were fixed and labeled with Hoechst () or dissociated in order to analyze cell size distributions (). Both methods showed that oleic acid 10 μM reduced the cell number. In hASCs analyzed during 24 h (because BSA was found to rapidly alter cell growth after longer exposure in the control) oleic acid was found to alter cell index in a dose-dependent manner (). In hASCs treated with oleic acid complexed to hSA, cell index increase was measured during 4 d in several doses of oleic acid () with significant lipid uptake in the presence of oleic acid 10 μM without cell number differences 24 h after treatment (). Apoptosis inhibition by a specific inhibitor () did not significantly affect cell index of cells treated either by hSA or oleic acid, suggesting that the reductions of cell index were not induced by pro-apoptotic pathways. Taken together, these results indicate that both mouse and human adipocyte precursors can accumulate oleic acid which induce reduction of RTCA cell index due to cell adhesion force reduction.
Figure 2 (See previous page). Proliferation and/or survival and lipid storage of 3T3L1 and hASCs are modulated by oleic acid (representative experiments). (A) Real time proliferation of 3T3L1 fibroblasts on xCELLigence with several doses of oleic acid, represented by cell indexes normalized at time of treatment and measured every 5 min during 50 cycles then every 15 min during 72 h on the left panel, corresponding differences in cell indexes 72 h after treatment on the right panel. (B) In the same experiment, cells plated in 96-well plates were analyzed 72 h after treatment with Hoechst 33258 nuclear staining (blue color) and cytoskeleton staining with phalloidin Atto 498 (green color) using Cytation 3 to count nuclei (left panel) and imaging with identical acquisition: led intensity: 10; camera gain: 10, integration time: 400 (magnification x20, right panel). (C) At the end of experiment, cells were dissociated from xCELLigence wells and were analyzed using Scepter cell counting represented by cell density of living cells (i.e., cell diameter >10.8 μM). (D) Real-time monitoring of hASCs on xCELLigence in several doses of oleic acid in lipid-free BSA 5% represented by cell indexes normalized at time of treatment on the lower panel and corresponding imaging with Cytation 3 of fixed cells labeled with AdipoRed for lipid storage (green color) and nuclear staining with Hoechst 33258 (red color) with identical acquisition parameters. (E) Real-time monitoring of hASCs from donor S1 on xCELLigence treated with several doses of oleic acid complexed to human serum albumin (5%) shows cell index reduction with highest dose of oleic acid (10 μM) is due to lipid uptake without affecting cell survival. (F) Automated measurement of mean cell lipid content (AdipoRed, upper graph) and cell count (Hoechst, lower graph) show a dose-dependent increase in lipid content without significant effect on cell number (led intensity: 10; camera gain: 6, intensity 558). Corresponding fluorescence intensity of AdipoRed was counted and normalized to Hoechst 33258. (G) The reduction of cell index induced by oleic acid 10 μM was not affected by apoptose inhibitor II (50 μM in the same experiment). All experiments are represented as mean values ±SEM (n > 5 for xCELLigence nor Cytation 3), mean values ± SD for Scepter counts (n = 3 measurements of 8 cumulated 96-E-plate wells) and significant Student's t-test p-values >0.05 by asterisk. Scale bars = 100 μm. Abbreviations: C: control; OA: oleic acid; BSA: bovine serum albumin; Ap Inh II: apoptosis inhibitor II; CFU: Counts of fluorescence, arbitrary units.
FAT/CD36 inhibitor AP5258 increases lipid uptake and cell size of both 3T3L1 and human adipocyte precursors
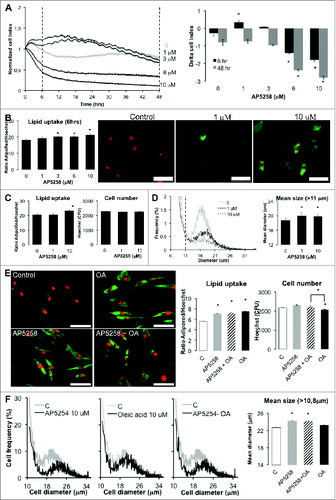
In mouse adipocyte precursors, we found that FAT/CD36 inhibitor AP5258 differentially modulated RTCA cell index according to concentrations. At low doses we observed an increase of cell index during 16 h although cell index quickly decreased at higher doses such as 10 μM (). In short term treatment, i.e. 6 h, mouse 3T3L1 fibroblasts displayed significant increased lipid uptake with AP5258 in a dose-dependent manner, with clear increase of small lipid droplets () which were maintained after 48 h without significant cell loss even at highest doses (). However, FAT/CD36 induced a significant increase of mean cell sizes (). Thus, RTCA monitoring of AP5258 revealed a cumulative effect of cell adhesion force reduction by lipid uptake and morphological changes induced by FAT/CD36 inhibition in 3T3L1 fibroblasts. Similar results were obtained in hASCs (data not shown). In these cells we found that lipid uptake induced by AP5258 was similar to that of oleic acid () without significant difference for oleic acid uptake when AP5258 was added in terms of cell number, lipid uptake nor effect of size (). These results suggest that FAT/CD36 inhibition in pre-adipose cells favored lipid accumulation without affecting cell growth and/or survival. Interestingly, in the presence of oleic acid, inhibition of FAT/CD36 was found to increase oleic acid-induced lipid accumulation together with a suppression of cell number reduction by oleic acid (). These data support thus the hypothesis that FAT/CD36 is involved in the toxic effect of high doses of fatty acid on adipose precursor cells.
Figure 3 (See previous page). FAT/CD36 inhibition induces morphological changes in mouse 3T3L1 fibroblasts and human adipose stem cells (hASCs). (A) Real-time monitoring of 3T3L1 fibroblasts treated with several doses of AP5258 in DMEM FCS10% (representative experiment); left panel: cell index normalized at time of treatment measured every 5 min during 50 cycles, then every 15 min during 48 h, right panel: corresponding differences in cell indexes, respectively 6 and 48 h after treatment). (B and C) Lipid uptake (lipogenesis) and cell number were monitored using Cytation 3 system with fluorescence intensity of AdipoRed (lipid uptake) normalized to that of Hoechst 33258 (nucleus counts) in the same wells, respectively 6 (B) and 48 h (C) after treatment. Corresponding merged images were taken at fixed intensities for AdipoRed (green filter) and Hoechst 33258 (red filter) with Led intensity: 10; Integration time: 400; camera gain: 10; magnification x20. D- Scepter cell size fractionation suggests significant increase of mean cell size for 3T3L1 fibroblasts treated with AP5258. Cell size distributions were analyzed on freshly dissociated cells at the end of the experiment (A), i.e. 48 h after treatment, cells were cumulated from 8 E-plates wells then analyzed in triplicates. Left panel: cell frequencies according to diameter; right panel: mean diameters for cells in a range of 10.8 to 36 μm. E-F: FAT/CD36 inhibitor AP5258 induces lipid uptake and morphological changes in hASCs, independently of oleic acid. hASCs were treated during 3 d with either AP5258 10 μM and/or oleic acid (OA) 10 μM in BSA5% containing media in 96 wells-plates. After treatments, cells were labeled with AdipoRed in PBS to monitor lipid uptake, then fixed with formalin 3% before labeling nuclei with Hoechst 3358 and subsequent analysis with Cytation 3 apparatus. Left panel: merged micrograph with acquisition parameters identical to (B) section; central panel: lipid uptake obtained by calculating the ratio of AdipoRed to Hoechst absorbance intensities; right panel: nuclei counts by measuring Hoechst fluorescence intensities. In the same experiment, cells were dissociated from 96-wells plates, cumulated (8 wells per condition), size distributions were measured in triplicates using Scepter cell counter. Left panels represent cell frequencies according to cell diameters, right panel the mean diameters of cells ranging from 10.8 to 38 μm. All data are presented as mean values ± standard deviations with significant Student's t-test p-values <0.05 (asterisks). Scale bars = 100 μm.
Real-time analysis of adipogenesis in mouse and humans
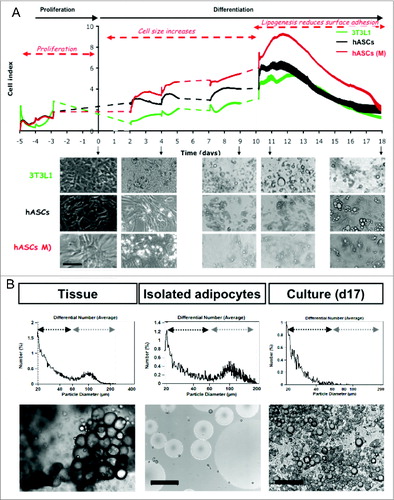
Real time analysis of adipogenesis was monitored for 3T3L1 and hASCs in their respective optimized culture media (; Supplementary Data 4 and 5). Using complementary approaches at selected times during differentiation and samples taken in parallel to xCELLigence monitoring, we could define 3 major steps after differentiation was induced in 3T3L1 fibroblasts: (1) cell size was drastically reduced but with maintenance of proliferation without significant cell death; (2) cell size then increased and entered in a phase of cell cycle arrest; (3) a slight but significant reduction of cell number was accompanied by cell size increase during at least 9 d then the increased accumulation of lipids was accompanied by increased transcription and transduction of adiponectin (Supplementary Data 4). Thus during adipogenesis the cell index may represent cumulative effects of cell size increase and cell adhesion force reduction due to lipogenesis. Similarly in hASCs, at the beginning of adipogenesis we observed an increase of cell number accompanied by cell size increased in addition to lipogenesis (Supplementary Data 5). Then we compared in the same experiment the differentiation process of hASCs in their optimized media or in the differentiation media of 3T3L1 (simply completed with insulin) to that of 3T3L1 cells (). Adipose precursors were maintained in their respective proliferative media until confluence. Induction of differentiation through activation of PPARG in the presence of insulin induced drastic cell size reduction then important morphological changes, i.e., multilocular lipid droplet appearance. Thus adipogenesis is superimposed to lipogenesis, detected on xCELLigence by progressive cell index reduction due to reduction of cell adhesion without cell loss. Interestingly, human cells processed in the same differentiating conditions as 3T3L1 and did not present significant morphological changes in comparison to their optimized differentiation media. We have also noted that both in human and in mouse cells, the cell index was drastically reduced at the end of the differentiating process. Comparatively to both adipose tissue and isolated adipocytes, fully differentiated adipocytes never reached the unilocular form of mature adipocytes nor the bimodal distribution of adipocytes into small, i.e. cell diameter less than around 50 μm, and large, i.e. cell diameter up to around 50 μm ().
Figure 4 (See previous page). Comparative analysis of mouse and human adipogenesis in real-time assays. (A) Comparative RTCA monitoring of 3T3L1 fibroblasts and human adipocyte lineage differentiation (P2 generation, hASCs). Cells were plated at high density (10 000 cells/cm2) respectively on 96-wells E-plate for RTCA monitoring and in 12-wells plates for phase contrast imaging of living cells (magnification x20, scale bar = 100 μm). They were differentiated under their respective optimized media and for cell dynamic comparisons hASCs were also differentiated in 3T3L1 optimized media (hASCs (M)). Cell index was measured every 15 min (except dotted lines) and represented as mean values ±SEM (n = 8). Time scale was normalized to time of differentiation induction (5 d after cell plating). (B) Comparative analysis of cell size distribution (representative experiment). Adipocytes from respectively adipose tissue, isolated and fully differentiated cells from hASCs (d17) were obtained from a unique donor, fixed in osmic acid and analyzed using Beckman Cell Counter through a 400 μm probe. Adipocytes could be divided in 2 distinct populations, respectively small i.e., diameter 20 to 60 μm, and large, i.e. 60 to 200 μm in adipose tissue. In fully differentiated cells, only the small size adipocytes were identified. A set of 10 000 cells were analyzed and presented as mean number according to cell diameter (n = 4). Corresponding phase contrast images were taken with magnification x10; scale bar = 200 μm.
Lipogenesis in mouse and human adipocytes
In order to validate the hypothesis that lipogenesis reduces RTCA cell index through reduction of cell adhesion force, we analyzed the ability of adipocytes to perform lipogenesis in vitro using xCELLigence (). Differentiated adipocytes were treated by several concentrations of oleic acid. In both mouse () and human cells (), RTCA cell indexes were drastically reduced due to reduction of cell force adhesion induced by lipid content (), which induced lipid droplet appearance and fusion of small droplets into larger ones. In isolated adipocytes, such an experiment was unfortunately not convincing as dissociated cells (both small and large adipocytes) quickly die in suspension (in less than 18 h) and oleic acid (in few minutes) induced drastic cell death after cell membrane disruption (Supplementary Data 6A and B). Interestingly droplet sizes were not simultaneously modified as some remain small although others drastically increased in size. Such a discrepancy was also observed in adipose tissue fragments treated with oleic acid, where some adipocytes could increase up to 20 times in diameter, ranging from 50 μm before treatment to 2 mm after oleic acid treatment (Supplementary Data 6C).
Figure 5 (See previous page). Real-time monitoring of lipogenesis induced by oleic acid in mouse 3T3L1- and human ASCs-derived adipocytes. (A) Time and dose-dependent activity of oleic acid on 3T3 differentiated adipocytes measured by RTCA monitoring (mean values ± SEM, n = 8, representative experiment). 3T3L1 fibroblasts were differentiated into adipocytes (D11) then incubated with either vehicle or increased doses of oleic acid (0 to 100 μM). Cell indexes (normalized at time of treatment) were measured during one day (left panel) and differences of cell index after one day, i.e., delta cell indexes, are reported in the right panel. Phase contrast micrographs taken at the end of the experiment revealed increased lipid droplet accumulation after 1 d of treatment but no significant cell removal even at highest dose (100 μM) although cell index was null. Thus drastic reduction of cell index and slopes reveal reduction of adhesion force due to lipid accumulation. (B) Lipid uptake measured in 3T3L1 adipocytes at the beginning of differentiation (D6) is dependent on oleic acid complexed to bovine serum albumin (lipid-free, 5%) (representative experiment). Lipid uptake was measured using AdipoRed and counts of fluorescence (CFU, left panel) were measured using Cytation 3 apparatus and is represented by mean values of 5 times measures of 8 96-well plate; significant Student's t-test p-values (P < 0.05) are indicated. After intensity measurement, cells were fixed and micrographs were taken at magnification x20 in either phase contrast and green fluorescence, scale bar = 100 μm. (C) Lipid uptake is highest in one hour in 3T3L1 differentiated (D15) adipocytes (representative experiment). Fully differentiated adipocytes were treated in oleic acid 20 μM and lipid-free bovine serum albumin 5% and reactions were arrested by fixation at different times, then labeled with Hoechst 33258 10 μM. Respective absorbances were measured on Cytation 3 system and AdipoRed was normalized to that of Hoechst (5 measurements par well, mean values ±SEM, n = 8 wells). Corresponding micrographs were taken at magnificence x20, scale bar = 100 μm. (D) Time and dose-dependent activity of oleic acid on human differentiated adipocytes (hdA, D12) measured by RTCA monitoring (mean values ± SEM, n=8). After differentiation hdA were incubated with either vehicle or increased doses of oleic acid (0 to 100 μM). Left panel: dose- and time-dependent effect of oleic acid on RTCA cell index. (E) Lipid uptake (green) normalized to Nuclei counts (red) by hdA measured on Cytation 3 for cell treated during 3 d early during the differentiating process (d5) by oleic acid in human serum albumin 5% (hSA). Scale bars = 100 μm. (F) Increased lipid accumulation in fully differentiated hAd (D15) treated with 10 μM oleic acid monitored with phase contrast micrographs taken on living cells (magnification x 20). (G) Time-lapse of lipid droplet formation and size increase in hdA (D15) was observed under phase contrast microscopy (magnificence x20, DIC) for adipocytes stimulated by 25 μM oleic acid (indicated by arrows).
Oleic acid addition to both mouse and human fully differentiated adipocytes in culture did not significantly altered cell survival as shown in both phase contrast micrographs and nuclei labeling with either Dapi () or Hoechst (not shown). Lipogenesis induced by oleic acid was dose-dependent with IC50 25 μM, for both mouse and human dA. Lipid uptake occurred in less than one hour for high fatty acid concentrations, in a dose-dependent manner from 10 to 100 μM of oleic acid (). A significant reduction of RTCA cell index occurred in times ranging from less than one to 24 h depending on cell density and differentiating stage, therefore experiments on cell culture should be performed with several fatty acid doses and monitored in real-time experiments. Cell index fall was found highly variable in time and with fatty acid concentrations after oleic acid treatment both for mouse and human lineages, and could be related to a highly variable cell differentiation rate, which could be in addition to the number of passages in both mouse and human cell cultures, as well as the donor anthropometric characters in human dA cultures (data not shown).
Differentiation rate increased by oleic acid
We could monitor by imaging living cells that oleic acid treatments induced drastic morphological changes which were highly dependent on the differentiating state (Supplementary Data 6). This hypothesis was confirmed by testing the ability of differentiating cells to perform lipogenesis as soon as 6 d after differentiation was induced (), as well as through insulin or oleic acid addition. Lipid uptake was found higher in one hour than longer exposure times when measured as AdipoRed vs. Hoechst ratio related to lipid content normalized to the number of cells (). Similar results were obtained with human adipocytes ( and E). Cell size analysis was unfortunately not reliable as cells may be disrupted during processing (not shown). Living cell imaging showed lipid droplet size increase and fusion upon time (). Lipid droplets size increased getting closer to unilocular adipocytes similar to small mature adipocytes isolated from adipose tissue (cf ). In isolated mature adipocytes, which may survive less than one day, experiments on lipogenesis indicate that they are not suitable for long-time experiments (Supplementary Data 6). Comparatively to cultured adipocytes, we could observe that oleic acid induced fatty acid uptake, and consequently spectacular displasy in only a small population of adipocytes in tissue fragments (Supplementary Data 6).
Complex activity of oleic acid and FAT/CD36 during in vitro adipogenesis
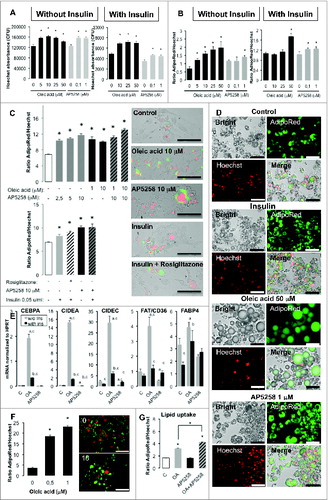
Both mouse and human adipogenesis induced in vitro look like heterogeneous, i.e. with different rates of differentiation and lipid accumulation. Thus the mechanisms involved are complex and we tried to explore the role of FAT/CD36 by comparison to that of oleic acid (). Both cell lineages should be maintained in media containing insulin to promote their differentiation after induction. We found that both AP5258 and oleic acid complexed to BSA increased the cell number after 2 to 3 d exposure, independently of insulin in 3T3L1 partially differentiated adipocytes (). Both AP5258 and oleic acid induced an increase of lipid content per cell, independently of insulin for AP5258, with less extent in the presence of insulin for oleic acid (). When applied one day after adipogenesis induction, we found that both oleic acid and AP5258 were more efficient than insulin or second differentiating media containing both insulin and rosiglitazone to increase lipid contents and could increase oleic acid storage (). Lipid storage was observed as increased lipid droplet sizes and even fully maturated adipocytes with unilocular droplets in the presence of oleic acid (). Morevover, pre-exposition of hASCs to oleic acid during several days was sufficient to improve their lipid storage several days after induction of differentiation () as well as in partially differentiated human adipocytes where FAT/CD36 inhibition also increased fatty acid accumulation (). We selected a number of genes highly expressed in differentiated adipocytes.Citation32 Gene transcripts were measured on partially differentiated mouse adipocytes revealing complex transcriptional regulations with great differences in absence or in presence of insulin (). Oleic acid drastically increased the transcription of CIDEA, CIDEC, and CEBPA in absence of insulin, and this activity was reduced in the presence of insulin. Oleic acid also increased that of FAT/CD36 but had no effect in the presence of insulin. AP5258 repressed the transcription of CEBPA, CIDEA, CIDEC, and FAT/CD36 in absence of insulin, although these effects were reduced in the presence of insulin, with no significant effect on CIDEC.
Figure 6 (See previous page). Oleic acid and AP5258 differentially modulate adipogenesis and lipogenesis depending on presence or absence of insulin. (A) Oleic acid and FAT/CD36 inhibitor promote survival and/or proliferation of 3T3L1-derived adipocytes (D11), and (B) increase lipid contents. Cells were plated in 96-wells plates, induced to differentiate then were treated with either oleic acid as positive control, or AP5258 at several doses during 3 d, then lipogenesis was measured using Cytation 3 with AdipoRed (fluorescence counts), then fixed and labeled with Hoechst 33258 for nucleus counting (sum of 3 areas per well, magnificence x4). Since cell survival was influenced by treatments, effective lipogenesis was adjusted to the ratio of cells in each well, i.e. ratio per well of AdipoRed fluorescence (mean of 5 counts) versus nucleus number (sum of 3 areas), n = 8 wells per condition. Results are presented as mean values ± SD; asterisks represent significant Student test-t p-values <0 .05). (C) Oleic acid and FAT/CD36 inhibitor AP5253 promote adipogenesis of 3T3L1 one day after induction of differentiation in a dose-dependent manner (Upper panel) and AP5258 activity is comparable to that of normal differentiating media containing Rosiglitazone and insulin (Lower panel). Lipid content measured with AdipoRed (green label) were normalized to nuclei counts with Hoechst (Red label). Results are presented as mean values ± SEM with Student's significant p-values<0.05 represented as asterisks. Corresponding merge images of bright field, AdipoRed and Hoechts labeled cells are presented in the right panel, magnification x20, scale bar = 100 μm. (D) Microscope imaging of 3T3L1 adipocytes D11 treated during 3 d in bright field, labeled with AdipoRed (green), with Hoechst 33258 (red) and corresponding merge images taken on Cytation3 platform, magnification x20. Scale bars= 100 μm. (E) Transcriptional regulation of CIDEA, CIDEC, FAT/CD36 and FABP4 genes by oleic acid (left panel) and AP5258 (right panel) in D9 3T3L1 adipocytes treated during 24 h, in absence or in presence of insulin. Gene transcripts were analyzed by qRT-PCR and fold changes of treated vs. control samples were normalized to absolute HPRT gene transcription analysis. Data are presented as mean values ± SD with asterisks indicating significant Student's t-test p-values P < 0 .05. (F) Humans ASCs exposed to oleic acid increase their rate of differentiation. Human ASCs were exposed to several doses of oleic acid during 9 d, then were induced to differentiate during 5 d. Lipid content was measured using AdipoRed (green label) and normalized to nuclei number measured with Hoechst (Red label). Data are presented as representative experiment with mean values of 8 wells ±SEM with significant Student's t-test p-values P < 0.05 as asterisks on the left panel, and AdipoRed / Hoechst merged images taken at identical acquisition parameters (right panel; scale bar = 100 μm). (G) Comparatively to mouse 3T3L1 cell line, human dA (D10 treated 3 during 3 d) are promoted to increase lipid contents in the presence of oleic acid (10 μM) and favored by AP5258 (1 μM). Lipid contents measured with AdipoRed were normalized to Nuclei counts with Hoechst. Data presented are representative experiment with mean values of 8 wells ±SEM with significant Student's t-test p-values P < 0.05 as asterisks.
Both oleic acid and AP5258 regulate adipogenesis in an insulin-dependent manner
Using RTCA experiments we then monitored whether both lipid uptake and differentiation are modulated by FAT/CD36 with or without insulin (). Lipid contents were measured in short-term experiments (i.e., 4 h) and may reflect lipogenesis then after long term exposure (i.e. 4 d) to analyze the effects on differentiation. Insulin itself increased mean cell lipid content in 4 h as well as oleic acid. Inhibition of FAT/CD36, JNK, and PI3kinase activities by their respective specific inhibitors AP5258, SP600125, and LY29002 commonly increased mean lipid content per cell as well as increased oleic acid activity. AP5258 and LY29002 basal activities on lipid uptake were suppressed by insulin and reversed in the presence of SP600125. In long-term experiments, insulin reduced the number of cells and this effect was reduced in the presence of AP5258 but without any effect on JNK nor Pi3kinase inactivation, suggesting that insulin reduces cell survival by interacting with FAT/CD36 pathway independently of JNK and Pi3kinase. In absence of insulin, both FAT/CD36 and Pi3kinase inhibition did not affect cell number although inactivation of JNK reduced cell number, thus JNK basal activity may be involved in adipose cell survival in absence of insulin. Four days after treatment, in the presence of insulin, both JNK and PI3kinase inhibitions reduced mean cell lipid accumulation, suggesting that insulin mediates lipid accumulation in cell culture through regulation of both kinases.
Figure 7 (See previous page). Real-time analysis of oleic acid-induced signaling pathways in 3T3L1-derived adipocytes D7. Lipogenesis was measured up to 4 h (upper panels), adipogenesis (lower panels) up to 4 d using RTCA system or AdipoRed uptake normalized to nuclei counts with Hoechst labelling in the presence of specific inhibitors, i.e. FAT/CD36 inhibitor AP5258 10 μM, Pi3kinase inhibitor LY294002 (20 μM) or JNK inhibitor SP600125 (20 μM), in presence or absence of either insulin (INS 0.05 mU/ml) or oleic acid (OA) 10 μM complexed to lipid-free bovine serum albumin (C: BSA 5%) (representative experiment). RTCA data are represented by cell indexes measured every 5 min during 50 cycles then every 15 min during 4 d and normalized at time of treatment measured every 5 min. All data are presented as mean values +/−SEM, n=6). Asterisks represent significant differences with control for Student's t-test p-values <0.05.
Lipogenesis, differentiation and cell survival are differentially regulated at the transcriptional level by oleic acid, insulin, FAT/CD36 and JNK
The unravelling complexity in the regulation of both lipid contents and cell number in adipose cell cultures was then analyzed at the transcriptional level using 3T3L1 differentiated adipocytes treated during 24 h in order to characterize direct transcriptional regulations. As differentiation processes may vary from an experiment to another, lipid accumulation, cell number, and gene transcription analyses should be performed in the same experiment, as represented in . Genes specifically over-expressed in dA were selected on the bases of previously published experiments, i.e., CIDEC and CIDEA, regulated by insulin and JNK, CEBPA, FAT/CD36 itself and FABP4 which are differentiation markers.32 As adipose cell cultures are often heterogeneous, with poorly versus highly differentiated adipocytes, lipid content in cell culture could reflect lipid accumulation due to differentiation, although mean lipid content per cell (i.e. number of nuclei) may represent lipid uptake by dA. Insulin itself was found to increase both lipid content and cell survival although in short-term experiments, we did not find any significant effect on gene transcription. Oleic acid increased the mean lipid content per cell and induced a 10-fold increase of CIDEC transcripts, reduced cell survival with a corresponding 80-fold increased CIDEA gene transcription, as well as global lipid content increase with FAT/CD36 and CEBPA transcriptional activation. Thus the activity of oleic acid was more effective than insulin on adipogenesis but may reduce cell survival. Moreover, both activities were not found to sum since in the presence of insulin, oleic acid activity on gene transcription was attenuated as well as oleic acid-induced global lipid content, although insulin did not significantly modulated its activity on cell survival nor on mean cell lipid uptake. Inhibition of FAT/CD36 increased cell survival in absence of insulin (it compensated the cell number in absence of insulin) and reduced CIDEA, CIDEC, and CEBPA transcriptional activation by oleic acid, suggesting that oleic acid regulation of transcription may be mediated at least in part by its binding to FAT/CD36. This activity of FAT/CD36 inhibition was not significantly modified by the presence of insulin, both at the level of gene transcription, lipid contents and cell survival. In another way, JNK inhibition played a specific effect on insulin activity through reduction of global lipid content without affecting cell number nor mean cell lipid content. In absence of insulin, inhibition of JNK reduced both cell lipid accumulation and cell number reduction induced by oleic acid with a significant increase of oleic acid-induced CIDEA gene transcription, and slightly increased CIDEC gene transcription suggesting that JNK regulated both cell number and lipid droplet growth.
Table 3. Transcriptional regulation, modulatory effects on lipid accumulation and cell number by oleic acid, insulin, JNK, FAT/CD36 in 3T3L1 adipocytes (Representative experiment on 3T3L1 dA, D15). mRNA were quantified in at least 4 replicates per condition in cells plated in 12-wells plates and normalized to that of HPRT, lipid content (AdipoRed absorbance) and nuclei count (Hoechst absorbance) were measured in 8 96-wells plates. Results are presented as mean values ± SD with significant differences according to ANOVA variance test. Samples with the same letter indicate no significant difference, each letter represent significant different value
Discussion
In the present study, we propose new approaches to combine large-scale identification of molecular pathways dysregulated in adipose tissue and experimental models to identify major factors contributing to obesity and its related disorders. Using numerous published data sets, we identified a set of 1426 genes which may represent adipose lineage in both mouse and human. Only ten genes represent candidate genes dysregulated in obesity. Surprisingly, only 2 functions are represented by these dysregulated genes: extracellular matrix proteins (ECM) and lipid metabolism. Most of these proteins have been previously linked to dysregulations in obesity. Extracellular matrix remodelling plays a crucial role in adipose tissue expandability.Citation33 Collagen protein COL1A1 is a major ECM gene in adipose tissue which expression level is increased after weight loss Citation34 or reduced in obese adipose tissue.Citation35 Collagen COL3A1 expression is higher after weight lossCitation34 and its turnover is regulated by the metalloprotease MMP9 in human adipose tissue.Citation35 MMP9 itself is involved in ECM remodeling, with increased expression during adipogenesis,Citation36 its expression is reduced after weight lossCitation37 and increased in obese stroma-vascular fractionCitation38 and in adipose tissue with obesity-associated insulin resistance.Citation39
Aquaporin AQP7 facilitates the efflux of glycerol from adipose tissue and AQP7 deficiency has been linked to triglyceride accumulation in adipose tissue, and adult onset obesityCitation40; its expression is down regulated in obese adipose tissue.Citation41
Among proteins involved in lipid metabolism, we identified obesity-dysregulated genes also depicted in the literature for their implication in metabolic disorders related to adipose tissue. ACSL1 is the major acyl-CoA synthase in adipocytes involved in fatty acid efflux and fatty acid-induced insulin resistance.Citation42 This mitochondrial protein directs fatty acids toward β oxidation in adipocytesCitation43 synergistic to CD36-mediated plasma membrane transport.Citation44 In 3T3L1 adipocytes, ACSL1 increases fatty acid uptakeCitation18 and promotes lipogenic gene expression.Citation45 The hormone sensitive lipase LIPE is the major mediator of lipolysis induced by β adrenergic stimulation in adipocytesCitation46 and gene polymorphisms are linked to abdominal obesity.Citation47 Perilipin PLIN is involved in lipid droplet protein machinery.Citation48,49 Its expression is increased in obese human adipose tissue.Citation50 Its overexpression protects from diet-induced obesity in mice.Citation51 FAT/CD36 plays a central role in adipose tissue cell structure and remodeling, angiogenesis and regulates insulin signaling and triglyceride synthesis.Citation52 FAT/CD36 enhances adipose tissue inflammation and cell death in diet-induced obesityCitation53 and its expression is upregulated in obese adipose tissue.Citation54-56 This receptor interacts with fatty acids as well as oxidized lipids to drive their endocytosis and their degradation by lysosomes during differentiation in 3T3L1 adipocytes.Citation57 Therefore we have focused our attention on this fatty acid receptor and study its function in adipogenesis both in mouse 3T3L1 cell line and in human adipose stem cells by comparison to insulin and oleic acid, a long-fatty acid chain.
The process of adipogenesis is a result of 1) differentiation, which involves transcriptional regulation of genes involved in adipocyte phenotype such as CEBPA; and 2) lipogenesis, which results from a rapid uptake and accumulation of fatty acids into lipid droplets. Insulin is a major regulator of adipogenesis by regulating gene transcription of numerous adipocyte genes, including regulators of cell survival and of lipid droplet formation such as CIDEA and CIDEC Citation8 and consequently promotes both lipid uptake and differentiation.
For this purpose we performed real-time experiments to monitor proliferation and/or survival of adipocyte precursors and took advantage of xCELLigence to develop a new approach allowing to measure lipogenesis in real-time assays and to analyze mouse 3T3L1 cell line and human primary cells in the same experimental conditions. The measured cell index is a sum of cell number (i.e., proliferation vs. death), cell size (i.e. morphological changes) and adhesion cell force (i.e., cell density modulation by lipid content) allowing to select critical steps of reactivity to be analyzed by complementary methods such as lipid content measurement, cell counts, cell size fractionation and transcriptional regulations. We found that both mouse and human proliferating precursors were sensitive to 10 μM oleic acid, at such low doses lipid uptake was observed in both ASCs and dA and promoted ASC differentiation into adipocytes in both mouse and human cell lineages (). Moreover we found that precocious oleic acid uptake, i.e. as soon as before induction of differentiation () or immediately after induction of differentiation () was sufficient to increase adipogenesis. At highest doses, oleic acid may also reduce cell survival, with a transcriptional activation of CIDEA in dA. This balance between adipogenic and/or apoptotic activities may explain the high variability and dose-dependent effects of oleic acid in in vitro adipogenesis studies (Fig. S6). We also found that fatty acid uptake was required for lipid droplet fusion from multilocular to unilocular adipocytes, thus improving adipocyte differentiation and maturation into fully differentiated adipocytes () through high transcriptional induction of the lipid-droplet fusion CIDEC and the major adipogenic promoting transcription factor CEBPA, with higher efficiency than insulin. If insulin was found to promote adipogenesis by increasing both cell culture lipid content and cell number in early stage of differentiation, it was however not required for oleic acid uptake, suggesting that insulin acts rather through its transcriptional activity on adipocytes than on fatty acid uptake itself.
Studies on human defective genes suggest that FAT/CD36 plays a major role in lipid metabolism and obesity-related complications.Citation58 We found that in both mouse and human adipocytes, FAT/CD36 may reduce cell survival in absence of insulin. The apparent increased lipid content in AP5258-treated culture could be the result of opposite effects on cell survival and on lipid accumulation. In absence of insulin, AP5258 reduced the positive activity of oleic acid on gene transcription, although it restored the sensitivity to oleic acid at the level of CIDEC and CIDEA gene transcription in the presence of insulin. These results thus suggest that oleic acid may mediate transcriptional regulation of CIDEC and CIDEA at least in part through FAT/CD36. FAT/CD36 level and trafficking are determinants of lipolysis in adipocytes.Citation59 It is strictly located in adipocyte lipid rafts and is translocated to the membrane by insulin,Citation60 where it mediates long fatty acid chain uptake, including oleic acidCitation61 and 65% of oxidized lipids uptake and degradation.Citation57 Activation of FAT/CD36 stimulates the pro-inflammatory response of adipocytes, possibly through activation of mitochondrial fatty-acid oxidation which increases during differentiation,Citation62,63 induction of endoplasmic stressCitation53 and in turn activates JNK to impair insulin signaling in adipocytes.Citation64 In our experiments, we found that inhibition of both FAT/CD36 and JNK improved cell survival. Several studies have previously point out the major role of JNK in the inhibition of insulin signaling by free fatty acids including JNK/IKKB pathway to desensitize IRS1,Citation65-67 thus suggesting that oleic acid modulates cell survival through FAT/CD36 and JNK pathways. In another way, oleic acid promoted adipogenesis and FAT/CD36 has been previously shown to improve adipogenesis.Citation68 Indeed, its inhibition significantly reduced the transcriptional induction of CIDEA, CIDEC, FAT/CD36 itself, and CEBPA by oleic acid in absence of insulin and partially restored their transcriptional repression by insulin. In addition to the positive effect of insulin on FAT/CD36 functionality, these pleiotropic activities of this fatty acid receptor confirm its pro-adipogenic activity and its role in obesity-induced insulin-resistance.
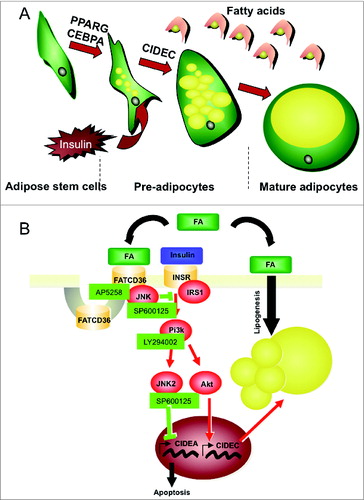
Our results support the hypothesis that oleic acid and FAT/CD36 regulate insulin-promoting activity on both adipose cell survival and differentiation through regulation of JNK activity ().
Figure 8. Schematic representation of adipogenesis (A) and modulation of related signaling pathways by FAT/CD36 (B). Committed adipose stem cells (ASCs), i.e., adipose proliferative precursors, are induced to differentiate by sequential activation of peroxisome-proliferator activator receptor gamma (PPARG) and CCAAT/enhancer binding protein α (CEBPA) transcription factors. Then adipose cells differentiate in presence of insulin which acts through (1) transcriptional activation of cell death-inducing DFFA-like effector c (CIDEC) which is involved in lipid droplet structuration and (2) through transcriptional inhibition of another lipid droplet associated protein, cell death-inducing DFFA-like effector a (CIDEA) to maintain cell survival.8 Thus insulin promotes adipogenesis through indirect activation of lipogenesis and cell survival. In adipocytes lipogenesis results from a rapid uptake of fatty acids (FA) stored in lipid droplets which increase in size and finally fuse into a unique and large droplet in mature adipocytes. FATCD36 may act as a regulator of insulin signaling pathway through inhibition of insulin signaling by activation Jun-NH2 kinase (JNK).64 Other abbreviations: INSR, insulin receptor; IRS1: insulin receptor substrate 1; Pi3k, Pi3kinase. Specific inhibitors of FATCD36, JNK and Pi3k used were AP5258, SP60025 and LY29400125, respectively.
Importantly, our data open new opportunities to study the dynamics of lipogenesis and adipogenesis working in concert during the development of adipose tissue and in its adaptive response to metabolic disorders, through either transcriptional regulations or cell structure remodeling. Moreover, we show that in addition to insulin transcriptional activity on genes involved in differentiation, survival and lipid droplet formation, fatty acids are required to increase the rate of differentiation and for the complete maturation into unilocular adipocytes.
Materials & Methods
Bio-informatic analyses
Gene datasets were retrieved from the literature, either from published experiments or Gene Ontology database at http//nih.nlm.ncbi.gov and incorporated in Excel tables. Gene data sets representative of human adipocyte phenotype were raised by compilation of lists of genes significantly (i.e., z-test confidence level > 95%) overexpressed in either adipose stem cells (hASCs), adipose cell differentiated (dA) in culture or isolated adipose tissue (TA) from published or GO datasets, as well as mouse adipose genes (Supplementary Data 1). All data sets are reported in . Human liver gene set was obtained in a previous study.Citation29 KEGG pathways gene number counts Citation69 were performed to raise gene datasets representative of either phenotypes or data sets (Supplementary Data 2).
Cell culture
Mouse 3T3L1 fibroblasts were grown in Dulbecco's Modified Eagle's Medium with high glucose (4,5 g/L) and containing 10% fetal calf serum (DMEM 10%FCS, PAA Laboratories, Les Mureaux, France) and antibiotics (streptomycin and penicillin 100 units/ml, Sigma Aldrich, St. Quentin Fallavier, France). When they reached confluency, differentiation was induced by replacing media by DMEM 10% FCS media supplemented with 0.25 mM dexamethazone, 0.25 mM isobutylmethylxanthine (IBMX), 0.20 mM rosiglitazone (Sigma Aldrich) and insulin 0.05 mU/ml (Actrapid). Three days later, media was replaced by DMEM 10% FCS media containing dexamethasone and insulin at similar concentrations. Then media were replaced every 2–3 d by DMEM 10%FCS media with insulin alone.
Human adipose stromal cells (hASCs) were isolated from liposuctions of the same female patients undergoing surgery with a 3 mm cannula (100 to 200 ml), according to French regulation after declaration to research ministry (DC n°2008162) and written informed consent from the patient. ASCs were isolated after collagenase digestion from the stroma-vascular fraction then amplified in proliferation media containing 10 ng/ml bFGF (Sigma Aldrich).Citation28 Cells were used at passages 3 to 5.
Real-time cell analysis
Both mouse and human adipocyte precursors were seeded at high density (20 000 cells/cm2) for differentiation experiments or 5000 cells/cm2 for proliferation assays in either E-plates 96, E-view 96, Costar 96-wells or 12 wells plates, for other experiments. Cells were grown at 37°C in 5% CO2 in DMEM 10%FCS with high glucose, and removed using trypsin 0.05% (PAA Laboratories, Les Mureaux, France). Cell proliferation and/or survival was monitored with the xCELLigence Real-time Cell Analyzer (RTCA) System (ACEA Biosciences, Inc., San Diego, USA), which allows label-free monitoring changes of cell number, viability, morphology and quality of cell attachment by measurement of cell-to electrode responses of cells seeded in E96-well plates manufactured with integrated microelectronic sensor arrays. RTCA system measures cell surface occupancy, i.e. cell index, taking into account cell number, cell size and adhesion force. These 3 cumulative parameters were distinguished using complementary analyzes of cell size and number performed at selected times using cell count, size fractionation with either Scepter cell counter and Multisizer Beckman Coulter, cell cycle analysis through flow cytometry, cell count and imaging using Cytation 3 to characterize the major events of adipogenesis (Supplementary Data 3–5). Adhesion force and cell size were linked to adipogenesis as lipid accumulation may modulate cell survival and cell size and reduced cell adhesion force due to lipid uptake. The results are represented as cell indexes or cell indexes normalized at time of treatment (i.e., cell index at time x divided by cell index at time of treatment) or delta cell index (i.e. cell index at selected time minus cell index at time of treatment). Since proliferation rate and cell index may vary from an experiment to another, data are representative experiments of at least 3 independent experiments and each condition was tested in at least 6 replicates. Cells were plated in 6 well-plates for other experiments in the respect of cell plating density. Cell were treated in DMEM 10%FCS one day after plating. Oleic acid was diluted in lipid-free bovine serum albumin (BSA) 5% or in human lipid-free serum albumin (hSA) in DMEM 10% FCS and pre-incubated at least 2 h at 37°C before use. FAT/CD36 inhibitor AP5258 was provided by Clinigenetics (Lyon, France). Apoptosis inhibitor II (Millipore SAS, Saint Quentin-en-Yvelines, France), Jun-NH2 kinase (JNK) and Pi3kinase specific inhibitors, respectively SP600125 and LY294002 were used at optimized concentrations. Oleic acid, BSA and hSA, SP600125, and LY294002 were purchased from Sigma Aldrich.
Cell cycle analysis by flow cytometry
Cells in suspension were fixed in ethanol 70% then treated with 10 μg/mL RNAse H (Promega, Charbonnières, France) in phosphate buffer saline (PBS) during 1 h before Propidium iodine (Sigma Aldrich) was added (50 μg/mL). Flow cytometric analysis of 5000 cells was performed on a FACSCantoII flow cytometer and data were recovered using the FACSDiva software v6.1.2 (BD Biosciences, Rungis, France). DNA content was determined using FlowJo software v8.8.6 (http://www.flowjo.com).
Human tissue and isolated adipocytes
Human white adipose tissues were obtained by surgical biopsies (); 50–100 mg tissue samples were rinsed twice with NaCl 0,9% (v/v) at 37°C, twice in 50 mM 2,4,6-trimethylpyridine/NaCl 0,9% and fixed in 0.12 M osmium tetroxide/50mM 2,4,6- trimethylpyridine/NaCl 0,9% (Sigma Aldrich, Saint Quentin Fallavier, France) for 96 h at room temperature. Samples were washed with saline for 24 h, then the saline was replaced by 10 mL of 8 M-urea for 72 h with occasional swirling to liberate the cells. Samples were then washed with 0.01% TRITON X-100 (v/v) in NaCl buffer. Before analysis, supernatant was discarded and cells were resuspended in glycerol. Cells were then diluted to analyze adipocyte size distribution.
Table 4. Anthropometric parameters of ASCs donors (women)
Adipocytes were isolated from human white adipose tissue by digestion with 1 mg/mL collagenase (type 1, Sigma Aldrich) in Krebs-Ringer medium without phosphate, buffered to pH 7.4 with 10 mM HEPES and containing 2% fatty acid-free BSA, 2 mM glucose, and 200 nM adenosine to inhibit lipolysis. Isolated cells were washed 3 times with this media then in this media containing 0.1% BSA and counted using Mallassez cell before fixation in osmic acid for cell size analyses.
Cell size monitoring
Both for plating and analysis, Scepter® handheld automated cell counter (Millipore S.A.S., St Quentin-en-Yvelines, France) was used with 60 μm tips on living cells in suspension, measured at least in triplicate for cell diameters ranging from 6 to 36 μm. The adipocyte size distribution was determined on either living or fixed cells using a Beckman Coulter Counter Multisizer IV with either a 100 or a 400 μm aperture. The range of cell sizes that can effectively be measured using these apertures are 6-60 μm or 24-240 μm, respectively. Cells were removed with either trypsin (Gibco BRL, Thermo Fisher Scientific, Villebon-sur-Yvette, France) or collagenase (2 mg/ml, Sigma Aldrich) or Accutase (Millipore SAS, Saint-Quentin-en-Yvelines, France) then used either freshly after dilution in DMEM 10%FCS or fixed in either formalin solution, neutral buffered 10% or osmic acid (0,12 M osmium tetroxide/50 mM 2,4,6- trimethylpyridine/NaCl 0,–9%, Sigma Aldrich) then washed and resuspended in PBS before analysis. After collection of pulse sizes the data were expressed as particle diameters and displayed as histograms of count frequency against diameter using linear bings and linear scale for the cell diameters. Cell-size distributions were drawn from measurement of at least 20000 cell diameters per sample in triplicate.
Cell and tissue imaging
Images were taken at x4 to X40 magnification using either an Axiovert 200 microscope coupled to AxioCam and Axiovision Rel 4.8.1 software (Carl Zeiss SAS, Marly-le-Roi, France) or to a Cytation 3 cell imaging reader (Biotek Instrument Inc., Colmar, France) on either living cells maintained at 37°C or cells fixed with formalin 10% (Sigma Aldrich). For lipid labeling, cells were either labeled with Red Oil (Sigma Aldrich) on fixed cells or with AdipoRed Assay reagent (Lonza France SARL, Levallois-Perret, France) on living cells according to standard procedures. After AdipoRed assay, cells were fixed with formalin, washed in PBS then treated with 0.1% Triton X100 and labeled with Hoechst 33258 1 μg/mL and/or phalloidin Atto 498 or Phalloïdin TRITC 50 μg/mL (Sigma Aldrich). Fluorescence intensities were measured at 350 nm (excitation) /461 nm (emission) for Hoechst 33258, 535 / 572 for AdipoRed and 540 / 570 for phalloidin TRITC on Cytation 3 system for imaging and statistical analyses on 96-wells or on E-plates 96 wells were performed on fluorescence intensities. Each condition was measured at least 5 times for each well and in 6 to 8 wells. Ratio of AdipoRed fluorescent intensities normalized to those of Hoechst were calculated for each mean value per well and were confirmed by image fluorescence counting on at least 3 areas (1 mm2) per well and imaging at fixed conditions for AdipoRed at magnification x20 with filters 469/525, 586/647, 377/447 for AdipoRed, Hoechst 33258 and Phalloidin TRITC, respectively.
qRT-PCR analysis of gene expression
Total RNA purifications from 3T3L1 cells were performed according to standard protocol (Qiagen Quick prep mRNA, Qiagen, Courtaboeuf, France) including a DNase treatment. RNA integrity was assessed with the Agilent 2100 Bioanalyzer and RNA 6000 LabChip Kit (Agilent Technologies, Massy, France). First strand cDNAs were synthesized from 500 ng of total RNA in the presence of 100 U of Superscript (Invitrogen-Life Technologies, Eragny, France) and random hexamers and oligodT primers (Promega). Real-time quantitative PCR (RT-qPCR) was performed using ABsolute™ QPCR SYBR® Green ROX Mix (Abgene, Courtaboeuf, France) with a Nano LC Light Cycler (Roche Diagnosis). Adiponectin forward and reverse primers used were 5′CTT-CTC-CAG-GTT-CTC-CTT-TCC-TGC and 5′AGG-CCG-TGA-TGG-CAG-AGA-TG, respectively, CIDEA, CIDEC, FAT/CD36 and FABP4 primers from the study of Steiger and colleagues.32 Levels of target mRNAs were normalized to hypoxanthine phosphoribosyltransferase 1 (HPRT1) expression (sequence of primers are available in ref. 29 measured at least on 3 independent experiments and data are presented as mean ± SD. Comparative analyzes were performed on a representative experiment in at least 4 replicates and significance was measured using ANOVA variance test.
Disclosure of Potential Conflicts of Interest
No potential conflicts of interest were disclosed.
Supplemental Material
Supplemental data for this article can be accessed on the publisher's website
KADI_A_987578_Supplementary_Materials.zip
Download Zip (33.4 MB)Acknowledgments
We thank Lilas Hadji for her technical assistance with preparation and size analysis of human adipose tissues and isolated adipocytes.
References
- de Ferranti S, Mozaffarian D. The perfect storm: obesity, adipocyte dysfunction, and metabolic consequences. Clin Chem 2008; 54:945-55; PMID:18436717; http://dx.doi.org/10.1373/clinchem.2007.100156
- Tang QQ, Lane MD. Adipogenesis: from stem cell to adipocyte. Ann Rev Biochem 2012; 81:715-36; PMID:22463691; http://dx.doi.org/10.1146/annurev-biochem-052110-115718
- Sorisky A, Molgat AS, Gagnon A. Macrophage-induced adipose tissue dysfunction and the preadipocyte: should I stay (and differentiate) or should I go? Adv Nutr 2013; 4:67-75; PMID:23319125; http://dx.doi.org/10.3945/an.112.003020
- Gregoire FM, Smas CM, Sul HS. Understanding adipocyte differentiation. Physiol Rev 1998; 78:783-809; PMID:9674695
- Koh YJ, Park BH, Park JH, Han J, Lee IK, Park JW, Koh GY. Activation of PPAR gamma induces profound multilocularization of adipocytes in adult mouse white adipose tissues. Exp Mol Med 2009; 41:880-95; PMID:19745605; http://dx.doi.org/10.3858/emm.2009.41.12.094
- Puri V, Ranjit S, Konda S, Nicoloro SM, Straubhaar J, Chawla A, Chouinard M, Lin C, Burkart A, Corvera S, et al. Cidea is associated with lipid droplets and insulin sensitivity in humans. Proc Natl Acad Sci U S A 2008 ;105(22):7833-8; PMID:18509062; http://dx.doi.org/10.1073/pnas.0802063105
- Géloën A, Roy PE, Bukowiecki LJ. Regression of white adipose tissue in diabetic rats. Am J Physiol 1989; 257:E547-53; PMID:2801936
- Ito M, Nagasawa M, Omae N, Ide T, Akasaka Y, Murakami K. Differential regulation of CIDEA and CIDEC expression by insulin via Akt1/2- and JNK2-dependent pathways in human adipocytes. J Lipid Res 2011; 52:1450-60; PMID:21636835; http://dx.doi.org/10.1194/jlr.M012427
- Berry R, Jeffery E, Rodeheffer MS. Weighing in on adipocyte precursors. Cell Metab 2014; 19:8-20; PMID:24239569; http://dx.doi.org/10.1016/j.cmet.2013.10.003
- Coburn CT, Knapp FF, Jr., Febbraio M, Beets AL, Silverstein RL, Abumrad NA. Defective uptake and utilization of long chain fatty acids in muscle and adipose tissues of CD36 knockout mice. J Biol Chem 2000; 275:32523-9; PMID:10913136; http://dx.doi.org/10.1074/jbc.M003826200
- Coburn CT, Hajri T, Ibrahimi A, Abumrad NA. Role of CD36 in membrane transport and utilization of long-chain fatty acids by different tissues. J Mol Neurosci 2001; 16:117-21; discussion 51-7; PMID:11478366; http://dx.doi.org/10.1385/JMN:16:2-3:117
- Ibrahimi A, Abumrad NA. Role of CD36 in membrane transport of long-chain fatty acids. Curr Opin Clin Nutr Metab Care 2002; 5:139-45; PMID:11844979; http://dx.doi.org/10.1097/00075197-200203000-00004
- Luiken JJ, Bonen A, Glatz JF. Cellular fatty acid uptake is acutely regulated by membrane-associated fatty acid-binding proteins. Prostaglandins LeukotEssent Fatty Acids 2002; 67:73-8; PMID:12324223; http://dx.doi.org/10.1054/plef.2002.0401
- Wilsie LC, Chanchani S, Navaratna D, Orlando RA. Cell surface heparan sulfate proteoglycans contribute to intracellular lipid accumulation in adipocytes. Lipids Health Dis 2005; 4:2; PMID:15636641; http://dx.doi.org/10.1186/1476-511X-4-2
- Rodrigue-Way A, Demers A, Ong H, Tremblay A. A growth hormone-releasing peptide promotes mitochondrial biogenesis and a fat burning-like phenotype through scavenger receptor CD36 in white adipocytes. Endocrinology 2007; 148:1009-18; PMID:17138655; http://dx.doi.org/10.1210/en.2006-0975
- Ali AH, Koutsari C, Mundi M, Stegall MD, Heimbach JK, Taler SJ, Nygren J, Thorell A, Bogachus LD, Turcotte LP, et al. Free fatty acid storage in human visceral and subcutaneous adipose tissue: role of adipocyte proteins. Diabetes 2011; 60:2300-7; PMID:21810594; http://dx.doi.org/10.2337/db11-0219
- Oh D, Lagakos WS. The role of G-protein-coupled receptors in mediating the effect of fatty acids on inflammation and insulin sensitivity. Curr Opin Clin Nutr Metab Care. 2011; 14(4):322-7; PMID:21587066; http://dx.doi.org/10.1097/MCO.0b013e3283479230
- Zhan T, Poppelreuther M, Ehehalt R, Fullekrug J. Overexpressed FATP1, ACSVL4/FATP4 and ACSL increase the cellular fatty acid uptake of 3T3-L1 adipocytes but are localized on intracellular membranes. PloS One 2012; 7:e45087; PMID:23024797; http://dx.doi.org/10.1371/journal.pone.0045087
- Ailhaud G. Cell surface receptors, nuclear receptors and ligands that regulate adipose tissue development. Clin Chim Acta 1999; 286:181-90; PMID:10511291; http://dx.doi.org/10.1016/S0009-8981(99)00100-X
- Kralisch S, Sommer G, Stangl V, Kohler U, Kratzsch J, Stepan H, Faber R, Schubert A, Lossner U, Vietzke A, et al. Secretory products from human adipocytes impair endothelial function via nuclear factor kappaB. Atherosclerosis 2008; 196:523-31; PMID:17603062; http://dx.doi.org/10.1016/j.atherosclerosis.2007.05.016
- Hadji L, Berger E, Soula H, Vidal H, Géloën A. White adipose tissue resilience to insulin deprivation and replacement. PLoS One. 2014; 9(8):e106214; PMID:25170835; http://dx.doi.org/10.1371/journal.pone.0106214
- Drolet R, Richard C, Sniderman AD, Mailloux J, Fortier M, Huot C, Rheaume C, Tchernof A. Hypertrophy and hyperplasia of abdominal adipose tissues in women. Int J Obes (Lond) 2008; 32:283-91; PMID:17726433; http://dx.doi.org/10.1038/sj.ijo.0803708
- Edwards MS, Smith BA, Kainer RA, Sutherland TM. Effect of dietary fat and aging on adipose tissue cellularity in mice differing in genetic predisposition to obesity. Growth DevAging 1993; 57:45-51; PMID:8454392
- Marques BG, Hausman DB, Martin RJ. Association of fat cell size and paracrine growth factors in development of hyperplastic obesity. Am J Physiol 1998; 275:R1898-908; PMID:9843879
- Aslan H, Altunkaynak BZ, Altunkaynak ME, Vuraler O, Kaplan S, Unal B. Effect of a high fat diet on quantitative features of adipocytes in the omentum: an experimental, stereological and ultrastructural study. Obes Surg 2006; 16:1526-34; PMID:17132420; http://dx.doi.org/10.1381/096089206778869942
- Joe AW, Yi L, Even Y, Vogl AW, Rossi FM. Depot-specific differences in adipogenic progenitor abundance and proliferative response to high-fat diet. Stem Cells 2009; 27:2563-70; PMID:19658193; http://dx.doi.org/10.1002/stem.190
- Hensler M, Bardova K, Jilkova ZM, Wahli W, Meztger D, Chambon P, Kopecky J, Flachs P. The inhibition of fat cell proliferation by n-3 fatty acids in dietary obese mice. Lipids Health Dis 2011; 10:128; PMID:21810216; http://dx.doi.org/10.1186/1476-511X-10-128
- Lequeux C, Auxenfans C, Mojallal A, Sergent M, Damour O. Optimization of a culture medium for the differentiation of preadipocytes into adipocytes in a monolayer. Biomed Mater Eng 2009; 19:283-91; PMID:20042795
- Berger E, Vega N, Vidal H, Geloen A. Gene network analysis leads to functional validation of pathways linked to cancer cell growth and survival. Biotechnol J 2012; 7:1395-404; PMID:22930530; http://dx.doi.org/10.1002/biot.201200188
- Kramer AH, Joos-Vandewalle J, Edkins AL, Frost CL, Prinsloo E. Real-time monitoring of 3T3-L1 preadipocyte differentiation using a commercially available electric cell-substrate impedance sensor system. Biochem Biophys Res Commun 2014 ;443(4):1245-50; PMID:24388983; http://dx.doi.org/10.1016/j.bbrc.2013.12.123
- Geloen A, Helin L, Geeraert B, Malaud E, Holvoet P, Marguerie G. CD36 inhibitors reduce postprandial hypertriglyceridemia and protect against diabetic dyslipidemia and atherosclerosis. PLoS One. 2012;7(5):e37633; PMID:22662181; http://dx.doi.org/10.1371/journal.pone.0037633
- Steger DJ, Lefterova MI, Ying L, Stonestrom AJ, Schupp M, Zhuo D, Vakoc AL, Kim JE, Chen J, Lazar MA, et al. DOT1L/KMT4 recruitment and H3K79 methylation are ubiquitously coupled with gene transcription in mammalian cells. Mol Cell Biol. 2008 ; 28(8):2825-39; PMID:18285465; http://dx.doi.org/10.1128/MCB.02076-07
- Catalan V, Gomez-Ambrosi J, Rodriguez A, Fruhbeck G. Role of extracellular matrix remodelling in adipose tissue pathophysiology: relevance in the development of obesity. Histology and histopathology 2012; 27:1515-28; PMID:23059882
- Dankel SN, Fadnes DJ, Stavrum AK, Stansberg C, Holdhus R, Hoang T, Veum VL, Christensen BJ, Vage V, Sagen JV, et al. Switch from stress response to homeobox transcription factors in adipose tissue after profound fat loss. PloS One 2010; 5:e11033; PMID:20543949; http://dx.doi.org/10.1371/journal.pone.0011033
- Adapala VJ, Adedokun SA, Considine RV, Ajuwon KM. Acute inflammation plays a limited role in the regulation of adipose tissue COL1A1 protein abundance. J Nutr Biochem 2012; 23:567-72; PMID:21775118; http://dx.doi.org/10.1016/j.jnutbio.2011.02.013
- Bouloumie A, Sengenes C, Portolan G, Galitzky J, Lafontan M. Adipocyte produces matrix metalloproteinases 2 and 9: involvement in adipose differentiation. Diabetes 2001; 50:2080-6; PMID:11522674; http://dx.doi.org/10.2337/diabetes.50.9.2080
- Johansson LE, Danielsson AP, Parikh H, Klintenberg M, Norstrom F, Groop L, Ridderstrale M. Differential gene expression in adipose tissue from obese human subjects during weight loss and weight maintenance. Am J Clin Nutr 2012; 96:196-207; PMID:22648723; http://dx.doi.org/10.3945/ajcn.111.020578
- Nair S, Lee YH, Rousseau E, Cam M, Tataranni PA, Baier LJ, Bogardus C, Permana PA. Increased expression of inflammation-related genes in cultured preadipocytes/stromal vascular cells from obese compared with non-obese Pima Indians. Diabetologia 2005; 48:184-8; PMID:16034612; http://dx.doi.org/10.1007/s00125-005-1868-2
- Tinahones FJ, Coin-Araguez L, Mayas MD, Garcia-Fuentes E, Hurtado-Del-Pozo C, Vendrell J, Cardona F, Calvo RM, Obregon MJ, El Bekay R. Obesity-associated insulin resistance is correlated to adipose tissue vascular endothelial growth factors and metalloproteinase levels. BMC Physiol 2012; 12:4; PMID:22471305; http://dx.doi.org/10.1186/1472-6793-12-4
- Lebeck J. Metabolic impact of the glycerol channels AQP7 and AQP9 in adipose tissue and liver. J Mol Endocrinol 2014; 52:R165-78; PMID:24463099; http://dx.doi.org/10.1530/JME-13-0268
- Marrades MP, Milagro FI, Martinez JA, Moreno-Aliaga MJ. Differential expression of aquaporin 7 in adipose tissue of lean and obese high fat consumers. Biochem Biophys Res Commun 2006; 339:785-9; PMID:16325777; http://dx.doi.org/10.1016/j.bbrc.2005.11.080
- Lobo S, Wiczer BM, Bernlohr DA. Functional analysis of long-chain acyl-CoA synthetase 1 in 3T3-L1 adipocytes. J Biol Chem 2009 ; 284(27):18347-56; PMID:19429676; http://dx.doi.org/10.1074/jbc.M109.017244
- Ellis JM, Li LO, Wu PC, Koves TR, Ilkayeva O, Stevens RD, Watkins SM, Muoio DM, Coleman RA. Adipose acyl-CoA synthetase-1 directs fatty acids toward beta-oxidation and is required for cold thermogenesis. Cell Metab 2010; 12:53-64; PMID:20620995; http://dx.doi.org/10.1016/j.cmet.2010.05.012
- Schneider H, Staudacher S, Poppelreuther M, Stremmel W, Ehehalt R, Fullekrug J. Protein mediated fatty acid uptake: Synergy between CD36/FAT-facilitated transport and acyl-CoA synthetase-driven metabolism. Arch Biochem Biophys 2014; 546:8-18; PMID:24503477; http://dx.doi.org/10.1016/j.abb.2014.01.025
- Mukherjee R, Yun JW. Long chain acyl CoA synthetase 1 and gelsolin are oppositely regulated in adipogenesis and lipogenesis. Biochem Biophys Res Commun 2012; 420:588-93; PMID:22445754; http://dx.doi.org/10.1016/j.bbrc.2012.03.038
- Wang SP, Laurin N, Himms-Hagen J, Rudnicki MA, Levy E, Robert MF, Pan L, Oligny L, Mitchell GA. The adipose tissue phenotype of hormone-sensitive lipase deficiency in mice. Obesity Res 2001; 9:119-28; PMID:11316346; http://dx.doi.org/10.1038/oby.2001.15
- Klannemark M, Orho M, Langin D, Laurell H, Holm C, Reynisdottir S, Arner P, Groop L. The putative role of the hormone-sensitive lipase gene in the pathogenesis of Type II diabetes mellitus and abdominal obesity. Diabetologia 1998; 41:1516-22; PMID:9867220; http://dx.doi.org/10.1007/s001250051099
- Bickel PE, Tansey JT, Welte MA. PAT proteins, an ancient family of lipid droplet proteins that regulate cellular lipid stores. Biochim Biophys Acta 2009; 1791:419-40; PMID:19375517; http://dx.doi.org/10.1016/j.bbalip.2009.04.002
- Lafontan M, Langin D. Lipolysis and lipid mobilization in human adipose tissue. Prog Lipid Res 2009; 48:275-97; PMID:19464318; http://dx.doi.org/10.1016/j.plipres.2009.05.001
- Ray H, Pinteur C, Frering V, Beylot M, Large V. Depot-specific differences in perilipin and hormone-sensitive lipase expression in lean and obese. Lipids Health Dis 2009; 8:58; PMID:20017959; http://dx.doi.org/10.1186/1476-511X-8-58
- Miyoshi H, Souza SC, Endo M, Sawada T, Perfield JW, 2nd, Shimizu C, Stancheva Z, Nagai S, Strissel KJ, Yoshioka N, et al. Perilipin overexpression in mice protects against diet-induced obesity. J Lipid Res 2010; 51:975-82; PMID:19797618; http://dx.doi.org/10.1194/jlr.M002352
- Silverstein RL, Febbraio M. CD36, a scavenger receptor involved in immunity, metabolism, angiogenesis, and behavior. Sci Signal 2009; 2:re3; PMID:19471024; http://dx.doi.org/10.1126/scisignal.272re3
- Cai L, Wang Z, Ji A, Meyer JM, van der Westhuyzen DR. Scavenger receptor CD36 expression contributes to adipose tissue inflammation and cell death in diet-induced obesity. PloS One 2012; 7:e36785; PMID:22615812; http://dx.doi.org/10.1371/journal.pone.0036785
- Bonen A, Tandon NN, Glatz JF, Luiken JJ, Heigenhauser GJ. The fatty acid transporter FAT/CD36 is upregulated in subcutaneous and visceral adipose tissues in human obesity and type 2 diabetes. Int J Obes (Lond) 2006; 30:877-83; PMID:16418758; http://dx.doi.org/10.1038/sj.ijo.0803212
- Fisher RM, Hoffstedt J, Hotamisligil GS, Thorne A, Ryden M. Effects of obesity and weight loss on the expression of proteins involved in fatty acid metabolism in human adipose tissue. Int J Obes Relat Metab Disord 2002; 26:1379-85; PMID:12355335; http://dx.doi.org/10.1038/sj.ijo.0802110
- Gertow K, Pietilainen KH, Yki-Jarvinen H, Kaprio J, Rissanen A, Eriksson P, Hamsten A, Fisher RM. Expression of fatty-acid-handling proteins in human adipose tissue in relation to obesity and insulin resistance. Diabetologia 2004; 47:1118-25; PMID:15168018; http://dx.doi.org/10.1007/s00125-004-1417-4
- Kuniyasu A, Hayashi S, Nakayama H. Adipocytes recognize and degrade oxidized low density lipoprotein through CD36. Biochem Biophys Res Commun 2002; 295:319-23; PMID:12150950; http://dx.doi.org/10.1016/S0006-291X(02)00666-6
- Love-Gregory L, Abumrad NA. CD36 genetics and the metabolic complications of obesity. Curr Opin Clin Nutr Metab Care 2011; 14:527-34; PMID:21912245; http://dx.doi.org/10.1097/MCO.0b013e32834bbac9
- Zhou D, Samovski D, Okunade AL, Stahl PD, Abumrad NA, Su X. CD36 level and trafficking are determinants of lipolysis in adipocytes. FASEB J 2012; 26:4733-42; PMID:22815385; http://dx.doi.org/10.1096/fj.12-206862
- van Oort MM, van Doorn JM, Bonen A, Glatz JF, van der Horst DJ, Rodenburg KW, Luiken JJ. Insulin-induced translocation of CD36 to the plasma membrane is reversible and shows similarity to that of GLUT4. Biochim Biophys Acta 2008; 1781:61-71; PMID:18167317; http://dx.doi.org/10.1016/j.bbalip.2007.11.006
- Pohl J, Ring A, Ehehalt R, Schulze-Bergkamen H, Schad A, Verkade P, Stremmel W. Long-chain fatty acid uptake into adipocytes depends on lipid raft function. Biochemistry 2004; 43:4179-87; PMID:15065861; http://dx.doi.org/10.1021/bi035743m
- Holloway GP, Luiken JJ, Glatz JF, Spriet LL, Bonen A. Contribution of FAT/CD36 to the regulation of skeletal muscle fatty acid oxidation: an overview. Acta Physiol (Oxf) 2008; 194:293-309; PMID:18510711; http://dx.doi.org/10.1111/j.1748-1716.2008.01878.x
- Ducluzeau PH, Priou M, Weitheimer M, Flamment M, Duluc L, Iacobazi F, Soleti R, Simard G, Durand A, Rieusset J, et al. Dynamic regulation of mitochondrial network and oxidative functions during 3T3-L1 fat cell differentiation. J Physiol Biochem 2011; 67:285-96; PMID:21267801; http://dx.doi.org/10.1007/s13105-011-0074-6
- Kennedy DJ, Kuchibhotla S, Westfall KM, Silverstein RL, Morton RE, Febbraio M. A CD36-dependent pathway enhances macrophage and adipose tissue inflammation and impairs insulin signalling. Cardiovasc Res 2011; 89:604-13; PMID:21088116; http://dx.doi.org/10.1093/cvr/cvq360
- Gao X, Li K, Hui X, Kong X, Sweeney G, Wang Y, Xu A, Teng M, Liu P, Wu D. Carnitine palmitoyltransferase 1A prevents fatty acid-induced adipocyte dysfunction through suppression of c-Jun N-terminal kinase. Biochem J 2011; 435(3):723-32; PMID:21348853; http://dx.doi.org/10.1042/BJ20101680
- Nguyen MT, Satoh H, Favelyukis S, Babendure JL, Imamura T, Sbodio JI, Zalevsky J, Dahiyat BI, Chi NW, Olefsky JM. JNK and tumor necrosis factor-alpha mediate free fatty acid-induced insulin resistance in 3T3-L1 adipocytes. J Biol Chem 2005;280(42):35361-71; PMID:16085647; http://dx.doi.org/10.1074/jbc.M504611200
- Jiao P, Chen Q, Shah S, Du J, Tao B, Tzameli I, Yan W, Xu H. Obesity-related upregulation of monocyte chemotactic factors in adipocytes: involvement of nuclear factor-kappaB and c-Jun NH2-terminal kinase pathways. Diabetes. 2009;58(1):104-15; PMID:18835938; http://dx.doi.org/10.2337/db07-1344
- Christiaens V, Van Hul M, Lijnen HR, Scroyen I. CD36 promotes adipocyte differentiation and adipogenesis. Biochim Biophys Acta. 2012; 1820(7):949-56; PMID: 22507268
- Wrzodek C, Buchel F, Ruff M, Drager A, Zell A. Precise generation of systems biology models from KEGG pathways. BMC Sys Biol 2013; 7:15; PMID:23433509; http://dx.doi.org/10.1186/1752-0509-7-15