
Abstract
Cancer cell lines are a tremendous resource for cancer biology and therapy development. These multipurpose tools are commonly used to examine the genetic origin of cancers, to identify potential novel tumor targets, such as tumor antigens for vaccine development, and utilized to screen potential therapies in preclinical studies. Mutations, gene expression, and drug sensitivity have been determined for many cell lines using next-generation sequencing (NGS). However, the human leukocyte antigen (HLA) type and HLA expression of tumor cell lines, characterizations necessary for the development of cancer vaccines, have remained largely incomplete and, such information, when available, has been distributed in many publications. Here, we determine the 4-digit HLA type and HLA expression of 167 cancer and 10 non-cancer cell lines from publically available RNA-Seq data. We use standard NGS RNA-Seq short reads from “whole transcriptome” sequencing, map reads to known HLA types, and statistically determine HLA type, heterozygosity, and expression. First, we present previously unreported HLA Class I and II genotypes. Second, we determine HLA expression levels in each cancer cell line, providing insights into HLA downregulation and loss in cancer. Third, using these results, we provide a fundamental cell line “barcode” to track samples and prevent sample annotation swaps and contamination. Fourth, we integrate the cancer cell-line specific HLA types and HLA expression with available cell-line specific mutation information and existing HLA binding prediction algorithms to make a catalog of predicted antigenic mutations in each cell line. The compilation of our results are a fundamental resource for all researchers selecting specific cancer cell lines based on the HLA type and HLA expression, as well as for the development of immunotherapeutic tools for novel cancer treatment modalities.
Abbreviations:
- BRENDA, BRaunschweig ENzyme Database
- CCLE, Cancer Cell Line Encyclopedia
- COSMIC, Catalog of Somatic Mutations in Cancer
- DLBCL, diffuse large B-cell lymphoma
- HLA, Human Leukocyte Antigen
- IEDB, Immune Epitope Database
- NGS, Next Generation Sequencing
- RNA-Seq, RNA Sequencing
- RPKM, reads per kilobase of exon model per million mapped reads
- SNV, single nucleotide variation
- nsSNV, non synonymous SNV
- SRA, Sequence Read Archive
Introduction
Cancer cell lines are a tremendous resource that provide a fundamental model for cancer, immunologic and therapeutic research and development.Citation1,2 The better the genomic biochemical and molecular state and status of individual cell lines are known, the better we can interpret and extrapolate the results from cell line studies as surrogates for patient tumors.
Indeed, the advent of high throughput profiling technologies has enabled the determination of the genomic and transcriptomic states of cancer cell lines. The COSMIC Cell Lines ProjectCitation3 has curated comprehensive data on somatic mutations in a broad range of human cell lines and primary tumors and the Broad-Novartis Cancer Cell Line Encyclopedia (CCLE)Citation4 has determined genetic alterations and gene expression profiles in over 1000 cell lines.
Conversely, less attention has been given to tumor immunomics,Citation5 such as human leukocyte antigen (HLA) typing, HLA expression, and the identification of immunogenic peptides presented on tumor HLA molecules. Information in the public domain about HLA types and HLA expression in cancer cell lines is largely incomplete and frequently undetermined. Computational tools drawn largely from infectious disease research, such as the algorithms available at the Immune Epitope Database (IEDB),Citation6 predict the binding strength of a given peptide to a particular MHC molecule.
In the development of cancer immunotherapies, it is frequently critical to have model systems such as cell lines with a specific HLA type. For example, when developing a peptide vaccine, one may want access to an HLA A*02 positive cell lineCitation7 to identify HLA-presented ligands and test T-cell activity. Further, many frequent cancer mutations are predicted to bind HLA Class I alleles with high-affinity (IC50 <= 50 nM)Citation8 and may be suitable for prophylactic cancer vaccination.Citation9 Individual tumors accumulate on average ∼10 HLA-A*02:01 mutation-containing epitopes.Citation10 Developing the tools to rapidly identify the tumor-specific HLA-presented mutations in an HLA-specific context may enable therapeutic vaccination.Citation11,12 Thus, for further development and testing of immunotherapies, especially in proof-of-concept and preclinical studies, a catalog of cancer cell line immunologic information is needed.
This report determines and catalogs cell line HLA types and HLA expression, and further, predicts likely antigenic mutation candidates. Using publically available NGS RNA-Seq short reads from 177 human cancer and non-cancer cell lines, we determined HLA Class I and II types, HLA heterozygosity, and locus-specific HLA expression. Not only were we able to determine the HLA types of the samples, but we found large differences in the expression of HLA molecules in specific tumor contexts. Integrating the determined cell line-specific HLA type and somatic mutations, we used HLA binding algorithms to identify likely antigenic mutation candidates for 108 widely used cancer cell lines.
Results
HLA typing of 177 human cancer and normal cell lines
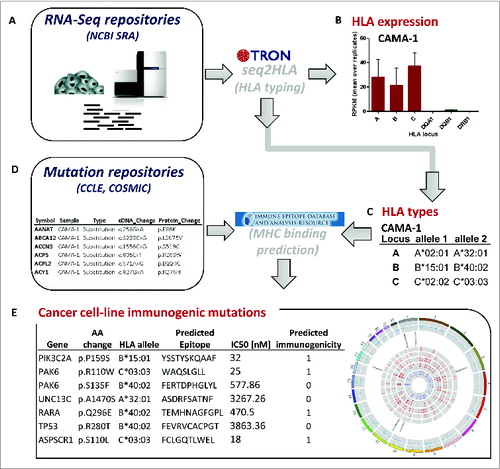
Applying our pipeline () to RNA-Seq data from 167 human cancer and 10 non-cancer cell lines, we generated the largest catalog of cell line HLA types ( Table S1) compiled to date. The 177 cell lines include 62 from breast tissue, including 5 non-cancerous breast cell lines and one matched lymphocyte cell line, 34 from B cells and 24 from lung-derived cancer and normal cell lines (Fig. S1). As an exemplar, we found 2 RNA-Seq datasets from the breast adenocarcinoma cell line CAMA-1 and the workflow determined the HLA type of CAMA-1 as A*02:01, A*32:01, B*15:01, B*40:02, C*02:02, and C*03:03 ().
Table 1. HLA typings from 10 selected cancer cell lines. HLA Class I (A) and HLA Class II typings (B) as determined by seq2HLA. +HLA I and/or II types (sometimes 2 digits only) reported in literature and confirmed by seq2HLA; ++Ambiguity as 4 digit typing not possible due to scarcity of reads; n.a., no typing possible due to no detectable expression, ‘ambiguity flag
Figure 1. Data integration and computational workflow. Cancer cell line RNA-Seq samples were retrieved from NCBI Sequence Read Archive (SRA) (A), which are input into our bioinformatics software seq2HLA to determine the 4-digit HLA expression (B) and type (C). The cell-line specific HLA types (C) and cell-line specific non-synonymous somatic mutations (D) from mutation repositories, such as Broad-Novartis Cancer Cell Line Encyclopedia (CCLE), were processed with the Immune Epitope Database (IEDB) consensus HLA presentation algorithm to predict high-affinity HLA-presented (antigenic) mutations. The list of predicted HLA-binding mutation epitopes is output (E), containing the HLA allele to which the neo-epitope is predicted to bind and the predicted IC50 value in nanomolar (nM).
To test the robustness and confirm our predictions, we compared the results for the cell line replicate samples, and further, compared our results to previous typings. For 45 cancer cell lines, multiple RNA-Seq profiles were available, often from different laboratories. In all cases with sufficient HLA locus expression, the typings agree with the reported consensus HLA type, demonstrating the robustness of the method (Table S2). Further, when compared to previously determined HLA types, we find good agreement for HLA class I 4-digit typings. Partial HLA typing data exists for 17 cell lines (Table S1B) with 59 available 4-digit typed HLA Class I alleles, of which 56 typings overlap with the 91 4-digit typings determined by seq2HLA (). For 2 of the 3 missing calls, only the 2-digits could be determined and one allele wasn't called, all of which is due to very low expression (2 of the 3 missing 4-digit calls are associated with K-562 cells, which is known to not express HLA). Of the 56 overlapping 4-digit typings, 53 calls match. Only 3 HLA Class I alleles disagree, of which one wrong call affects the second B allele of DAUDI with 2244 supporting reads for the mismatched allele, one mismatch at SK-MEL-5 is due to a true homozygosity determination of an ambiguous HLA-C allele typing for which the matching 4-digit allele however is listed as possible solution with equal confidence score, and one wrong call is a consequence of a mistaken homozygosity prediction of the C locus of SK-MEL-5.
Table 2. Accuracy of 2- and 4-digit typings by seq2HLA from 17 published cell lines. Published HLA types exist for 17 cancer cell lines, comprising 102 possible HLA Class I and 102 possible HLA Class II alleles
Seq2HLA works by first determining the HLA groups, i.e., 2-digit resolution, as well as hetero- vs homozygosity, these calls are refined to assign the 4-digit HLA types (Supplementary Methods). In this first step, the C locus of SK-MEL-5 is determined as homozygous for C*03, as indicated by “hoz” ( in Supplementary Methods). However, this homozygosity prediction is also associated with a poor confidence score (0.78) indicating that this locus is likely not homozygous with C*07 being the second allele (as proposed next to the “hoz”-output), which matches the reported typings. Subsequently, the 4-digit prediction of this allele has also a poor confidence score, showing the importance of manually adjusting the typings according to the confidence scores, which has been done and documented for all the other cell lines in this study (Table S1). In addition, the first HLA-C allele shows an ambiguous typing, again the matching 4-digit type is listed as possible solution. Of the 17 cell lines, 85 HLA Class I alleles are available in at least 2-digit resolution (including the 59 4-digit alleles stated above), seq2HLA determined 101 alleles in at least 2-digit resolution and 84 alleles overlap, of which 79 2-digit typings match exactly (). One HLA allele could not be determined occurring again in K-562, due to a very low number of supporting mRNA-Seq reads. Five HLA class I 2-digit calls disagree, including 2 of the 3 false 4-digit typings mentioned above (Daudi, SK-MEL-5), a wrong 2-digit call at the 2nd B locus of K-562 and BT-549, both due to very low expression. For the latter, the overall expression of the B locus is low (2.7 RPKM) and only 8 supporting reads are left in the 2nd iteration to distinguish between the very similar HLA groups B*55 (truth) and B*56 (prediction). The last typing mismatch is a consequence of a wrong B locus homozygosity prediction in SK-MEL-5. However, the confidence score of the second allele, as well as of the 2-digit prediction, is 0.97 (Table S1A), indicating that this locus is likely not homozygous with B*07 being the second allele.
In the case of HLA Class II, 51 4-digit typings are available, of which 36 alleles overlap with 64 4-digit alleles determined by seq2HLA. For the 15 missing HLA Class II alleles no expression was detectable and so these could not be typed. Thirty of the 36 determinant 4-digit typings match. Three HLA Class II calls (JY, DAUDI) have ambiguous 4-digit typings from the RNA-Seq data, of which the matching 4-digit allele is listed as possible solution with equal or slightly less probability in all cases. Six HLA Class II calls disagree, with 3 wrong calls (A-549, MCF-7, MDA-MB-231) due to homozygosity predictions in which the first allele matches the reported typing but the second allele is missed. This might indicate the missed allele is not expressed, however expression of the whole loci is very low (0.003 – 3.2 RPKM). The remaining 3 wrong calls occur in DAUDI, despite high expression of the respective loci. Of the 17 cell lines, 59 HLA Class II alleles are available in at least 2-digit resolution, seq2HLA made 64 calls and 40 alleles overlap. Five HLA Class II calls disagree on the 2-digit level including the 3 false 4-digit typings mentioned above and one error at MCF-7 due to homozygosity prediction of DRB1*15, and thus a missed call of DRB1*03, with the whole locus showing very low expression (1.7 RPKM).
Counting the HLA alleles independently, the most prominent alleles in the examined cell lines are A*02:01 (65 of 321 determined 4-digit A-alleles), A*24:02 (48), C*04:01 (47 of 340 determined 4-digit C-alleles), C*07:01 (43), C*07:02 (37), and B*07:02 (32 of 327 determined 4-digit B-alleles) (Fig. S2). This HLA type frequency determined by seq2HLA mirrors the prevalence of those alleles throughout the human population.Citation13
HLA type for sample identification
HLA typing can be used as a sample barcode. Indeed, we used the HLA types to identify possible annotation discrepancies between related cell lines (Table S3). As positive examples, the breast cancer cell lines 21NT and 21PT (derived from the primary tumor) and 21MT1 and 21MT2 (derived from metastasis) are from the same patientCitation14: our results show the same HLA type for all samples. Similarly, the breast carcinoma cell line HCC-1937 and the matched lymphocyte cell line HCC-2337 show the same HLA type (Table S3a).
Strikingly, we determined different HLA Class I & II types of breast cancer cell line SUM149PT using the RNA-Seq reads from 2 different laboratories. Both replicates labeled as SUM149PT in SRA project SRP026537 resulted in HLA calls A*68:01, A*33:01, B*53:01, B*78:01, C*06:02, and C*16:01, whereas the RNA-Seq reads from samples labeled as SUM149 in SRA project SRP006908 and SUM149PT in SRA project SRP008746 resulted in calls A*03:01, B*35:01, B*51:01, C*12:03 (Table S3b). These unambiguous discrepancies suggest a possible sample annotation issue. Thus, the HLA type determined from seq2HLA and RNA-Seq reads acts as an effective QC sample barcode to identifying inconsistencies such as contamination and mislabeling.
HLA expression profiles
Our algorithm seq2HLA determines not only HLA type but also HLA Class I and II expression profiles ( Table S1). For the exemplar CAMA-1 cell line, the mean HLA-A, B and C expression levels are 61, 48, and 73 RPKM, respectively ().
Table 3. HLA expression profiles from 10 selected cancer cell lines. Locus-specific HLA Class I and HLA Class II expression profiles determined by seq2HLA in reads per kilobase of exon model per million mapped reads (RPKM). In case of replicate RNA-Seq samples, mean RPKM and standard deviation are indicated
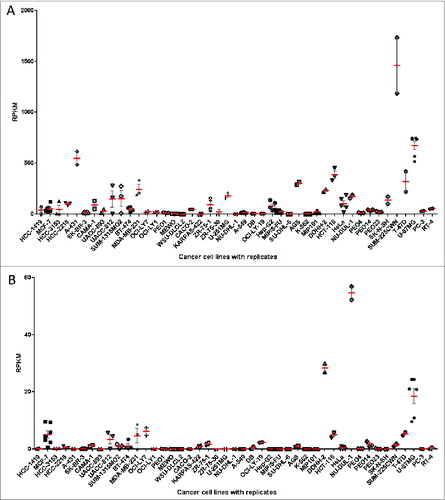
To determine the variability in determined HLA expression levels, we again examined the RNA-Seq reads from the same cell lines but from experiments run at the same and different laboratories. Given that the profiles come from cell lines that were cultured and profiled in different labs, we were pleased to find good agreement of HLA Class I () and HLA Class II () expression levels. The relative expression level variation is higher at low gene expression, reflecting increased proportion of noise expression, and decreases to less than 30% variability (difference to mean) at higher expression values.
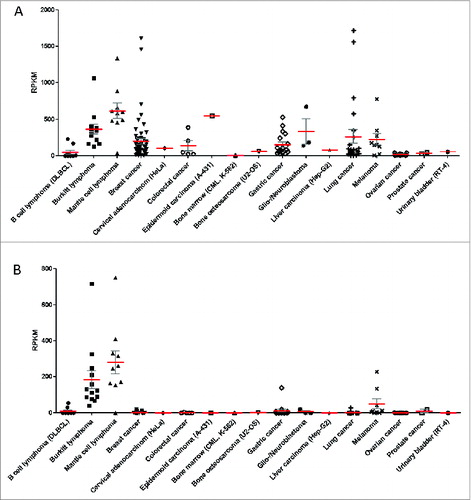
Figure 3. HLA expression profiles of 167 cancer cell lines grouped according to the tissue/disease of origin. The 167 cancer cell lines analyzed in the study are grouped according to their cancer type and each point represents the HLA expression level in one distinct cell line and in cases of replicate RNA-Seq datasets (for 45 cell lines), a point represents the mean expression value of the respective cell line. (red) and SEM (gray) is plotted for HLA Class I (A) and HLA Class II (B). HLA Class I expression is defined as the sum of individual reads for each HLA-A, HLA-B and HLA-C and HLA Class II expression is defined as the sum of individual reads for HLA-DQA1, HLA-DQB1, HLA-DRB1.RPKM, reads per kilobase of exon model per million mapped reads.
In general, we observed moderate to high HLA Class I expression throughout the different tissues/disease-groups (). Ovarian and prostate cancer cell lines and K-562 show no or very low levels. HLA Class II is absent in almost all tissue/disease groups, with the exceptions of Burkitt lymphoma, mantle cell lymphoma and melanoma cell lines (). Of the 167 cancer cell lines, 39 (23%) showed no or very weak expression (less than 1 RPKM) for at least one HLA Class I and 136 (82%) showed no or very weak expression for at least one HLA Class II locus.
Figure 2. HLA expression levels of replicate cell line RNA-Seq samples. For 45 cancer cell lines, multiple RNA-Seq datasets were available, often from different laboratories. Each point represents HLA expression of one RNA-Seq sample, retrieved from public databases. There is an overall good agreement of HLA Class I (A) and HLA Class II (B) expression levels between those replicate samples. HLA Class I expression is defined as sum of individual reads for each HLA-A,HLA-B and HLA-C and HLA Class II expression is defined as the sum of individual reads for HLA-DQA1, HLA-DQB1, HLA-DRB1. The mean (red) and SEM (gray) are plotted for each cell line with replicate RNA-Seq reads for HLA Class I (A) and HLA Class II (B).
HLA expression in different tissue and disease groups
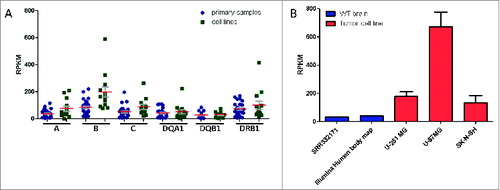
Among B cell lines, we found high HLA Class I (360 RPKM) and HLA Class II expression (205 RPKM) in the normal B cell lymphoblastoid cell line, which is in accordance with our previous findings that normal B lymphocytes express a relatively high level of HLA Class I and II molecules.Citation15 This is not surprising, and in fact should be expected given their role as antigen presenting cells. However, we observed low HLA expression in the diffuse large B-cell lymphoma (DLBCL) (including one Non-Hodgkin lymphoma) cell lines studied here (): 8 of the ten cell line samples showed no a very weak expression of HLA Class I and II molecules. In contrast, Burkitt lymphoma and mantle cell lymphoma cell lines display a normal B lymphocyte phenotype with high HLA Class I (greater than 120 RPKM) and Class II expression (greater than 38 RPKM), correlating to HLA expression levels in primary Burkitt lymphoma samples ().
Figure 4. Comparison of HLA expression profiles of cancer cell lines versus primary samples. (A) Analyses from seq2HLA of 13 Burkitt lymphoma cell lines (green) and 28 primary samples (blue) showing comparable HLA Class I and Class II locus specific expression profiles (SRA: SRP009316). Shown are the means (red) and SEM (gray). (B) The glioblastoma cell lines U-251 MG (2 samples), U-87MG (5 replicates) and the neuroblastoma cell line SK-N-SH (2 replicates) - shown in red – HLA Class I expression levels (red; the sum of HLA-A,HLA-B and HLA-C expression) compared to wild-type primary brain samples (blue; SRA:SRR332171 and Illumina body map project with SRA ID ERR030882, one replicate each).
In the case of breast cancer, the majority of the 56 examined breast cancer cell lines showed HLA Class I and II expression levels comparable to the 6 normal breast cell lines. Indeed, 2 of the highest HLA Class I expressions were found in breast cancer cell lines HCC-70 (1614 RPKM) and SUM-225CWN (1460 RPKM) which express HLA Class II very weakly (SUM-225CWN; less than 1.4 RPKM) or not at all (HCC-70; 0 RPKM). In general, HLA II expression was observed to be low, even in normal breast lines (less than 19 RPKM). Confirming the findings here, Teh et al.Citation16 studied HLA mRNA expression in human breast carcinoma cell lines using HLA-A and HLA-B locus specific DNA probes and Northern Blot. Five cell lines overlap with this study and the bands of the autoradiogram correspond well with the HLA expression profiles and levels determined here (Fig. S3).
Lung cancer cell lines display a heterogeneous HLA expression landscape, with 9 of the 24 cell lines expressing less than 1 RPKM for at least one HLA I locus and high overall HLA I expression in 8 cell lines (greater or equal than 100 RPKM). Furthermore, 2 of the highest HLA I expressions were found in lung cancer cell lines: DMS 53 (1718 RPKM) and NCI-H196 (1563 RPKM). In contrast, HLA Class II expression was not detectable in 11 cell lines (0 RPKM) and expression (greater than 1 RPKM) was found in only 5 samples.
Among melanoma cell lines, there was an overall high expression of HLA Class I (greater than 125 RPKM), although MEWO (less than 2 RPKM) and Mel501 (22 RPKM) exhibit low and moderate expression, respectively. Of the non-B cell cancer cell lines, the melanoma samples showed the highest HLA Class II expression (mean: 48 RPKM), with Mel501 and MEWO again the exceptions, with no detectable HLA Class II expression. Overall HLA expression levels in melanoma lines are much higher than the normal epidermal keratinocytes cell line NHEK (Class I: 45 RPKM, Class II: 2 RPKM).
We had previously analyzed HLA expression in a non-cancerous brain samples as part of the Illumina Body Map project.Citation15 We have additionally analyzed an independent normal human brain sample (SRA: SRR332171) and in both cases found lower HLA Class I expression (40 and 31 RPKM). Surprisingly, both glioblastoma cell lines (U-87MG and U-251 MG) and the neuroblastoma cell line (SK-N-SH) show a high mean HLA Class I expression with more than 135 RPKM (), suggesting HLA Class I upregulation in those samples.
In contrast, tumor cells downregulate or even lose HLA expression as a tumor escape mechanism,Citation17,18 and the chronic myelogenous leukemia cell line K-562 is a prominent example of this cancer cell adaptation.Citation19 Using seq2HLA, we confirm extremely low HLA expression in 6 K-562 RNA-Seq samples (Table S1). HLA-C is expressed at very low but non-zero HLA-C expression in all 6 K-562 samples, enabling us to determine the K562 HLA-C type as HLA-C*05 () and corroborating reports of the constitutive expression of HLA-C on K-562 cells.Citation20
Interestingly, we also find examples of massive imbalance of locus-specific HLA Class I expression throughout all malignant disease tissue types (Fig. S4). For example, in all 3 RNA-Seq samples from the breast cancer cell line HCC2218 display very low expression of HLA-A (less than 1 RPKM) and HLA-B alleles (less than 4 RPKM) concurrent with massive expression of HLA-C alleles (79-105 RPKM). Vice versa, the gastric adenocarcinoma cell line AGS shows high expression of HLA-A and HLA-B alleles (134 – 158 RPKM) and low expression of HLA-C alleles (5 RPKM). Previous studiesCitation21 showed a reduced HLA-B expression as compared to HLA-A alleles in small cell lung cancer cell lines. We confirm this finding, as all 24 lung cancer cell lines display lower HLA-B than HLA-A expression (Supplementary Fig. S4), with 9 cell lines having HLA-B loci expression less than 1 RPKM in contrast to the respective A locus that is expressed more abundantly (2 -69 RPKM). Similarly, melanoma cell lines express higher levels of HLA-A in contrast to HLA-B and HLA-C.Citation22 We observed such imbalanced HLA profiles in 7 out 9 melanoma samples.
Catalog of neo-epitope candidates
Integrating the determined HLA types, the point mutations and HLA binding prediction tools, we generated a catalog of predicted antigenic mutation candidates for each individual cell line ( Table S4). The cell-line specific catalog of mutations is predicted to bind to at least one HLA allele in the respective cell lines. For example, in CAMA-1, there are 190 non-synonymous point mutations, of which 84 (44%) are predicted to be presented on a CAMA-1 HLA alleles ( Fig.S5).
Of the 167 cancer cell lines examined in this study, COSMIC lists 39,414 non-synonymous SNVs (nsSNVs) in 83 cell lines and CCLE lists 3,745 nsSNVs in 100 cell lines, for a total of 40,813 nsSNVs and with 2,346 entries overlapping between the 2 sources. We predicted HLA binding of mutation-containing peptides in the 107 cell lines for which at least one HLA Class I allele could be determined at 4-digit resolution (Table S3a). Using a HLA binding affinity cut-off of 500 nM, 18,102 (44%) nsSNVs were predicted to produce neo-epitopes likely to be presented and are thus good neo-epitope candidates (Table S3b).
The cell line with the largest number of reported nsSNVs is the melanoma cell line MEWO, comprising 4,508 nsSNVs, of which 1,335 (30%) nsSNVs are predicted to be strong MHC binders. However, predictions could only be performed for the 2 HLA-A alleles as the expression of the HLA-B and HLA-C locus was too low to determine the B and C types. Thus, the number of likely antigenic mutation candidates can be assumed to be higher. The cell lines with the largest ratio between total number of nsSNVs and mutations producing neo-epitopes with predicted binding capacity less or equal than 500 nM are HeLa (251 of 292, 86%), UACC-812 (249 of 319, 78%) and HCC-202 (312 of 400, 78%). The cell lines with the smallest ratio are MKN-28 (13 of 465, 2.8%) and SNU-1 (1 of 123, 0.8%), of which predictions for only one HLA-allele could be performed as the IEDB consensus tool does not offer prediction models for the remaining HLA alleles. Thus, the number of candidate epitopes might be higher.
One way to look at the antigenic neo-epitope candidates is to compare the predicted binding affinity of the mutated neo-epitope versus the corresponding wild-type peptide. Of the 18,102 predicted antigenic neo-epitope peptides (IC50 less or equal than 500 nM), 4,673 peptides have a corresponding wild-type peptide predicted to not bind (IC50 greater than 500 nM). Note that we have calculated the binding of the wild-type peptide corresponding to the strongest binding mutated peptide (Fig. S6), not the mutated peptide with the maximum binding difference between mutated and wild-type peptides. As expected, the peptides for which there is the greatest difference in binding (mutated versus wild-type peptide) contain mutations leading to amino acids substitutions in anchor positions according to the SYFPEITHI Motif databaseCitation23 and MHCcluster.Citation24 For example, the large binding differences for HLA-B*57:01 occur for tryptophan substitutions at the C-terminal residue (Fig. S7).
Further, the same mutation can produce a different neo-epitope sequence in individuals with different HLA types. For example, the re-occurring BRAF V600E is predicted to result in 2 different neo-epitopes, with KIGDFGLATEK binding to HLA-A*11:01 in the melanoma cell line SK-MEL-28 and LATEKSRW binding to HLA-B*57:01 with high affinity in the melanoma cell line A-375 ().
Table 4. Neo-epitope candidate catalog. Shown are example database (source) entries indicating non-synonymous point mutations in known cancer-related genes producing neo-epitopes predicted to bind the respective HLA allele with high affinity (IC50 less or equal than 500 nM) and one example with the greatest in binding (predicted IC50 value of mutated vs wild-type peptide, denoted as Δ)
Finally, the “Database of T cell-defined human tumor antigens”Citation25 provides a manually curated catalog of tumor antigens resulting from mutations recognized by T cells. The TP53 missense mutation Y220C produces an immunogenic neo-epitope (VVPCEPPEV) in HLA-A*02:01 positive squamous cell carcinomas of the head and neck.Citation26 This mutation is also present in the breast cancer cell line HCC-1419 (Cosmic and CCLE) and we predict the same mutation-producing peptide to bind to HLA-A*02:01 with high affinity (399.95 nM; Table S3).
Discussion and Conclusion
Despite the broad use of cancer cell lines, their immunological characterization has been lacking. HLA typing, in particular, has been left incomplete and what little characterization has been done is broadly distributed in the literature. Similarly, the expression of HLAs is largely unknown, and the identity of immunogenic cancer mutations in cancer cell lines remains obscure. Here, we used publicly available RNA-Seq data and an optimized version of our algorithm seq2HLACitation15 to determine the 4-digit HLA Class I and II types of 167 cancer and 10 non-cancer cell lines. HLA typing has obvious application in regards to any immunological-related scientific processes, encompassing basic research to cohort disease studies and clinical studies. Knowing the various HLA types for such cancer models allows the selection of cell lines for use in biochemical assays, for example, if one needs a cell line expressing a particular HLA subtype (e.g., HLA-A*02:01 or HLA-B*51:01) at high levels to determine the HLA ligandome (i.e., the HLA ligand repertoire) via mass spectrometry. Thus, by itself, this catalog is a useful resource enabling researchers to select cell lines for experiments based on HLA type and their expression.
Further, current estimates are that 18% to 36% of all active cell lines are either cross-contaminated or misidentified,Citation27 such that mislabeled and ‘sans papiers’ cell lines (i.e. cell lines without a valid identity check) are not uncommon.Citation28 This is a serious issue for conclusions drawn from experiments with cell lines. HLA typing using the catalog presented here is one solution for cell line identity checking and tracking. Here, we show that different cell lines derived from the same donor express the same HLA types. We identified a complete HLA mismatch of the same cancer cell line used in different projects, suggesting an annotation swap. In addition, cancer studies typically compare the transcriptomes of tumor and normal samples from the same individual, and such isogenic samples should have the same HLA type. Seq2HLA provides a fast and easy quality control method to validate annotation.
We determined HLA Class I and II expression profiles for various cancer cell lines. Whereas the Burkitt and mantle cell lymphoma derived lines maintain the B-cell phenotype with respect to high HLA Class I and II expression, the DLBCL cell lines show a massive downregulation of both classes. Relative to the wild-type brain, both glioblastoma and neuroblastoma cell lines displayed higher HLA Class I expression. On the other hand, the ovarian and prostate cancer cell lines showed either no, or very low, HLA Class I and II expression contrasting with melanoma cell lines exhibiting high expression of both HLA Class I and II. The lung cancer cell lines were found to be heterogeneous, with HLA Class I expression ranging from very high (greater than 1500 RPKM) to very low (less than 5 RPKM). Furthermore, we found an imbalance of locus-specific HLA Class I expression throughout all diseased tissue types.
Most cancer genome sequencing studies, including either those encompassing cancer cell lines or primary tumor material, focus on the identification and classification of driver mutations.Citation29 The goal of these endeavors is to unravel the underlying genetics of tumorigenesisCitation30 and to propose new therapies targeting such drivers.Citation31 However, a mutation that is not a driver can nevertheless be immunogenic and useful for immunotherapies. Analogous to the mutational landscape, we define here the predicted neo-epitope landscape of a wide variety of cancer cell lines using the HLA types and mutations in each specific cell line. Neo-epitopes generated from mutations have been previously shown by us and others to be good targets for cancer immunotherapy, including cancer vaccines targeting mutational epitopes or in the context of adoptively transferred tumor-reactive T cells.Citation32 Recurrent immunogenic somatic mutations have been identified and proposed for use in prophylactic cancer vaccination regimens.Citation9 Indeed, we predict that recurrent somatic mutations are presented in specific cell lines, such as BRAF V600E on HLA-B*57:01 in A-375 cells and KRAS G12D on HLA-C*03:03 in AGS cells. This catalog contains neo-epitopes that are predicted to bind to a respective HLA allele using “reverse immunology” and this invaluable resource could be used to prioritize candidates for further immunogenicity testing.Citation33,34 Computational prediction and prioritization of antigenic and immunologic mutation-containing peptides is rapidly evolving as we better understand HLA binding (e.g, IC50 or percentile ranks), pMHC stability and T cell receptor (TCR) recognition parameters; nevertheless previous work suggests roughly one third of these mutations are indeed immunogenic.Citation11,35
There are ongoing discussions about the translation of findings in cancer cell lines into the human cancers.Citation1 We find that the HLA types of the cancer cell lines examined in this study are representative for the human population, such that the most frequent alleles (HLA-A*02:01, A*24:01, C*07:01, C*07:02) match those with high prevalence in human populations. Furthermore, the pattern of HLA Class I expression in many of the cell lines correlates with that of the corresponding primary cancers. For example, the examined Burkitt lymphoma cell lines correlate with those of primary Burkitt lymphomas. On the other hand, the brain cancer cell lines evaluated mysteriously display elevated HLA Class I expression in contrast to the normal brain samples analyzed here.
In conclusion, this study provides a catalog of HLA types and HLA expression levels of widely used cancer and normal cell lines. It further identifies predicted cell line specific high-affinity binding neo-epitopes. We demonstrate an integrative bioinformatics approach to integrate publicly-available genomic data with existing software tools to predict cell line specific high-affinity binding neo-epitopes. This knowledge enables easier development of the tools for immunological studies using cell lines, for developing tools to develop cancer immunotherapies, and for the development of cancer immunotherapy drug structures.
Materials and Methods
RNA-seq data
Paired-end RNA-Seq sequence reads for 177 cell line samples sequenced with the Illumina platform were downloaded from the NCBI Sequence Read Archive (SRA), ENCODECitation36 and GenentechCitation37 (Tables S1 and S2). In addition, we analyzed 2 normal human brain samples, (SRA: SRR332171, ERR030882 [Illumina human body map]), as well as 28 human primary Burkitt lymphoma samples (SRA: SRP009316).
Cell line naming
There exist different annotations of the same cell line, e.g. “K-562” and “K562” or “MCF-7”, “MCF 7” or “MCF7”, which makes automated data search, data retrieval, combination of different data sources and analysis tedious. There is an obvious need for controlled vocabulary to have a standardized nomenclature for cell line names and there have been attempts to address this, e.g. BRENDA.Citation38 Unfortunately, resources are not comprehensive with cell lines missing or they provide different names for the same cell line. We therefore decided to apply the following designation strategy: i) use the cell line names in BRENDA whenever possible; ii) apply the rules from BRENDA to similar cell lines that are not in BRENDA (e.g., HCC-1954 is in BRENDA, HCC-1806 is not, but we follow the same rule); iii) use the names given by the authors who established the cell lines (if the original publication is available/accessible); or iv) use the listed named by the cell line distributor (Table S1).
HLA-types
For 17 cell lines in this study, partial or complete 2-digit or 4-digit HLA type information is available from Adams et al.,Citation39 the IMGT/HLA Cell Database at the European Bioinformatics Institute (EBI)Citation40 and the HLA Typed Collection.Citation41
Four-digit HLA typing from RNA-seq
The tool seq2HLACitation15 was used to derive cell line HLA Class I & II types from the RNA-Seq data. Seq2HLA previously determined 2-digit resolution HLA types with high accuracy. We extended seq2HLA to automatically assign the 4-digit HLA types by first determining the HLA group (2-digit resolution) as well as hetero- vs homozygosity and in a second step refining the typings by taking into consideration the number of reads assigned to any allele within the determined group. After filtering out not significant alleles based on read counts and confidence score and not probable alleles based on the dbMHC table, the most likely 4-digit allele is reported. If more than one solution is likely, an ambiguity flag is assigned to the reported allele and alternative alleles are reported in a separate file. Ambiguous alleles are defined as being in the 95th percentile based on the RNA-Seq read count distribution (Supplementary Methods).
In some cases, ambiguous typings were adjusted manually based on population specific HLA frequencies,Citation13,42 if the origin of the donor of the cell line is reported or pan-population HLA frequencies otherwise. In case of replicate samples, the consensus of the calls is reported (Table S2). No call was made in the case that a locus was not expressed. This occurred in 13 cell lines for a Class I locus and in 123 cell lines for at least one Class II locus.
Expression values are reported as reads per kilobase of exon per million mapped reads (RPKM).Citation43 The new version of seq2HLA (v2.2) is available as stand-alone module from http://tron-mainz.de/tron-facilities/computational-medicine/seq2HLA/.
Mutations
Cell line mutation information was downloaded from the Broad-Novartis Cancer Cell Line Encyclopedia (CCLE)Citation4 and from the COSMIC Cell Lines Project.Citation3 CCLE provides a list of mutations across CCLE cell lines determined by targeted hybrid capture sequencing. Variations found in the 1000 Genomes SNP database were excluded. COSMIC v67 comprises likely somatic coding mutations of 1015 cell lines from exome sequencing. SNVs entries were discarded for which the wild-type amino acid at the mutation positions did not match that found in the respective reference sequence according to the associated protein identifier (Ensembl, RefSeq or Uniprot). Mutation and RNA-Seq data are both available for 108 cancer cell lines (Table S3).
MHC binding predictions
The IEDB MHC binding prediction algorithm v2.9, “consensus” methodCitation6,44,Citation45 was used to predict MHC-binding, mutation-containing epitopes. The cell-line specific HLA type and the cell-line specific mutations were input to the IEDB software. For each cell line and each mutation, we calculated and recorded: i) the best neo-epitope sequence (i.e., the peptide containing the amino acid substitution), ii) the respective HLA allele, iii) the predicted binding score (IC50 and consensus rank) of the neo-epitope and HLA allele, and iv) the predicted binding score (IC50 and consensus rank) of the associated wild-type peptide. The best neo-epitope for a mutation was calculated as follows: all possible 8-, 9-, 10-, 11-mer peptides containing the mutated amino acids were input to the IEDB algorithm, which predicts the binding affinity (IC50 in nM and the consensus percentile rank) of the peptide to the cell line HLA alleles. The best neo-epitope-HLA pair is defined as the peptide which has the lowest (best) predicted binding affinity to the respective HLA allele (Fig. S6). All neo-epitopes with a predicted binding affinity (IC50 value) of less or equal than 500 nM were reported as likely antigenic candidates.Citation34,46 Of note, a recent study indicates, that absolute binding affinity is preferable over percentile rank and that 500 nM is a good “universal” threshold.Citation47 However, these investigators also propose, that distinct HLA-A and HLA-B alleles have different affinity thresholds and subsequent unique peptide-binding repertoires.
Computational workflow
For each cell line, we applied the seq2HLA algorithm to the NGS RNA-Seq reads (), determining HLA type and expression (). Next, the cell-line specific HLA types and cell-line specific non-synonymous somatic mutations were processed with the IEDB HLA presentation algorithm to predict HLA-presented (antigenic) mutations (). The list of predicted HLA-binding mutation epitopes is output ( Fig. S6).
Disclosure of Potential Conflicts of Interest
No potential conflicts of interest were disclosed.
Supplemental Material
Supplemental data for this article can be accessed on the publisher's website.
954893_Supplementary_Materials.zip
Download Zip (6.3 MB)954893_Supplementary_Materials.zip
Download Zip (6.3 MB)Acknowledgments
We thank Barbara Kasemann for cell line help; Michael Schäfer for HLA scientific advice; Ludmila Schemarow, Marius Byl, Jelle Scholtalbers, Thorsten Litzenberger, André Brinkman, Tim Süß and Markus Tacke for the computational infrastructure.
Funding
Funding was provided in part by grant 0316179A from the German BMBF.
References
- Gillet, J.-P. Varma, S, Gottesman, MM. The clinical relevance of cancer cell lines. J Natl Cancer Inst 2013; 105:452-8; PMID:23434901; http://dx.doi.org/10.1093/jnci/djt007
- Sharma SV Haber DA, Settleman J. Cell line-based platforms to evaluate the therapeutic efficacy of candidate anticancer agents. Nat Rev Cancer 2010; 10:241-53; PMID:20300105; http://dx.doi.org/10.1038/nrc2820
- Forbes SA, Bindal N, Bamford S, Cole C, Kok CY, Beare D, Jia M, Shepherd R, Leung K, Menzies A, et al. COSMIC: mining complete cancer genomes in the Catalogue of Somatic Mutations in Cancer. Nucleic Acids Res 2011; 39:D945-50; PMID:20952405; http://dx.doi.org/10.1093/nar/gkq929
- Barretina, J, Caponigro G, Stransky N, Venkatesan K, Margolin AA, Kim S, Wilson CJ, Lehár J, Kryukov GV, Sonkin D, et al. The Cancer Cell Line Encyclopedia enables predictive modelling of anticancer drug sensitivity. Nature 2012; 483:603-7; PMID:22460905; http://dx.doi.org/10.1038/nature11003
- Castle JC, Loewer M, Boegel S, de Graaf J, Bender C, Tadmor AD, Boisguerin V, Bukur T, Sorn P, Paret C, et al. Immunomic, genomic and transcriptomic characterization of CT26 colorectal carcinoma. BMC Genomics 2014; 15:190; PMID:24621249; http://dx.doi.org/10.1186/1471-2164-15-190
- Kim Y. Sette A, Peters B. Applications for T-cell epitope queries and tools in the immune epitope database and analysis resource, J Immunol Methods 2011; 374:62-9; PMID:21047510; http://dx.doi.org/10.1016/j.jim.2010.10.010
- Dutoit V. Herold-Mende C, Hilf N, Schoor O, Beckhove P, Bucher J, Dorsch K, Flohr S, Fritsche J. Exploiting the glioblastoma peptidome to discover novel tumour-associated antigens for immunotherapy. Brain 2012; 135:1042-54; PMID:22418738; http://dx.doi.org/10.1093/brain/aws042
- Khalili JS, Hanson RW, Szallasi Z. In silico prediction of tumor antigens derived from functional missense mutations of the cancer gene census. Oncoimmunology 2012; 1:1281-9; PMID:23243591; http://dx.doi.org/10.4161/onci.21511
- Warren RL, Holt RA. A census of predicted mutational epitopes suitable for immunologic cancer control. Hum Immunol 2010; 71:245-54; PMID:20035814; http://dx.doi.org/10.1016/j.humimm.2009.12.007
- Segal, N. H. Parsons DW, Peggs KS, Velculescu V, Kinzler KW, Vogelstein B, Allison JP. Epitope landscape in breast and colorectal cancer. Cancer Res 2008; 68:889-92; PMID:18245491; http://dx.doi.org/10.1158/0008-5472.CAN-07-3095
- Castle JC, Kreiter S, Diekmann J, Löwer M, van de Roemer N, de Graaf J, Selmi A, Diken M, Boegel S, Paret C, et al. Exploiting the mutanome for tumor vaccination. Cancer Res 2012; 72:1081-91; PMID:22237626; http://dx.doi.org/10.1158/0008-5472.CAN-11-3722
- Rammensee H-G, Singh-Jasuja H. HLA ligandome tumor antigen discovery for personalized vaccine approach. Expert Rev Vaccines 2013; 12:1211-17; PMID:24090147; http://dx.doi.org/10.1586/14760584.2013.836911
- Helmberg W, Dunivin R, Feolo M. The reagent database at dbMHC. Tissue Antigens 2004; 63:142-8; PMID:14705985; http://dx.doi.org/10.1111/j.1399-0039.2004.00163.x
- Band V. Zajchowski D, Swisshelm K, Trask D, Kulesa V, Cohen C, Connolly J, Sager R. Tumor progression in four mammary epithelial cell lines derived from the same patient. Cancer Res 1990; 50:7351-7; PMID:1977518
- Boegel S. Löwer M, Schäfer M, Bukur T, de Graaf J, Boisguérin V, Türeci O, Diken M, Castle JC, Sahin U. HLA typing from RNA-Seq sequence reads. Genome Med 2013; 4:102; http://dx.doi.org/10.1186/gm403
- Teh M, Hui KM. Modulation of MHC gene expression in human breast carcinoma cells by hormones. J Immunogenet 1989; 16:397-405 ; PMID:2639911; http://dx.doi.org/10.1111/j.1744-313X.1989.tb00487.x
- Algarra I García-Lora A, Cabrera T, Ruiz-Cabello F, Garrido F. The selection of tumor variants with altered expression of classical and nonclassical MHC class I molecules: implications for tumor immune escape. Cancer Immunol Immunother 2004; 53:904-10; PMID:15069585; http://dx.doi.org/10.1007/s00262-004-0517-9
- Atkins D, Ferrone S, Schmahl GE, Störkel, S, Seliger B. Down-regulation of HLA class I antigen processing molecules: an immune escape mechanism of renal cell carcinoma? J Urol 2004; 171:885-9; PMID:14713847; http://dx.doi.org/10.1097/01.ju.0000094807.95420.fe
- Britten CM, Meyer RG, Kreer T, Drexler I, Wölfel T, Herr W. The use of HLA-A*0201-transfected K562 as standard antigen-presenting cells for CD8(+) T lymphocytes in IFN-gamma ELISPOT assays. J Immunol Methods 2002; 259:95-110; PMID:11730845; http://dx.doi.org/10.1016/S0022-1759(01)00499-9
- Le Bouteiller P, Barakonyi A, Giustiniani J, Lenfant F, Marie-Cardine A, Aguerre-Girr M, Rabot M, Hilgert I, Mami-Chouaib F, Tabiasco J, et al. Engagement of CD160 receptor by HLA-C is a triggering mechanism used by circulating natural killer (NK) cells to mediate cytotoxicity. Proc Natl Acad Sci U S A 2002; 99:16963-68; PMID:12486241; http://dx.doi.org/10.1073/pnas.012681099
- Ruiz-Cabello, F. et al. Molecular analysis of MHC-class-I alterations in human tumor cell lines. Int J Cancer Suppl 1991; 6:123-130; PMID:1906050; http://dx.doi.org/10.1002/ijc.2910470723
- Marincola FM, Shamamian P, Simonis TB, Abati A, Hackett J, O'Dea T, Fetsch P, Yannelli J, Restifo NP, Mulé JJ. Locus-specific analysis of human leukocyte antigen class I expression in melanoma cell lines. J Immunother Emphasis Tumor Immunol 1994; 16:13-23; PMID:8081556; http://dx.doi.org/10.1097/00002371-199407000-00002
- Schuler MM, Nastke M-D, Stevanovikć S. SYFPEITHI: database for searching and T-cell epitope prediction. Methods Mol Biol 2007; 409:75-93; PMID:18449993; http://dx.doi.org/10.1007/978-1-60327-118-9_5
- Thomsen M, Lundegaard C, Buus S, Lund O, Nielsen M. MHCcluster, a method for functional clustering of MHC molecules. Immunogenetics 2013; 65:655-65; PMID:23775223; http://dx.doi.org/10.1007/s00251-013-0714-9
- Vigneron, N. Stroobant, V. Van den Eynde, Benoît J, van der Bruggen, Pierre. Database of T cell-defined human tumor antigens: the 2013 update. Cancer Immun 2013; 13:15; PMID:23882160
- Ito D, Visus C, Hoffmann TK, Balz V, Bier H, Appella E, Whiteside TL, Ferris RL, DeLeo AB. Immunological characterization of missense mutations occurring within cytotoxic T cell-defined p53 epitopes in HLA-A*0201+ squamous cell carcinomas of the head and neck. Int J Cancer 2007; 120:2618-24; PMID:17294448; http://dx.doi.org/10.1002/ijc.22584
- Hughes P Marshall D, Reid Y, Parkes, H, Gelber C. The costs of using unauthenticated, over-passaged cell lines: how much more data do we need?. BioTechniques 2007; 43:575, 577-8, 581-2 passim; http://dx.doi.org/10.2144/000112598
- Giacomini P, Giorda E, Pera C, Ferrara GB. An ID card for tumour cell lines: HLA typing can help. Lancet Oncol 2001; 2:658 ; PMID:11902535; http://dx.doi.org/10.1016/S1470-2045(01)00554-X
- Greenman C, Stephens P, Smith R, Dalgliesh GL, Hunter C, Bignell G, Davies H, Teague J, Butler A, Stevens C, et al. Patterns of somatic mutation in human cancer genomes. Nature 2007; 446:153-158; PMID:17344846; http://dx.doi.org/10.1038/nature05610
- Reva B. Revealing selection in cancer using the predicted functional impact of cancer mutations. Application to nomination of cancer drivers. BMC Genomics 2013; 14:Suppl 3:S8; PMID:23819556; http://dx.doi.org/10.1186/1471-2164-14-S3-S8
- Stratton MR Exploring the genomes of cancer cells: progress and promise. Science 2011; 331:1553-8; PMID:21436442; http://dx.doi.org/10.1126/science.1204040
- Robbins PF, Lu YC, El-Gamil M, Li YF, Gross C, Gartner J, Lin JC, Teer JK, Cliften P, Tycksen E, et al. Mining exomic sequencing data to identify mutated antigens recognized by adoptively transferred tumor-reactive T cells. Nat Med 2013; 19:747-52; PMID:23644516; http://dx.doi.org/10.1038/nm.3161
- Matsushita, H, Vesely MD, Koboldt DC, Rickert CG, Uppaluri R, Magrini VJ, Arthur CD, White JM, Chen YS, et al. Cancer exome analysis reveals a T-cell-dependent mechanism of cancer immunoediting. Nature 2012; 482:400-4; PMID:22318521; http://dx.doi.org/10.1038/nature10755
- Fritsch EF, Rajasagi M, Ott PA, Brusic V, Hacohen N, Wu CJ. HLA-binding properties of tumor neoepitopes in humans. Cancer Immunol Res 2014; 2(6):522-9; PMID:24894089; http://dx.doi.org/10.1158/2326-6066.CIR-13-0227
- Kreiter S, Castle JC, Türeci Ö, Sahin U. Targeting the tumor mutanome for personalized vaccination therapy. Oncoimmunology 2012; 1:768-9; PMID:22934277; http://dx.doi.org/10.4161/onci.19727
- A user's guide to the encyclopedia of DNA elements (ENCODE). PLoS Biol 2011; 9:e1001046; PMID:21526222; http://dx.doi.org/10.1371/journal.pbio.1001046.
- Rudin CM, Durinck S, Stawiski EW, Poirier JT, Modrusan Z, Shames DS, Bergbower EA, Guan Y, Shin J, Guillory J. Comprehensive genomic analysis identifies SOX2 as a frequently amplified gene in small-cell lung cancer. Nat Genet 2012; 44:1111-6; PMID:22941189; http://dx.doi.org/10.1038/ng.2405
- Schomburg I, Chang A, Placzek S, Söhngen C, Rother M, Lang M, Munaretto C, Ulas S, Stelzer M, Grote A, et al. BRENDA in 2013: integrated reactions, kinetic data, enzyme function data, improved disease classification: new options and contents in BRENDA. Nucleic Acids Res 2013; 41:D764-72; PMID:23203881; http://dx.doi.org/10.1093/nar/gks1049
- Adams S, Robbins FM, Chen D, Wagage D, Holbeck SL, Morse HC 3rd, Stroncek D, Marincola FM. HLA class I and II genotype of the NCI-60 cell lines. J Transl Med 2005; 3:11; PMID:15748285; http://dx.doi.org/10.1186/1479-5876-3-11
- Robinson, J. Halliwell JA, McWilliam H, Lopez R, Parham P, Marsh SG. The IMGT/HLA database. Nucleic Acids Res 2013; 41:D1222-7; PMID:23080122; http://dx.doi.org/10.1093/nar/gks949
- Public Health England. HLA-Typed Collection. Available at http://www.phe-culturecollections.org.uk/products/celllines/hlatyped/browse.jsp (last access: 21.02.2014)
- Paunić V, Gragert L, Madbouly A, Freeman J, Maiers M. Measuring ambiguity in HLA typing methods. PLoS ONE 2012; 7:e43585; PMID:22952712; http://dx.doi.org/10.1371/journal.pone.0043585
- Mortazavi A, Williams BA, McCue K, Schaeffer, L, Wold B. Mapping and quantifying mammalian transcriptomes by RNA-Seq, Nat Methods 2008; 5:621-8; PMID:18516045; http://dx.doi.org/10.1038/nmeth.1226
- Lundegaard C. Lamberth K, Harndahl M, Buus S, Lund O, Nielsen M. NetMHC-3.0: accurate web accessible predictions of human, mouse and monkey MHC class I affinities for peptides of length 8-11. Nucleic Acids Res 2008; 36:W509-12; PMID:18463140; http://dx.doi.org/10.1093/nar/gkn202
- Peters B, Sette A. Generating quantitative models describing the sequence specificity of biological processes with the stabilized matrix method. BMC Bioinformatics 2005; 6:132; PMID:15927070; http://dx.doi.org/10.1186/1471-2105-6-132
- Sette A, Vitiello A, Reherman B, Fowler P, Nayersina R, Kast WM, Melief CJ, Oseroff C, Yuan L, Ruppert J, et al. The relationship between class I binding affinity and immunogenicity of potential cytotoxic T cell epitopes. J Immunol 1994; 153:5586-92; PMID:7527444
- Paul S. Weiskopf D, Angelo MA, Sidney J, Peters B, Sette A. HLA class I alleles are associated with peptide-binding repertoires of different size, affinity, and immunogenicity. J Immunol 2013; 191:5831-9; PMID:24190657; http://dx.doi.org/10.4049/jimmunol.1302101