
Abstract
An increased level of interleukin-6 (IL-6) in epithelial ovarian cancer (EOC) is correlated with a worse prognosis. IL-6 stimulates tumor-growth and inflammation. We investigated the intricate interaction between the IL-6 signaling pathway and tumor-infiltrating myeloid cells (TIMs) to determine their prognostic impact in EOC. 160 EOC samples were analyzed for the expression of IL-6, its receptor (IL-6R) and downstream signaling via pSTAT3 by immunohistochemistry. Triple color immunofluorescence confocal microscopy was used to identify myeloid cell populations by CD14, CD33, and CD163. The relationship between these markers, tumor-infiltrating immune cells, clinical-pathological characteristics and survival was investigated. EOC displayed a dense infiltration with myeloid cells, in particular of the CD163+ type. The distribution pattern of all myeloid subtypes was comparable among the different histological subtypes. Analysis of the tumor cells revealed a high expression of IL-6R in 15% and of IL-6 in 23% of patients. Interestingly, tumors expressing IL-6 or IL-6R formed two different groups. Tumors with a high expression of IL-6R displayed low mature myeloid cell infiltration and a longer disease-specific survival (DSS), especially in late stage tumors. High expression of IL-6R was an independent prognostic factor for survival by multivariate analyses (hazard ratio = 0.474, p = 0.011). In contrast, tumors with high epithelial IL-6 expression displayed a dense infiltration of mature myeloid cells and were correlated with a shorter DSS. Furthermore, in densely CD8+ T-cell infiltrated tumors, the ratio between these lymphoid cells and CD163+ myeloid cells was predictive for survival. Thus, IL-6 and IL-6R are opposite markers for myeloid cell infiltration and survival.
Abbreviations:
- DSS, disease-specific survival
- EOC, epithelial ovarian cancer
- IL-6R, interleukin-6, IL-6, interleukin-6 receptor
- FIGO, International Federation of Gynecology and Obstetrics
- MDSC, myeloid-derived suppressor cell
- pSTAT3, phosphorylated signal transducer and activator of transcription 3
- T reg, regulatory T cell
- TMA, tissue microarray
- TAM, tumor-associated macrophage
- TIL, tumor-infiltrating lymphocytes
- TIM, tumor-infiltrating myeloid cell
Introduction
EOC remains a silent killer among women. Since most patients are asymptomatic until the disease has metastasized, two-thirds are diagnosed with advanced stage disease. Conventional treatment (surgery combined with chemotherapy) results are poor; 75% of the patients with advanced disease develop recurrences, causing approximately 60–80% of patients to die within 5 y of initial diagnosis.Citation1-Citation3 EOC consists of distinct histological subtypes. The most common subtype is serous carcinoma which accounts for about 70% of EOC. Other subtypes are endometrioid, mucinous and clear cell, of which the latter is associated with a worse prognosis than all the other subtypes.Citation4,5
EOC are infiltrated by a variety of immune cells.Citation6-Citation10 There are strong correlations between the number and type of tumor-infiltrating lymphocytes (TILs) and a favorable clinical outcome.Citation9,10 The spontaneous tumor-specific immune response, however, is weak and counteracted by local immunosuppressive cells, like regulatory T cells (T regs), preventing the infiltration or function of immune effector cells. In addition to TILs, TIMs are present in EOC. Tumor-associated macrophages (TAMs) and myeloid-derived suppressor cells (MDSCs) originate from myeloid precursors in the blood and undergo specific differentiation depending on cues in the local tumor microenvironment. They can roughly be divided into two distinct polarization states: the classically activated type 1 macrophages (M1), which are tumoricidal and produce interleukin-12 (IL-12), as well as the alternative activated type 2 macrophages (M2), which produce IL-10 and sabotage antitumor immunity. The presence of M2 macrophages in ovarian tumors is correlated with poor prognosis.Citation11,12 MDSCs are a heterogeneous population of cells that expand during cancer progression and have a remarkable ability to suppress T-cell responses, albeit that their mode of action is different from T regs.Citation13
IL-6 is a major mediator of cancer-related inflammation by stimulating inflammatory cytokine production, tumor growth, tumor angiogenesis, and tumor macrophage infiltration in ovarian cancer.Citation14-Citation17 Notably, the differentiation of both M2 macrophages and MDSCs can be mediated by IL-6.Citation13,16,18 However, the intricate interactions between IL-6 and tumor infiltration by myeloid cells in ovarian cancer are not well understood.
Aiming to elucidate these interactions, we studied the expression of IL-6, IL-6 receptor (IL-6R) and phosphorylated signal transducer and activator of transcription 3 (pSTAT3), important mediators in the IL-6 signaling pathway, as well as the number and type of infiltrating myeloid cells present in EOC. We determined the relationship between these markers, and their prognostic or therapeutic impact in a unique cohort of EOC.Citation9
Here, we demonstrate that the expression of IL-6 and its receptor are opposite markers for survival and infiltration with mature myeloid cells in ovarian cancer.
Results
Patient characteristics
Sufficient formalin-fixed paraffin embedded tumor tissue was available from 160 ovarian cancer patients. Clinicopathological characteristics of patients are summarized in . Half of the patients presented with serous histology and/or high grade disease. The majority of patients presented with late stage (FIGO stage III, IV) disease. The median DSS was 51.0 mo (95% CI 32.9–69.1, estimated 5-y DSS rate 46.1%). Of the patients treated with chemotherapeutics, 77.5% received a platinum-based regimen of whom 59.4% received this chemotherapeutic drug combined with taxane. However, 24 patients did not receive chemotherapy, as 15 patients presented with FIGO stage I and the remaining patients were either unfit or unwilling to receive chemotherapy.
Table 1. Clinicopathological characteristics and survival data of the 160 patients included in TMA analysis
Expression of markers of the IL-6 signaling pathway
First we evaluated the expression of IL-6, the IL-6R, and pSTAT3 in EOC within the tumor epithelium and stroma (). Representative staining patterns of the markers are depicted in . IL-6 expression was found in the tumor epithelium of 23.0% of patients, while 46.1% of the patients showed stromal expression. Expression of IL-6 in tumor epithelium was not correlated with stromal expression of IL-6 (). The IL-6R was very abundant on the tumor epithelium of the patients in this cohort with medium expression in 69.6% and high expression in 15.2% of all patients. Stromal expression of IL-6R was often absent or weak (87.1%), however, when present (13%), it was positively correlated with the expression of IL-6R on tumor epithelium (p < 0.001; ). There was no correlation between the expression of IL-6 and the expression of IL-6R within the tumor epithelium or stroma. The expression of pSTAT3 in tumor cells was found in 20% of the tumors, which was lower than the medium and high expression of IL-6R in tumor epithelium. Statistical analyses revealed that the expression patterns of pSTAT3 and the different markers did not correlate to one another.
Table 2A. Expression patterns of IL-6, IL-6R, and pSTAT3 in epithelial tumor tissue and stroma, subdivided by stage and tumor type
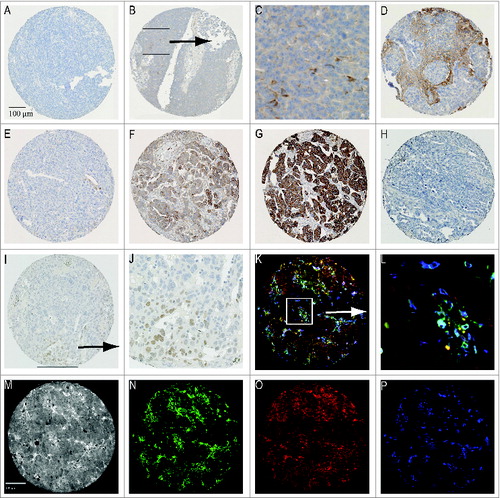
Figure 1. Representative staining patterns for (i) immunohistochemistry: (A) tumor core not expressing IL-6 (B) tumor positive for IL-6 (C) Magnification of area with IL-6 producing cells (D) stroma expressing IL-6 (E) low expression of IL-6 receptor (F) medium expression IL-6 receptor (G) high expression of IL-6 receptor (H) negative for pSTAT3 (I) pSTAT3 expressing tumor (J) Magnification quadrangle area of Figure 1I. And (ii) immunofluorescent staining patterns: (K) merged image (L) Magnification quadrangle area of (M) Black and white image (N) CD14 staining pattern (O) CD33 staining pattern (P) CD163 staining pattern.
Markers of the IL-6-signaling pathway in different EOC subtypes and disease stages
The entire cohort analyzed for the markers of the IL-6 signaling pathway comprises a number of different histological epithelial ovarian tumor types (). In order to analyze subtype-specific associations, differences in expression of these markers were examined. A high expression of IL-6R was more frequently found in mucinous and endometrioid subtypes than in tumors with serous histology (p = 0.032) (). However, the expression levels of IL-6 did not differ between the different subtypes. Furthermore, we determined whether expression varied between early (FIGO I/II) and late (FIGO III/IV) FIGO stages. Early stage disease showed relatively more high epithelial expression of the IL-6R (p = 0.035), which is in line with the fact that the great majority of the early stage tumors were among the mucinous and endometrioid tumors (Table S1). Late stage tumors displayed increased levels of stromal IL-6 expression (p = 0.035) ().
Infiltration of myeloid cell populations
In order to evaluate the presence of myeloid cells in EOC, we quantified tumor tissues for macrophages (CD14), their maturation status (CD33) and their polarization (M2; CD163) (). CD14 is a specific monocyte/macrophage marker, although it can also be found on subsets of dendritic cells.Citation26 CD33 is expressed on non-terminally differentiated myeloid cellsCitation27 and CD163 is linked to macrophage anti-inflammatory functions.Citation28-Citation30 The cellular distribution of these myeloid cell populations in tumor epithelium and stroma is depicted in . In general, tumors displayed a suppressive microenvironment as indicated by the high numbers of CD163-positive cells present. The stroma was most densely infiltrated with myeloid cells. The most abundant cell populations were CD14+CD33−CD163+, CD14+CD33+CD163+, and CD14−CD33−CD163+, both in tumor and in stroma.
There was a correlation between the density of the different cell types that infiltrated the tumor epithelium and the stroma (p < 0.001) in that having a large number of a certain cell type was associated with high numbers of other cell types infiltrating the tumor (Table S2). Importantly, the distribution of the different subtypes of myeloid cells followed the same distribution pattern for serous, mucinous and endometrioid tumors. There were no overt differences in the number of infiltrating myeloid cells, except that intraepithelial CD14+CD33+CD163+ cells were virtually not present in the mucinous subtype when compared to serous and endometrioid tumors (p = 0.021). The same trend was observed for CD14−CD33+CD163+ cells (p = 0.063). Furthermore, division of the patients on the basis of early and late stage disease revealed a trend for more stromal infiltration with CD14−CD33+CD163+ cells in early stage cancer (p = 0.063). Thus the distribution and number of all myeloid cell populations were grossly comparable among the different histological subtypes and among early or late stage tumors. Therefore, subsequent analyses on myeloid cells were performed using the entire cohort as one group.
Tumor expressed IL-6R correlates with a less dense infiltration of mature macrophages
The data from the whole cohort was used in our subsequent analyses to determine the correlation between the expression of IL-6 or pSTAT3 and the influx of myeloid cells, as the expression of these two proteins was not related to a specific histological subtype. shows that high expression of IL-6 in the tumor stroma was positively correlated with the influx of CD14+CD33−CD163− cells (p = 0.029) and CD14+CD33−CD163+ cells (p = 0.011). We analyzed the correlation between all mature (CD33-negative) myeloid cell populations and found a positive correlation with IL-6 expression in the tumor stroma (p = 0.007) (). The expression of IL-6 by the tumor epithelium was not significantly correlated with the presence of myeloid cells. The expression of pSTAT3 by tumor cells was related to a lower infiltration with CD14−CD33−CD163+ cells in tumor epithelium and stroma (p = 0.043, p = 0.005 respectively).
In addition, we analyzed the expression of the IL-6R with infiltration of different types of myeloid cells, taking into account the differences found in expression of the IL-6R in the different histological subtypes. First we analyzed all subtypes together, and found that a high expression of IL-6R by the tumor epithelium was correlated with the infiltration of low numbers of different types of intraepithelial macrophages, reflected by CD14+CD33−CD163−, CD14+CD33−CD163+ and CD14+CD33+CD163+ (p < 0.001, p = 0.014, p = 0.022 respectively) and low numbers of stromal CD14+CD33−CD163− and CD14+CD33+CD163+ cells (p = 0.022, p = 0.027 respectively, ). A high expression of IL-6R in stroma was negatively correlated with intraepithelial infiltration by mature macrophages CD14+CD33−CD163+ (p = 0.018), but was positively correlated with a dense influx of immature myeloid cell populations represented by CD14−CD33+CD163− (p = 0.004). This same pattern was seen in the stroma ().
Then we analyzed the different histological subtypes by comparing the number of the different stromal or intraepithelial myeloid cells in tumors with low or no expression of IL-6R vs. the tumors with a high expression of IL-6R. The tumors of serous origin with high expression of IL-6R displayed a lower infiltration with intraepithelial and stromal CD14+CD33−CD163− cells, CD14+CD33−CD163+ cells and CD14+CD33+CD163+ cells when compared to serous tumors with no or low IL-6R expression (Table S4). The number of patients with a tumor of mucinous or endometrioid origin stained for all markers was much lower than the number of serous tumors, however, clearly the tumors with a low IL-6R expression displayed high numbers of stromal CD14+CD33-CD163+ cells and CD14+CD33+CD163+ cells, while these numbers were strongly reduced in tumors with high IL-6R expression (Table S4). Finally, late stage tumors with high expression of IL-6R were also infiltrated by less intraepithelial and stromal CD14+CD33−CD163−, CD14+CD33−CD163+, and CD14+CD33+ CD163+ cells as compared to their counterparts with a low expression of IL-6R (Table S4).
Then, the correlation between all mature (CD33-negative) intraepithelial myeloid cell populations and IL-6R expression of the tumor was analyzed. This confirmed that a dense infiltration with mature intraepithelial myeloid cells was specifically detected in tumors with low/no IL-6R expression while their intraepithelial numbers were low in tumors with a strong IL-6R expression (p = 0.003; ). Divided per stage, more mature myeloid cells (CD33−) were seen in late stage patients (p = 0.013, data not shown).
Univariate analysis of disease-specific survival
The influence of each marker on DSS was determined by constructing Kaplan–Meier curves, and differences between groups were compared by Log Rank test. We found that epithelial IL-6 expression was correlated with a shorter DSS (p = 0.034). Interestingly, a longer DSS (p = 0.010) was seen in patients having a high expression of the IL-6R on tumor epithelium (). Since early stage disease had relatively higher expression of the IL-6R, the Kaplan–Meier analysis was also split into early and late stage disease. This revealed that the survival difference was only seen in late stage disease patients (p = 0.045; ). There was no survival difference found between the different histological subtypes. Further, DSS survival of patients was shorter if patients had a relatively high infiltration with CD33− cells in tumor epithelium (p = 0.017; ). Here, no survival differences were observed based on stage or histological subtype. Other markers were not significantly correlated with DSS in univariate analysis.
Figure 2. Kaplan–Meier survival analysis for disease-specific survival (DSS), differences between groups were analyzed by Log Rank test. (A) IL-6 expression in tumor epithelium is a predictor of shorter survival (p = 0.034). (B) High expression of the IL-6 receptor in tumor epithelium is associated with a longer DSS (p = 0.010). (C) IL-6R expression analyzed for early and late stage disease. In early stage patients, no difference in DSS was detected for the different expression groups (p = 0.239). In late stage patients, a high expression of the IL-6 receptor in tumor epithelium is associated with a longer DSS (p = 0.045). (D) Patients having a low infiltration of CD33- cells (lowest tertile) show an improved survival (p = 0.017) as compared to patients with a higher infiltration of these cell types. (E) No survival differences were detected when CD33- infiltration was analyzed for DSS in early vs. late stage disease patients.
Multivariate analysis
Variables that were significantly associated with DSS in the univariate analyses were entered into a Cox proportional hazards model. The model was adjusted for well-known prognostic parameters and stratified for type of chemotherapy (). In this model, IL-6 expression in tumor epithelium was not an independent prognostic marker for survival (p = 0.851; HR = 0.940; 95% CI 0.491–1.797). Also CD33- infiltration did not show to be an independent prognostic factor (p = 0.694; HR = 0.998; 95% CI 0.991–1.006). High IL-6R expression in tumor epithelium, however, was correlated with early stage disease (p = 0.035), low grade tumors (p < 0.001; data not shown) and non-serous tumors (p = 0.032; ). Importantly, in the multivariate analysis including these parameters, IL-6R expression in tumor epithelium was considered to be an independent prognostic marker. High expression was associated with a longer DSS, represented by a hazard ratio of 0.474 (p = 0.011; 95% CI 0.268–0.841).
Table 2B. p-values of correlation markers of IL-6 signaling pathway with myeloid cell populations
Table 2C. Cellular distribution of myeloid cell populations in tumor epithelium and stroma
Table 3. Multivariate Cox regression analyses of disease-specific survival in ovarian cancer patients
Unsupervised hierarchal clustering based on immune parameters
Previously we reported the infiltration of these tumors by T cells.Citation9 To gain a better insight into the immunological composition of EOC, we constructed a heatmap () containing 76 patients of which data from all previously established lymphoid parameters, our current data on myeloid cell populations, and on the markers of the IL-6 signaling pathway were available. Unsupervised clustering divided the patients into two major groups (A and B) that were both subdivided into two groups (A1 and A2, B1 and B2), which could be further subdivided into six smaller groups (A1, A2I, A2II, B1, B2I, and B2II). The Kaplan–Meier analysis of the six subgroups is shown in . A significant survival difference was found between groups B2I and B2II (p = 0.039), with the patients in group B2II displaying a shorter survival. Tumors in group B2II showed a dense infiltration of lymphoid (including FoxP3+ cells) and myeloid cells. Group B2I on the other hand comprised tumors from patients in which the infiltrating myeloid cells were mostly of the CD163-negative subtype. Furthermore, the tumors in this group displayed dense infiltration with CD8+ cells, but low numbers of infiltrating FoxP3+cells.
Figure 3. (A) A heatmap was created by unsupervised hierarchal clustering of patients based on all known immunological parameters. Included were lymphoid and myeloid cell populations and markers of the IL-6 signaling pathway. The changes from the lowest to highest tertile are reflected by a darker color, white boxes are missing data. On the X-axis the 76 included patients are depicted, and on the Y-axis all immune parameters are indicated. Each column represents the immune profile of one patient. Brackets to the left and along the top indicate the unsupervised clustering. (B) Kaplan–Meier analysis for the disease-specific survival of the six subgroups as determined by clustering analysis. A significant survival difference was found between groups B2I and B2II (p = 0.039). (C) Kaplan–Meier survival analysis for disease-specific survival of CD8/CD163 ratio lowest tertile vs. all other patients in patients with a high lymphocyte infiltrate (above median). Patients with a low ratio had significant shorter DSS (p = 0.034). Differences were analyzed by Log Rank test.
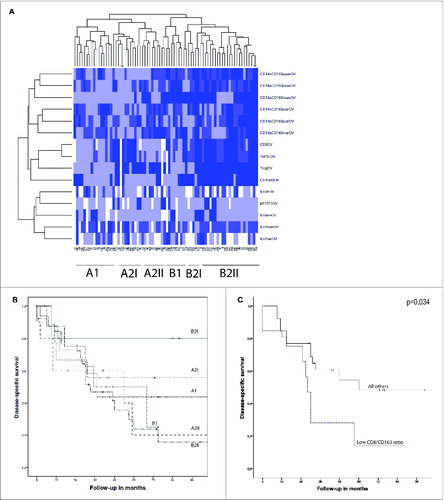
These observations led us to hypothesize that the proportion of CD8+ T cells and tumor promoting CD163+ myeloid cells (CD8/CD163 ratio) is predictive for survival. presents the Kaplan–Meier analysis on the CD8/CD163 ratio in the group of patients with high lymphocyte infiltration (CD8+ infiltration above median). Indeed, this ratio was predictive for survival (p = 0.036) and this was independent of the stage of disease (data not shown).
Discussion
We studied the composition of infiltrating myeloid cells and the expression of important mediators in the IL-6 signaling pathway in EOC. In general, ovarian tumors pose a hostile environment to immune effector cells, reflected by a dense infiltration with suppressive CD163+ types of myeloid cells as shown here and by others.Citation31,32 The most abundant intraepithelial and stromal cell populations we found were CD14+CD33−CD163+ cells, CD14+CD33+CD163+ cells, and CD14−CD33–CD163+ cells. Whereas the former two represent M2 macrophages, the latter population is likely to reflect immunosuppressive dendritic cells (DCs) or DC-derived macrophages.Citation30,33 As ovarian cancer refers to five different histological subtypes with distinct sites of origin, one can imagine that they have differences in the immune composition as well. Here, however, we show that the distribution pattern of all myeloid subtypes was comparable and proportional in the analyzed histological subtypes, suggesting that although EOC can originate from different cell types their attraction and polarization of myeloid cells does not really differ. There were no particular myeloid subpopulations directly correlated with DSS.
The expression of the IL-6R was most often seen in early stage, low grade, and non-serous histology, but was also found among serous tumors and late stage cancers. A high expression of the IL-6R on EOC cells was associated with a significantly longer DSS, an effect that was specifically seen in late stage disease and not among early stage patients who all did very well (). Importantly, the expression of IL-6R was an independent prognostic marker for an improved DSS in a multivariate analysis in which stage, grade, and histology were taken into account (p = 0.011; 95% CI 0.268–0.841).
Interestingly, tumors with a high expression of the IL-6R displayed a general lower number of intraepithelial and stromal myeloid cells than those with low or no IL-6R expression. Especially the number of mature (CD33-) myeloid cells was lower in tumors with high IL-6R expression. This suggests that the local microenvironment of tumors with a high IL-6R expression is less suppressive. Indeed, we observed a correlation between low infiltration with mature (CD33-) myeloid cells and longer survival. Although IL-6R expression is positively correlated with an influx of immature CD33+ cells, these are likely to reflect the previously identified inflammatory anergic macrophages that, as such, will not contribute to immune suppression.Citation34 In one other study of IL-6R expression in ovarian cancer tissue no correlation was found between IL-6R expression and survival.Citation17 Here, the expression of IL-6R was scored using a different method and the survival was plotted based on the median expression. Thereby, the patients with medium and high expression of IL-6R were mixed, whereas we found a difference in survival by plotting on basis of high IL-6R expression.
Our data suggest that the tumors with no to low expression of IL-6R do not require IL-6R receptor signaling for their growth and that tumors still expressing IL-6R depend on IL-6 produced outside the tumor cell. A possible explanation for the lack of staining could be that the more progressive tumors express a differentially spliced isoform of IL-6R that lacks the transmembraneCitation35 and as such will not be detected. However, we envision that once tumors have an autocrine production of IL-6, and can provide IL-6 needed for growth, signaling, and immunosuppressive actions, the receptor might be lost, and tumors may become more resistant.Citation36,37 Our data corroborate this hypothesis, since tumor expression of IL-6 and IL-6R are not correlated.
A high expression of IL-6 within the tumor is correlated with a shorter DSS (p = 0.034), albeit that IL-6 expression was not an independent prognostic factor. This observation sustains previous notions that the level of serum IL-6 in EOC patients correlates with poor survival.Citation38-Citation40 Surprisingly, the myeloid cell infiltration of tumors with high IL-6 expression was the opposite of that found in tumors with high IL-6R expression. Tumors with high IL-6 expression displayed a dense infiltration with CD14+CD33−CD163+ cells and CD14+CD33−CD163+ cells, specifically the mature (CD33-) type of myeloid cells. Our observation that the expression of IL-6 was correlated with the presence of CD14+CD33−CD163- cells, potentially reflecting recent infiltrated monocytes or M1 macrophages,Citation24 is somewhat counterintuitive. However, as the number of these tumor-infiltrating cells was generally low when compared to other cancer types,Citation24 and is directly correlated to co-infiltration with much larger quantities of suppressive CD33−CD163+ cells, this association is more likely to reflect that in essence IL-6 expressing tumors induce a hostile tumor immune environment. This scenario corresponds also with our observations that IL-6 producing ovarian cancer cells can polarize the differentiation of monocytes toward M2 macrophages.Citation18 A high level of IL-6 in the tumor microenvironment may attract and differentiate macrophages into subtypes that in their turn produce more IL-6, creating an immunosuppressive environment. Recently, Reinartz et al.Citation41 defined a subgroup of ovarian cancer patients with a poor clinical outcome, these patients displayed a high CD163 expression and high IL-6 levels in ascites.
In order to obtain a better understanding of the immune composition of these tumors, we performed an unsupervised clustering on all known immune parameters and IL-6 pathway markers. This revealed roughly two types of tumor environments with a difference in survival (). We can distinguish (i) a tumor rejecting environment (B2I) with a high infiltration of cytotoxic CD8+ T cells and fewer M2 macrophages and FoxP3+ cells (T regs), associated with a favorable clinical outcome and (ii) an immunosuppressive environment (B2II), with high infiltration of T regs and M2 macrophages, and a low infiltration of CD8+ cells, associated with a worse prognosis. Interestingly, in a recent study it was shown that such a composition of the tumor infiltrating immune cells in ovarian cancer is related to tumor expression of HOXA9.Citation42 Previously, we and others have shown that the CD8/T reg ratio was predictive for survival in EOC.Citation9,38,43 The constructed heatmap led us to hypothesize that in tumors highly infiltrated with CD8+ cells, the positive effect of CD8+ T cells may be counteracted by suppressive CD163+ myeloid cells and thus influence survival. Indeed, the CD8/CD163 ratio in highly infiltrated tumors was a predictive marker for DSS (p = 0.036), confirming the role of CD163+ cells as an immunosuppressive population and implying that patients may benefit from therapy that either depletes M2 macrophages or switches polarization of CD163+ cells toward M1 macrophages.
In summary, we found that IL-6R expression on tumor cells is an independent predictive factor for improved outcome and is associated with a low infiltration of mature myeloid cells. Furthermore, we showed that IL-6 is associated with a high density of mature myeloid cells and is correlated with a worse prognosis. In addition, a high density of M2 myeloid cells displayed a negative impact on CD8+ T cells; in patients with a high lymphocyte infiltration, the CD8/CD163 ratio is a positive predictor of survival. Based on these data we can distinguish two types of tumors based on IL-6, IL-6R, and immune infiltration. The first group of patients has tumors with a high expression of IL-6R and a low infiltration by mature myeloid cells. These patients have a good survival, suggesting that determination of IL-6R expression might be useful as a prognostic marker. The second group consists of patients of which tumors do not display the IL-6R, but have a high expression of IL-6, and are densely infiltrated with mature CD163+ myeloid cells. These patients have a worse prognosis and, potentially, blocking of the IL-6R may prevent differentiation of monocytes into M2 macrophagesCitation18 and prevent tumor progression.
Material and Methods
Patient material
Since 1985, the Department of Gynecological Oncology of the University Medical Centre Groningen (UMCG) prospectively stores all clinicopathologic and follow-up data of malignant EOC patients in a digital database. Primary treatment of all patients consisted of surgery, followed (when possible) by adjuvant chemotherapeutic treatment. Since 1995, platinum-based chemotherapy was supplemented with taxanes. Patients were surgically staged according to International Federation of Gynecology and Obstetrics (FIGO) classification.Citation19 Optimal and suboptimal debulking was defined as the largest residual tumor lesions having a diameter of, respectively, <2 cm or ≥2 cm. Histology of all tumors was determined according to World Health Organization criteria.Citation20 Follow-up was updated in July 2009. For the present study, relevant data from our digital database of all patients were transferred into a separate anonymous database, in which patient identity was protected by unique patient codes. According to Dutch law, no approval from our institutional review board was needed.
Tissue Micro-Arrays
Tumor samples from 361 patients were collected on a tissue micro-array (TMA). This TMA contained primary ovarian tumor tissue of 270 patients obtained before chemotherapeutic treatment. Patients with borderline or non-epithelial tumors were excluded. For this study, a cohort with the most recently treated patients (N = 160) was selected for analysis. The TMAs were constructed as previously described.Citation9,21,22 In brief, four representative cores with a diameter of 0.6 mm were taken out of paraffin-embedded tissue blocks using a tissue microarrayer (Beecher Instruments, Silver Spring, MD, USA) and were placed on a recipient paraffin block. From each TMA block, sections of 4 μm were cut and applied to APES-coated slides. The presence of tumor in the arrayed samples was confirmed by H&E staining.
Immunohistochemical staining
TMA sections were deparaffinized and rehydrated using xylene and graded concentrations of ethanol. Heat-induced antigen retrieval was performed in citrate buffer (10 mM citrate, pH 6.0). Endogenous peroxidase was blocked in a 0.3% H2O2 solution, after which sections were incubated with primary antibodies overnight at 4°C; rabbit polyclonal IL-6 antibody (1:400, Abcam), rabbit polyclonal to IL-6Rα (1:800, Santa Cruz Biotechnology), and rabbit monoclonal pSTAT3 antibody (1:150, Cell Signaling Technology, clone Tyr705). The antibodies were detected using HRP-labeled secondary (goat anti-rabbit) and tertiary (rabbit anti-goat) antibodies for 30 min at RT (1:100, DAKO,), and visualized with 3,3-diaminobenzidine. Hematoxylin was used for counterstaining.
Scoring
All staining patterns were scored independently by two observers, who had no prior knowledge of clinicopathological information. To achieve good concordance with whole tissue slides, minimally two cores containing at least 20% tumor epithelium had to be present on the TMA for a sample to be selected for further analysis.Citation21 IL-6 expression in stroma and IL-6R staining were scored according to the method of Ruiter et al.Citation23 The intensity of the staining was scored as 0 (absent), 1 (weak), 2 (positive), or 3 (strong expression). The percentage of positive tumor cells was grouped as 0 (0%), 1 (1–5%), 2 (5–25%), 3 (25–50%), 4 (50–75%), and 5 (75–100%). The sum of these two scores was divided by the number of evaluated cores per tumor, which was subsequently grouped into no/weak expression (0–2), medium expression (3–6), and high expression (7–8). IL-6R expression in stroma was scored in four intensity categories: none, weak, medium, or strong staining. Patients were categorically defined as either having positive or negative expression for IL-6 or pSTAT3 within the tumor epithelium, with the latter localized to the nucleus.
Immunofluorescent staining
Characterization of TIM was carried out with triple immunofluorescent staining as described previously.Citation24 Briefly, after deparaffinization and rehydration of the 4-μm tissue sections, heat-mediated antigen retrieval with a 1 mmol/L EDTA solution (pH 9.0) was performed. A mixture containing primary antibodies anti-CD33 (1:50, mouse-IgG2b, clone PWS44, Leica Microsystems B.V.), anti-CD14 (1:100, mouse-IgG2a, clone 7, Leica Microsystems B.V.) and anti-CD163 (1:400, mouse-IgG1, Clone 10D6, Leica Microsystems B.V.) was applied to the tissue sections overnight at room temperature. The next day, a mixture of fluorescently labeled secondary antibodies (goat anti-mouse IgG2b-Alexa Fluor 546, goat anti-mouse IgG2a-Alexa Fluor 488 and goat anti-mouse IgG1-Alexa Fluor 647; Molecular Probes) was used to detect primary antibody binding. Images were captured with a confocal laser scanning microscope (Zeiss LSM 510) in a multitrack setting. Epithelial tumor cell nests and stromal areas were measured using the Zeiss LSM Image Examiner. Myeloid subsets were manually counted in all representative images for either tumor epithelium, stroma, or both and were presented as the number of cells per mm2.
Statistical analysis
Statistical analysis was performed using Statistical Package for the Social Sciences [SPSS Statistics] 20 software package for Windows (SPSS Inc.). For all tests, p-values <0.05 were considered significant and all p-values were tested two-sided. DSS was defined as the time period from date of surgery until death due to ovarian cancer or last follow-up. DSS was calculated using the Kaplan–Meier method. Survival differences between groups were assessed using the Log Rank test. Variables that were significantly associated with DSS in the univariate analyses were entered into a multivariate analysis. For this purpose, Cox proportional hazards models, stratified for type of chemotherapy, were used. The χ2 test was used to associate markers of the IL-6 pathway, myeloid cell populations, lymphoid cell populations, and clinicopathological parameters. Spearman's correlation was applied to calculate correlation between the myeloid cell populations. The Mann Whitney U test with Bonferroni correction for multiple comparisons was used to determine differences in infiltration of myeloid cells and IL-6R expression between patient populations.
Unsupervised hierarchical clustering was performed as described previouslyCitation25 using complete-linkage and Euclidian distance in the function “heatmap” of the “stats” package in R. (Development Core Team, a language and environment for statistical computing, reference index version 2.14.0. 2005. Foundation for Statistical Computing, Vienna, Austria).
Disclosure of Potential Conflicts of Interest
No potential conflicts of interest were disclosed.
Supplemental Material
Supplemental data for this article can be accessed on the publisher's website.
Supplementary Tables
Download MS Word (53.1 KB)Funding
MJPW was financially supported by a grant from the Dutch Cancer Society 2009-4400
References
- Mei L, Chen H, Wei DM, Fang F, Liu GJ, Xie HY, Wang X, Zou J, Han X, Feng D. Maintenance chemotherapy for ovarian cancer. Cochrane Database Syst Rev 2010; Sep 8;(9):CD007414; PMID:20824860; http://dx.doi.org/10.1002/14651858.CD007414.pub2
- Lavoue V, Thedrez A, Leveque J, Foucher F, Henno S, Jauffret V, Belaud-Rotureau MA, Catros V, Cabillic F. Immunity of human epithelial ovarian carcinoma: the paradigm of immune suppression in cancer. J Transl Med 2013; 11:147; PMID:23763830; http://dx.doi.org/10.1186/1479-5876-11-147
- Ferlay J, Steliarova-Foucher E, Lortet-Tieulent J, Rosso S, Coebergh JW, Comber H, Forman D, Bray F. Cancer incidence and mortality patterns in Europe: estimates for 40 countries in 2012. Eur J Cancer 2013; 49:1374-403; PMID:23485231; http://dx.doi.org/10.1016/j.ejca.2012.12.027
- Kumar J, Ward AC. Role of the interleukin 6 receptor family in epithelial ovarian cancer and its clinical implications. Biochim Biophys Acta 2014; 1845:117-25; PMID:24388871
- Tan DS, Kaye S. Ovarian clear cell adenocarcinoma: a continuing enigma. J Clin Pathol 2007; 60:355-60; PMID:17018684; http://dx.doi.org/10.1136/jcp.2006.040030
- Tomsova M, Melichar B, Sedlakova I, Steiner I. Prognostic significance of CD3+ tumor-infiltrating lymphocytes in ovarian carcinoma. Gynecol Oncol 2008; 108:415-20; PMID:18037158; http://dx.doi.org/10.1016/j.ygyno.2007.10.016
- Wolf D, Wolf AM, Rumpold H, Fiegl H, Zeimet AG, Muller-Holzner E, Deibl M, Gastl G, Gunsilius E, Marth C. The expression of the regulatory T cell-specific forkhead box transcription factor FoxP3 is associated with poor prognosis in ovarian cancer. Clin Cancer Res 2005; 11:8326-31; PMID:16322292; http://dx.doi.org/10.1158/1078-0432.CCR-05-1244
- Curiel TJ, Coukos G, Zou L, Alvarez X, Cheng P, Mottram P, Evdemon-Hogan M, Conejo-Garcia JR, Zhang L, Burow M et al. Specific recruitment of regulatory T cells in ovarian carcinoma fosters immune privilege and predicts reduced survival. Nat Med 2004; 10:942-49; PMID:15322536; http://dx.doi.org/10.1038/nm1093
- Leffers N, Gooden MJ, de Jong RA, Hoogeboom BN, ten Hoor KA, Hollema H, Boezen HM, van der Zee AG, Daemen T, Nijman HW. Prognostic significance of tumor-infiltrating T-lymphocytes in primary and metastatic lesions of advanced stage ovarian cancer. Cancer Immunol Immunother 2009; 58:449-59; PMID:18791714; http://dx.doi.org/10.1007/s00262-008-0583-5
- Zhang L, Conejo-Garcia JR, Katsaros D, Gimotty PA, Massobrio M, Regnani G, Makrigiannakis A, Gray H, Schlienger K, Liebman MN et al. Intratumoral T cells, recurrence, and survival in epithelial ovarian cancer. N Engl J Med 2003; 348:203-13; PMID:12529460; http://dx.doi.org/10.1056/NEJMoa020177
- Lan C, Huang X, Lin S, Huang H, Cai Q, Wan T, Lu J, Liu J. Expression of M2-polarized macrophages is associated with poor prognosis for advanced epithelial ovarian cancer. Technol Cancer Res Treat 2013; 12:259-67; PMID:23289476
- Zhang QW, Liu L, Gong CY, Shi HS, Zeng YH, Wang XZ, Zhao YW, Wei YQ. Prognostic significance of tumor-associated macrophages in solid tumor: a meta-analysis of the literature. PLoS One 2012; 7:e50946; PMID:23284651; http://dx.doi.org/10.1371/journal.pone.0050946
- Gabrilovich DI, Ostrand-Rosenberg S, Bronte V. Coordinated regulation of myeloid cells by tumours. Nat Rev Immunol 2012; 12:253-68; PMID:22437938; http://dx.doi.org/10.1038/nri3175
- Dijkgraaf EM, Welters MJ, Nortier JW, van der Burg SH, Kroep JR. Interleukin-6interleukin-6 receptor pathway as a new therapy target in ovarian cancer. Curr Pharm Des 2012; 18(25):3816-27; PMID:22591418
- Trikha M, Corringham R, Klein B, Rossi JF. Targeted anti-interleukin-6 monoclonal antibody therapy for cancer: a review of the rationale and clinical evidence. Clin Cancer Res 2003; 9:4653-65; PMID:14581334
- Wang Y, Li L, Guo X, Jin X, Sun W, Zhang X, Xu RC. Interleukin-6 signaling regulates anchorage-independent growth, proliferation, adhesion and invasion in human ovarian cancer cells. Cytokine 2012; 59:228-36; PMID:22595649; http://dx.doi.org/10.1016/j.cyto.2012.04.020
- Coward J, Kulbe H, Chakravarty P, Leader D, Vassileva V, Leinster DA, Thompson R, Schioppa T, Nemeth J, Vermeulen J et al. Interleukin-6 as a Therapeutic Target in Human Ovarian Cancer. Clin Cancer Res 2011; 17:6083-96; PMID:21795409; http://dx.doi.org/10.1158/1078-0432.CCR-11-0945
- Dijkgraaf EM, Heusinkveld M, Tummers B, Vogelpoel LT, Goedemans R, Jha V, Nortier JW, Welters MJ, Kroep JR, van der Burg SH. Chemotherapy alters monocyte differentiation to favor generation of cancer-supporting M2 macrophages in the tumor microenvironment. Cancer Res 2013; 73:2480-2492; PMID:23436796; http://dx.doi.org/10.1158/0008-5472.CAN-12-3542
- Pecorelli S, Benedet JL, Creasman WT, Shepherd JH. FIGO staging of gynecologic cancer. 1994-1997 FIGO Committee on Gynecologic Oncology. International Federation of Gynecology and Obstetrics. Int J Gynaecol Obstet 1999; 64:5-10; PMID:10190664; http://dx.doi.org/10.1016/S0020-7292(98)00234-3
- Scully RE. World Health Organization classification and nomenclature of ovarian cancer. Natl Cancer Inst Monogr 1975; 42:5-7; PMID:1234636
- Rosen DG, Huang X, Deavers MT, Malpica A, Silva EG, Liu J. Validation of tissue microarray technology in ovarian carcinoma. Mod Pathol 2004; 17:790-797; PMID:15073602; http://dx.doi.org/10.1038/modpathol.3800120
- Kononen J, Bubendorf L, Kallioniemi A, Barlund M, Schraml P, Leighton S, Torhorst J, Mihatsch MJ, Sauter G, Kallioniemi OP. Tissue microarrays for high-throughput molecular profiling of tumor specimens. Nat Med 1998; 4:844-47; PMID:9662379; http://dx.doi.org/10.1038/nm0798-844
- Ruiter DJ, Ferrier CM, van Muijen GN, Henzen-Logmans SC, Kennedy S, Kramer MD, Nielsen BS, Schmitt M. Quality control of immunohistochemical evaluation of tumour-associated plasminogen activators and related components. European BIOMED-1 Concerted Action on Clinical Relevance of Proteases in Tumour Invasion and Metastasis. Eur J Cancer 1998; 34:1334-40; PMID:9849413; http://dx.doi.org/10.1016/S0959-8049(98)00151-8
- de Vos van Steenwijk PJ, Ramwadhdoebe TH, Goedemans R, Doorduijn EM, van Ham JJ, Gorter A, van HT, Kuijjer ML, van Poelgeest MI, van der Burg SH et al. Tumor-infiltrating CD14-positive myeloid cells and CD8-positive T-cells prolong survival in patients with cervical carcinoma. Int J Cancer 2013; 133:2884-94; PMID:23740735
- Kuijjer ML, Namlos HM, Hauben EI, Machado I, Kresse SH, Serra M, Llombart-Bosch A, Hogendoorn PC, Meza-Zepeda LA, Myklebost O et al. mRNA expression profiles of primary high-grade central osteosarcoma are preserved in cell lines and xenografts. BMC Med Genomics 2011; 4:66; PMID:21933437; http://dx.doi.org/10.1186/1755-8794-4-66
- Figel AM, Brech D, Prinz PU, Lettenmeyer UK, Eckl J, Turqueti-Neves A, Mysliwietz J, Anz D, Rieth N, Muenchmeier N et al. Human renal cell carcinoma induces a dendritic cell subset that uses T-cell crosstalk for tumor-permissive milieu alterations. Am J Pathol 2011; 179:436-51; PMID:21703422; http://dx.doi.org/10.1016/j.ajpath.2011.03.011
- Andrews RG, Torok-Storb B, Bernstein ID. Myeloid-associated differentiation antigens on stem cells and their progeny identified by monoclonal antibodies. Blood 1983; 62:124-32; PMID:6190518
- Van GH, Delputte PL, Nauwynck HJ. Scavenger receptor CD163, a Jack-of-all-trades and potential target for cell-directed therapy. Mol Immunol 2010; 47:1650-1660; PMID:20299103; http://dx.doi.org/10.1016/j.molimm.2010.02.008
- Figel AM, Brech D, Prinz PU, Lettenmeyer UK, Eckl J, Turqueti-Neves A, Mysliwietz J, Anz D, Rieth N, Muenchmeier N et al. Human renal cell carcinoma induces a dendritic cell subset that uses T-cell crosstalk for tumor-permissive milieu alterations. Am J Pathol 2011; 179:436-51; PMID:21703422; http://dx.doi.org/10.1016/j.ajpath.2011.03.011
- Maniecki MB, Moller HJ, Moestrup SK, Moller BK. CD163 positive subsets of blood dendritic cells: the scavenging macrophage receptors CD163 and CD91 are coexpressed on human dendritic cells and monocytes. Immunobiology 2006; 211:407-17; PMID:16920480; http://dx.doi.org/10.1016/j.imbio.2006.05.019
- Maniecki MB, Moller HJ, Moestrup SK, Moller BK. CD163 positive subsets of blood dendritic cells: the scavenging macrophage receptors CD163 and CD91 are coexpressed on human dendritic cells and monocytes. Immunobiology 2006; 211:407-17; PMID:16920480; http://dx.doi.org/10.1016/j.imbio.2006.05.019
- Kawamura K, Komohara Y, Takaishi K, Katabuchi H, Takeya M. Detection of M2 macrophages and colony-stimulating factor 1 expression in serous and mucinous ovarian epithelial tumors. Pathol Int 2009; 59:300-305; PMID:19432671; http://dx.doi.org/10.1111/j.1440-1827.2009.02369.x
- Diao J, Mikhailova A, Tang M, Gu H, Zhao J, Cattral MS. Immunostimulatory conventional dendritic cells evolve into regulatory macrophage-like cells. Blood 2012; 119:4919-27; PMID:22490680; http://dx.doi.org/10.1182/blood-2011-11-392894
- Smythies LE, Sellers M, Clements RH, Mosteller-Barnum M, Meng G, Benjamin WH, Orenstein JM, Smith PD. Human intestinal macrophages display profound inflammatory anergy despite avid phagocytic and bacteriocidal activity. J Clin Invest 2005; 115:66-75; PMID:15630445; http://dx.doi.org/10.1172/JCI200519229
- Rath KS, Funk HM, Bowling MC, Richards WE, Drew AF. Expression of soluble interleukin-6 receptor in malignant ovarian tissue. Am J Obstet Gynecol 2010; 203:230-238; PMID:20471626; http://dx.doi.org/10.1016/j.ajog.2010.03.034
- Wang Y, Niu XL, Qu Y, Wu J, Zhu YQ, Sun WJ, Li LZ. Autocrine production of interleukin-6 confers cisplatin and paclitaxel resistance in ovarian cancer cells. Cancer Lett 2010; 295:110-123; PMID:20236757; http://dx.doi.org/10.1016/j.canlet.2010.02.019
- Cohen S, Bruchim I, Graiver D, Evron Z, Oron-Karni V, Pasmanik-Chor M, Eitan R, Bernheim J, Levavi H, Fishman A et al. Platinum-resistance in ovarian cancer cells is mediated by IL-6 secretion via the increased expression of its target cIAP-2. J Mol Med (Berl) 2013; 91:357-68; PMID:23052480
- Coward JI, Kulbe H. The role of interleukin-6 in gynaecological malignancies. Cytokine Growth Factor Rev 2012; 23:333-42; PMID:23031497; http://dx.doi.org/10.1016/j.cytogfr.2012.08.005
- Guo Y, Xu F, Lu T, Duan Z, Zhang Z. Interleukin-6 signaling pathway in targeted therapy for cancer. Cancer Treat Rev 2012; 38:904-10; PMID:22651903; http://dx.doi.org/10.1016/j.ctrv.2012.04.007
- Plante M, Rubin SC, Wong GY, Federici MG, Finstad CL, Gastl GA. Interleukin-6 level in serum and ascites as a prognostic factor in patients with epithelial ovarian cancer. Cancer 1994; 73:1882-88; PMID:8137215; http://dx.doi.org/10.1002/1097-0142(19940401)73:7<1882::AID-CNCR2820730718>3.0.CO;2-R
- Reinartz S, Schumann T, Finkernagel F, Wortmann A, Jansen JM, Meissner W, Krause M, Schworer AM, Wagner U, Muller-Brusselbach S et al. Mixed-polarization phenotype of ascites-associated macrophages in human ovarian carcinoma: correlation of CD163 expression, cytokine levels and early relapse. Int J Cancer 2014; 134:32-42; PMID:23784932; http://dx.doi.org/10.1002/ijc.28335
- Ko SY, Ladanyi A, Lengyel E, Naora H. Expression of the homeobox gene HOXA9 in ovarian cancer induces peritoneal macrophages to acquire an M2 tumor-promoting phenotype. Am J Pathol 2014; 184:271-81; PMID:24332016; http://dx.doi.org/10.1016/j.ajpath.2013.09.017
- Preston CC, Maurer MJ, Oberg AL, Visscher DW, Kalli KR, Hartmann LC, Goode EL, Knutson KL. The Ratios of CD8(+) T Cells to CD4(+)CD25(+) FOXP3(+) and FOXP3(-) T Cells Correlate with Poor Clinical Outcome in Human Serous Ovarian Cancer. PLoS One 2013; 8:e80063; PMID:24244610; http://dx.doi.org/10.1371/journal.pone.0080063