
Abstract
In many cancers, regulatory T cells (Treg) play a crucial role in suppressing the effector immune response thereby permitting tumor development. Indeed, in mouse models, their depletion can promote the regression of tumors of various origins, including renal cell carcinoma when located subcutaneous (SC). In the present study, we aimed to assess the importance of Treg immunosuppression in the physiologic context of metastatic renal carcinoma (Renca) disease. To that purpose we inoculated renal tumors orthotopically, intra-kidney (IK), in mice. Treg depletions were performed using anti-CD4 antibody in wild type mice or diphtheria toxin (DT) in Foxp3DTR transgenic mice. Our main observation was that Treg were not the key immunosuppressive component of the IK tumoral microenvironment, compared to the same tumors located SC. We demonstrated that the CD8+ effector immune response was still suppressed in IK tumors when compared to SC tumors, following Treg depletion. Furthermore, the level of program cell death protein (PD)-1 was increased on the surface of CD4+ T cells infiltrating IK tumors compared to SC tumors. Finally, the Treg-independent immunosuppression, occurring in IK tumors, was potent enough to inhibit regression of concomitant SC tumors, normally responsive to Treg depletion. Our findings provide further insight into the immunosuppressive nature of the immune response generated in the kidney microenvironment, suggesting that it can have additional mechanisms in addition to Treg. These observations might help to identify better targets from the kidney tumor microenvironment for future cancer therapies.
Abbreviations:
- CD, cluster of differentiation
- CTLA-4, cytotoxic T lymphocyte antigen 4
- DEREG, Depletion of Regulatory T cells
- DT, diphtheria toxin
- DTR, diphtheria toxin receptor
- FCS, fetal calf serum
- FR, folate receptor
- Foxp3, Forkhead box protein P3
- IFN, interferon
- IK, intra-kidney
- IL, interleukin
- IP, intra-peritoneal
- IV, intravenously
- mAb, monoclonal antibody
- M2, type-2 immunosuppressive macrophages
- PBS, phosphate-buffered saline
- PD-1, program cell death protein 1
- PD-L1, PD ligand 1
- Renca Ch+ L+, Renca Cherry Luciferase
- SC, subcutaneous
- TCR, T cell receptor
- Th, T helper cells
- Treg, regulatory T cells
Introduction
Since their initial characterization 45 y agoCitation1 Treg have been extensively studied and described as a population of CD4+ T cells defined by their expression of CD25 and Forkhead box protein P3 (Foxp3).Citation2 Their main function is to suppress an immune response and they are particularly important for maintaining tolerance to self-tissues.Citation3,4
In the field of tumor immunology, North and colleagues reported that tumor-suppressor CD4+CD25+ T cells prevent the rejection of tumors in mice.Citation5 High frequencies of Treg can be detected in tumors and correlate with a poor prognosis for patient outcome in numerous types of cancer.Citation6 Treg can infiltrate the tumor microenvironment and can help the tumor escape the immune system.Citation7
The importance of the immunoregulation performed by Treg in a tumor setting is well documented by numerous studies using prophylactic depletion of Treg. Depleting antibodies recognizing some Treg surface markers, including CD4, CD25 and the folate receptor 4 (FR4) have the ability to provoke tumor rejection in different mouse tumor models, when they were administered prior to tumor inoculation.Citation8-12 However, when administrated to mice bearing established tumors, anti-CD25 monoclonal antibody (mAb)Citation13 or anti-FR4 mAbCitation14 failed to provoke tumor rejection. More recently, the complete depletion of Foxp3+ Treg was achieved by injecting DT in transgenic mice expressing the diphtheria toxin receptor (DTR) under the control of the FOXP3 gene promoter (DEREG mice, Foxp3DTR).Citation15,16 Indeed, we previously demonstrated using DEREG mice that complete Treg depletion eradicated a proportion of established tumors in mice in an interferon (IFN)γ- dependent manner.Citation17
Importantly, targeting Treg in the tumor microenvironment, by depleting them or attenuating their suppressive functions, using for example anti-cytotoxic T lymphocyte antigen (CTLA)-4 mAb,Citation18 has been considered a promising strategy and has shown encouraging results in mice and humans, improving the efficacy of some immunotherapies.Citation19
In previous work, we demonstrated that anti-CD4, anti-CD25 or anti-FR4 mAb, administered prior to SC Renca inoculation were able to promote tumor regression. Our findings highlighted the importance of the Treg population in the suppression of the effector immune response that occurred in SC Renca tumors. We also determined that CD8+ T cells, but not cytokines such as IFNγ, interleukin (IL)4 and IL13, were crucial for tumor rejection following Treg depletion using anti-CD4 mAb.Citation14 In a more recent study, we determined that Renca tumor cells, inoculated IK in their orthotopic microenvironment, developed a strong type-2 macrophage/T helper (h)2-related immunosuppressive context rendering tumors more resistant to immunotherapy compared to SC Renca tumors.Citation20 However, we did not assess in that study whether Treg could play a role in the immunosuppressive response occurring in IK Renca tumors.
In the present study, we aimed to assess the importance of Treg in the immunosuppression exhibited by IK tumors. To that purpose, we performed experiments where Treg were depleted in IK tumor-bearing mice using different strategies. We used anti-CD4 in order to deplete Treg from kidney tumors, since we had previously observed that anti-CD4 was efficient at depleting CD4+Foxp3+ T cells leading to rejection of SC Renca tumors in mice.Citation14 To our knowledge, the antitumor potential of anti-CD4 mAb has been assessed when injected prior to tumor implantation,Citation11,14 but never on established SC tumors. We also investigated the effect of Treg depletion using the BALB/c Foxp3DTR transgenic mouse model.
Our results established that the immunosuppressive response in the IK tumor microenvironment has a significant Treg-independent component, in contrast with SC tumors. This finding furthers our understanding of the immunosuppressive response that occurs in kidney tumors and drives their potential resistance to immunotherapies.
Results
Treg depletion using anti-CD4 eradicates established subcutaneous Renca tumors but not intrarenal tumors
Having previously demonstrated that prophylactic Treg depletion could prevent SC Renca tumor development in a CD8+ T cell-manner,Citation14 we sought to determine the efficacy of Treg depletion on established Renca tumors. Furthermore, since orthotopic metastatic tumors represent a more physiologically relevant model than SC disease, we wished to assess the effect of Treg depletion on orthotopic Renca tumors inoculated intrarenal. Following intrarenal inoculation of Renca, a primary tumor forms in the kidney at the site of inoculation, resulting in the development of spontaneous lung metastases.Citation20
Since we had previously found that the use of anti-CD4 mAb was more effective than anti-CD25 or anti-FR4 at depleting Treg in BALB/c mice,Citation14 we treated mice bearing established SC or kidney Renca tumors (11 d) by intraperitoneal injection of anti-CD4 or control antibody on days 11, 12 and 13. All control-treated tumors grew progressively, but despite initial progression of tumors, the majority of SC tumors fully regressed following Treg depletion (). However, Treg depletion did not significantly inhibit kidney tumor growth and all mice died due to malignant disease (). In addition, a large proportion of mice with SC tumors survived long term following Treg depletion, whereas all kidney tumor-bearing mice died (). Since administration of anti-CD4 depletes non-regulatory CD4-expressing T cells in addition to Treg, we aimed to validate our findings with a more specific form of Treg depletion using Foxp3DTR BALB/c mice in which the DTR is expressed in Treg under the control of the FOXP3 promoter. Similarly to depletion using anti-CD4, specific Treg depletion using DT in Foxp3DTR mice was much less effective against kidney tumors compared to SC tumors (). SC tumor-bearing mice in were only monitored to day 60 after tumor injection since at that time all surviving mice were tumor-free, and tumor recurrence after that time point was highly unlikely, based on our previous experience in the Renca model. Despite not following mouse survival to day 100 in , we consider our main finding that specific depletion of Treg in BALB/c Foxp3DTR mice using DT has a dramatic effect on SC tumor growth is strongly supported by the existing data to day 60.
Figure 1. Treg depletion eradicates some Renca tumors established subcutaneously but not intra-kidney (IK). Mice were inoculated at day 0 with 2 × 10⁵ Renca Ch+ L+ tumor cells subcutaneous (SC) or intra-kidney (IK). All mice were then injected intra-peritoneal (IP), at days 11, 12, 13, with anti-CD4 antibody (αCD4) or isotype control antibody (Ctl) when tumors were established (∼20–30 mm2). (A) Tumor growth, following SC injection, was monitored using a caliper and size was calculated by multiplying the longest diameter by its perpendicular diameter (n = 11–13, representative experiment of 3). (B) Bioluminescence emission imaging was used to monitor Renca Ch+ Luc + IK tumors development following IP injection of D-luciferin. Bioluminescent counts were analyzed from a region of interest applied around mice IK tumors. (n = 9–10, representative experiment of 2). (C) Survival of mice inoculated SC or IK (n = 29–37 per group, 3 experiments pooled). (D and E) Survival of Foxp3DTR mice injected with 2 × 10⁵ Renca cells (D) SC and (E) IK and treated IP with one dose of diphtheria toxin (DT) and PBS as control (Ctl) at (D) day 13 or (E) day 9. (D) (n = 4–6 per group). (E) One experiment (n = 5–7 per group). Statistical analyses of survivals were performed using Log-rank (Mantel–Cox) test ** P < 0.005. *** P < 0.0005.
Depletion of Treg in the previous experiments by anti-CD4 was confirmed using flow cytometric analysis of blood and dissociated tumors from mice bearing SC or kidney tumors (). Thus, kidney tumors responded much less than SC tumors following Treg depletion. Administration of DT to Foxp3DTR mice bearing Renca tumors also led to a significant depletion of Treg in blood and tumors (). Furthermore and interestingly, we observed no difference of the percentage of various immune cell subsets, including B cells, dendritic cells, macrophages and granulocytes, infiltrating SC and IK tumors when we performed cytometric analysis 7 and 15 d after Treg depletion by anti-CD4 (see Supplementary Fig. 1).
Figure 2. Treg are depleted in the blood and in tumors following anti-CD4 antibody or diphtheria toxin (DT) injections. Mice were inoculated at day 0 with 2 × 10⁵ Renca Ch+ L+ tumor cells subcutaneous (SC) or intra-kidney (IK) (A–D) Representative FACS analysis of the gating strategy for Treg, and (E and F) quantitative data of percentage of Treg of CD4+ cells analyzed in blood and tumors from (A and C) SC and (B and D) IK tumor-bearing mice. (A, B and E) Wild-type mice were injected with anti-CD4 depleting antibody (CD4 d.) or not depleted as control (Ctl) at days 11, 12, 13 after tumor cell inoculation n = 3 mice per group, from one representative experiment of three. (C and F, SC left panel) Foxp3DTR tumor-bearing mice were injected with DT at day 12 after tumor cells inoculation, n = 4 mice per group, from one experiment. (D and F, IK right panel) Tumor-bearing mice were injected with DT at day 9 after tumor cells inoculation, n = 3 mice per group, from one representative experiment of two. Leukocytes from blood and tumors were analyzed 7 d after last anti-CD4 mAb injection and 2 d (for SC tumors) or 5 d (for IK tumors) after DT injection, by flow cytometry using anti-CD45.2, anti-CD4, anti-T cell receptor (TCR) β, anti-CD25 and anti-Foxp3 antibodies or Foxp3-GFP expression in Foxp3DTR mice. Numbers in the dot plots represent the percentage of cells of total CD4+ cells. Statistical analyses analysis were performed using Mann–Whitney test ** P < 0.005, **** P < 0.0001.
These observations describe the ability of Treg depletion to mediate complete regression of established SC tumors, and present new findings describing the relative resistance of kidney tumors to Treg depletion.
The CD8+ T cell response following Treg depletion is reduced in kidney tumors compared to subcutaneous tumors
Since we previously determined that CD8+ T cells were crucial to protection from SC Renca tumors following Treg depletion,Citation14 we sought to gain insight into the mechanisms of the differential responses of SC and kidney tumors to Treg depletion by analyzing tumors for the frequency and functional status of CD8+ T cells. While both SC and kidney tumors contained similar percentages of CD8+ T cells without Treg depletion, SC tumors contained a significantly higher percentage of CD8+ T cells than kidney tumors following Treg depletion (). In addition, SC tumors contained a significantly higher proportion of IFNγ+ CD8+ T cells than kidney tumors, suggesting the T cells were less activated in kidney tumors following Treg depletion (). A higher level of IFNγ was also found in CD8+ T cells infiltrating SC tumors compared to kidney tumors (). Interestingly, T cells in SC tumors expressed lower levels of CD8 than T cells in kidney tumors (), again suggesting that kidney tumor infiltrating T cells were less activated than those infiltrating SC tumors.Citation21 In addition, flow-cytometric analysis of SC and IK tumor infiltrating CD4+ T cells in the absence of any depletion demonstrated a greater proportion of CD4+ T cells infiltrating kidney tumors expressing higher levels of PD-1 than CD4+ T cells in SC tumors (). Also, a higher proportion of PD-1+ Treg infiltrating IK tumors compared to SC tumors was observed (). These results suggest a higher degree of immunosuppression on CD4+ T cells and greater immunoregulatory potential of Treg in IK tumors compared to SC tumors. Furthermore, all Renca Ch+ L+ tumor cells expressed the PD ligand 1 (PD-L1) in vivo at similar level (), suggesting the involvement of the PD-1/PD-L1 immunosuppressive pathway in the immunosuppression.
Figure 3. Treg depletion increased the CD8+ T cell effector immune response in subcutaneous (SC) tumors. Mice were injected with 2 × 10⁵ Renca Ch+ L+ SC or intra-kidney (IK) at day 0 and depleted using anti-CD4 antibody (mAb) at days 11, 12, 13 (CD4 d.) or PBS as control (Ctl). CD8+ T cells infiltrating tumors were analyzed, 7 d after the last injection of anti-CD4 mAb, by flow cytometry using anti-CD45.2, anti-T cell receptor (TCR) β, anti-CD8 and anti-interferon (IFN)γ antibodies. Numbers in the dot plots represent the percentage of cells of total CD45.2+ cells. (A) Representative FACS analysis of the gating strategy for IFNγ production in CD8+ T cells infiltrating SC tumors (left panels as depicted) and IK tumors (right panels as depicted). (B–E) Quantitative data of (B) the percentage of TCRβ+/CD8+ T cells of CD45.2+ cells, (c) the percentage of IFNγ+ cells of CD8+ T cells, (D) mean of fluorescence (MFI) for IFNγ on CD8+ T cells, (e) MFI for CD8 surface marker on CD8+ T cells. (n = 3 mice per group, one experiment). Statistical analyses were performed using Mann–Whitney test * P < 0.05, ** P < 0.005, **** P < 0.0001.
Figure 4. CD4+ T cells infiltrating intra-kidney (IK) tumors express more program cell death protein 1 (PD1) then in subcutaneous (SC) tumors. Mice were inoculated at day 0 with 2 × 10⁵ Renca Ch+ L+ SC or IK. CD4+ T cells and regulatory T cells (Treg) infiltrating tumors were analyzed at day 14, by flow cytometry, using anti-CD45.2, anti- TCRβ, anti-CD4, anti-CD25 and anti-Foxp3 antibodies (A and C) Representative FACS analysis and (B and D) quantitative data of percentage of (A and B) CD4+ T cells and (C and D) Treg infiltrating SC and IK tumors and expressing high level of PD1 (determined by the dashed gate-line). (A and C) The gray line histograms represent isotype control antibody staining, the black line histogram represents anti-PD-1 antibody staining. Numbers in the histograms represent the percentage of cells of total CD45.2+ cells. (B and D) (n = 3 mice per group, one experiment). Statistical analyses were performed using Mann–Whitney test *, P < 0.05, **, P < 0.005. (E and F) Day 14 Renca Ch+ L+ SC and IK in vivo tumors were analyzed, by flow cytometry, using the Cherry expression of the tumor cells and anti-CD45.2, anti-PD-L1 antibodies. (e) Representative histograms from FACS analysis and (F) quantitative data of the mean fluorescence intensity (MFI) of PD-L1 on the surface of the tumor cells. (E) The gray curve represents the isotype control and the black curve represents the anti-PD-L1 staining. (n = 2–3 mice per group, one experiment).
Treg-independent immune suppression in renal tumors is dominant
The above results indicated that kidney tumors were less immunoresponsive than SC tumors following Treg depletion. However, whether this reduced immunoresponsiveness of IK tumors was due to greater immunosuppression and/or reduced immune stimulation in the tumor microenvironment remained unclear. To determine the relative contribution of these two alternate mechanisms and to explore the involvement of T cells in the IK immune response, we first transferred immune splenocytes from Treg-depleted mice bearing SC tumors into mice bearing kidney tumors. There was no significant increase in survival of mice or decrease in IK tumor bioluminescent emission following transfer of 2 × 10⁷ () or 1.1 × 10⁸ () immune splenocytes into Treg-depleted mice compared to control mice. This suggests that a lack of immune stimulation was insufficient in itself to explain the decreased responsiveness of IK tumors to Treg depletion.
Figure 5. Splenocytes from Treg-depleted mice do not exert a strong antitumor immune response in Treg depleted intra-kidney (IK) tumor-bearing recipient mice. Donor mice were injected subcutaneous (SC) with 2 × 10⁵ Renca Ch+ L+ and depleted by anti-CD4 antibody injection at days 11, 12, 13. At day 20, donor mice-spleens were harvested and prepared splenocytes were transferred intravenously (IV), into IK tumor-bearing recipient mice at day 9. After receiving the splenocytes, the IK-tumor-bearing recipient mice were treated with three doses of an anti-CD4 antibody (αCD4) at days 11, 12, 13 or isotype control (Ctl). (A and C) Survival of IK tumor-bearing mice and (B and D) bioluminescence emission imaging of IK tumors from mice transferred with (A and B) 2 × 10⁷ or (C and D) 1.1 × 10⁸ splenocytes. Bioluminescent counts were analyzed from a region of interest applied around mice IK tumors. (A and B) n = 8 mice per group, one experiment. (C) n = 14–15 mice per group, two experiments pooled. (D) n = 8 mice per group, one experiment.
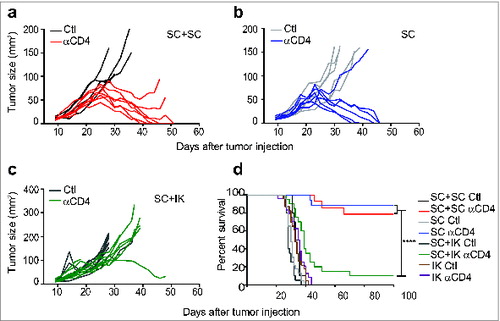
We next assessed whether an immunosuppressive response could remain in the IK tumors, following the Treg depletion, and if this IK immunosuppression could be sufficient to suppress a distant effector immune response. Toward this aim, we established cohorts of mice bearing either a SC tumor alone or both a SC and kidney tumor simultaneously. A cohort of mice bearing two SC tumors was also established to control for tumor burden. Whereas the majority of SC tumors regressed completely following Treg depletion in mice bearing one or two SC tumors (), the majority of SC tumors grew progressively when a kidney tumor was simultaneously present (). In addition to our observations of tumor growth rate, the dominant immunosuppressive effect of kidney tumors was also evident from the significant reduction in long-term survival of SC tumor-bearing mice when a kidney tumor was also present (). It is important to note in that in this experiment all mice were euthanized due to their SC tumors reaching the ethically defined limit, rather than due to their IK tumor disease. These results suggested that Treg-independent immunosuppression accompanied kidney tumors, which was strong enough to dominate the normally-responsive SC tumors.
Figure 6. Concomitant intra-kidney (IK) tumors inhibit the response of subcutaneous (SC) tumors to Treg depletion. Mice were injected at day 0 with 2 × 10⁵ Renca Ch+ Luc+ cells in one location: SC or IK, in both locations simultaneously (SC+IK) or two tumors SC (SC+SC). Anti-CD4 antibody (αCD4) or isotype control (Ctl) was administrated at days 11, 12, 13 after tumor inoculation. (A–C) Individual SC tumor growth followed using a caliper and size was calculated by multiplying the longest diameter by its perpendicular diameter. (D) Survival of mice bearing SC and IK tumors in one or two concomitant sites. (A–C) n = 4–9 mice per group, one representative experiment of 2. (D), n = 10–24, three experiments pooled. Statistical analyses of survivals were performed using Log-rank (Mantel–Cox) test **** P < 0.0001.
Discussion
In this study, we demonstrated that depleting Treg from orthotopic renal tumors is not sufficient to promote tumor rejection, while in contrast it could mediate the rejection of renal tumors implanted SC. We previously demonstrated that the tumoral microenvironment was sculpted by the tissue in which the tumor was evolving,Citation20 suggesting that in the present study the SC microenvironment favors a Treg-dependent immunoregulation. Furthermore, our findings support the idea that Treg are not the dominant immunosuppressive components of the kidney microenvironment as their depletion had no effect on growth of IK tumors. We demonstrated for the first time that anti-CD4 antibody is sufficient to eliminate pre-established SC tumors whereas other studies demonstrate the lack of efficacy of Treg-depleting antibodies on established SC tumors.Citation9,14 At this stage, we do not rule out that this result could be tumor model-, antibody-, and dose-dependent.
We observed that the tumor regression was associated with Treg depletion. Nonetheless, despite a comparable high efficiency of Treg depletion in both SC and IK tumors, neither anti-CD4 nor DT was sufficient to induce complete regression of kidney tumors. We obtained complete depletion of CD4+ cells, including Treg when anti-CD4 was used, while a low percentage of Treg was still present when DT was used. Different levels of penetration of tumors by antibody or DT and/or differing levels of expression of CD4 molecules and DT receptors on the surface of the Treg could explain this observation.
The use of DT in Foxp3DTR mice depletes Treg more specifically than the anti-CD4 antibody used in the wild-type mice. It provided a significantly longer survival to the IK tumor-bearing mice when compared with the anti-CD4 treatment. Important cells for antitumor immunity, such as CD4+ T helper cell subset,Citation22 have potentially been depleted in the IK tumors when anti-CD4 was used, preventing IK tumor rejection. Thus, CD4+ T helper cells are not crucial effector components of the antitumor immune response that occur in SC tumors, as their depletion still results in tumors being rejected.
Surprisingly, in our model, Treg depletion had no influence on the tumor-infiltration of various cell subsets including B cells, dendritic cells, macrophages and granulocytes as it has been previously observed in different tumor models.Citation23,24 However, it did impact on the percentage of activated CD8+ T cells infiltrating both SC and IK tumors. Treg can impede CD8+ T cell effector functionsCitation25,26 and their depletion restore a higher CD8+ activation and cytotoxic potential in SC tumors compared to IK tumors, in part explaining why SC tumors were rejected following a Treg depletion. This suggests that additional mechanisms of immunosuppression maintain a low effector response in IK tumors. It is known that PD-1 immunoregulatory molecule suppresses the antitumor activity of effector T cellsCitation27 while it can support the suppressive activity of TregCitation28 and indeed, we found PD-L1 expressed on the surface of the tumor cells and relatively higher expression of PD-1 on T cells in kidney tumors, providing support for additional immunosuppressive mechanisms in kidney tumors. PD-1 increased in CD4+ T cells and Treg from IK tumors. Furthermore, the transfer of splenocytes from Treg depleted-SC-responsive-tumor-bearing mice was not sufficient to reject IK tumors in Treg depleted recipients, suggesting that a strong Treg independent-immunosuppression remains in IK tumors and prevents effector T cells from eliminating tumors. However, at this stage, we cannot rule out that the antitumor potential of effector T cells remains the same in the spleen following Treg depletion, as Treg immunosuppressive functions may occur only at tumor site.Citation29 Furthermore, we did not assess whether significant numbers of transferred splenocytes reached the IK tumor site.
Interestingly, the immunosuppression that remains in IK tumors, following Treg depletion, was potent enough to impact negatively on distant SC tumors to prevent them from being eradicated. Further analyses need to be performed to assess the origin of the immunosuppression transfer from the IK tumors to the SC tumors. We already demonstrated, in a previous study, that type-2 immunosuppressive macrophages (M2) were crucial components of the tumoral microenvironment in the kidney and that they could largely impact on the outcome of the tumors.Citation20 In the previous study, we demonstrated that neutralization of the macrophage-attracting chemokine, CCL2, enhanced the efficacy of immunotherapy consisting of immune-agonist antibodies. It would be of interest in future studies to determine if administration of a CCL2-blocking antibody in combination with Treg depletion could render kidney tumors more responsive to immunity.
Treg are often considered as the main immunosuppressive components in many cancers, such as ovarian cancer.Citation30 Nevertheless, M2 macrophages are also believed to be key cells in the suppressive side of the immune response.Citation31 In the kidney tumor setting in particular, Treg do not seem to be the main tolerizing mechanism. Indeed, in Renca there is compelling evidence that M2 macrophages represent a major subset infiltrating the renal tumor microenvironment and are associated with poor prognosis in patients.Citation32 In Renca, they are thought to be attracted first, and to then subvert infiltrating T cells to promote their immunoregulatory functions at the expense of their antitumor cytotoxic functions.Citation33
The reasons for different tumor microenvironments in different tissues are not clearly defined. In some cases the tissue of implantation of metastasizing cells may influence the subsequent tumor microenvironment, as supported by previous reports using transplantable tumors in miceCitation20 Alternatively, evidence that tumor cells can shape their immune microenvironment suggests that differences between primary and metastasizing cells may contribute to differing tumor microenvironments.Citation34
In addition to the above points of discussion, it is worth considering contributions from other aspects of the tumor models to the observed differences in the impact of Treg. The kidney and SC sites differ morphologically. In contrast to the kidney, which is a highly vascularized encapsulated organ, the initiation of an immune response in the skin may differ in its reliance on draining lymph nodes and associated Treg. In addition, tumors in the kidney can metastasize to lung, whereas skin tumors do not. Although lung metastases are not macroscopically evident at the start of Treg depletion, it remains possible that lung disease could contribute to immunosuppression and the differential activity of Treg in kidney tumor-bearing mice.
Targeting Treg in the tumor microenvironment is a strategy well considered as a direct anticancer treatment or an approach to improve the efficacy of current therapy.Citation35 However, the importance of the Treg population among other immunosuppressive cell subsets has to be taken into consideration of the tumor type. In Renca in particular, depleting or inhibiting Treg might not be the most suitable strategy to adopt as other immunoregulator components, from the tumoral microenvironment, might play a greater role in helping the tumor to escape immunity.
Materials and Methods
Mice and cell lines
BALB/c and Foxp3DTR female mice were bred in the Peter MacCallum Cancer Centre animal facility. Following the Peter MacCallum Cancer Centre Animal Experimentation Ethics Committee guidelines, we utilized mice 6–20 weeks of age. The Renca cell line was generated from a BALB/c mouse renal cell carcinoma and the Renca cell line expressing cherry luciferase (Renca Ch+ L+) was generated as previously described.Citation20 Tumor cells were cultured at 37°C and 5% CO2 in RPMI 1640 (Invitrogen) supplemented with 10% heat-inactivated fetal calf serum (FCS) (Moregate Biotech), 2 mM glutamine (JRH Bioscience), 100 U/mL penicillin, 100 μg/mL streptomycin (all from Sigma-Aldrich).
In vivo tumor experiments
In order to establish solid tumors in mice, 2 × 10⁵ Renca or Renca Ch+ L+ cells were injected SC or IK as previously described.Citation20 For SC tumors, progression was measured using a caliper (measuring the longest diameter multiplied by its perpendicular diameter) and mice were euthanized when tumor size reached the ethically defined limit of 200 mm2. For IK tumors, luciferase-expressing tumors were monitored by in vivo bioluminescent imaging using a highly sensitive cooled charge-coupled device camera (IVIS Lumina II, Xenogen) and following an intra-peritoneal (IP) injection of 150 μg/mL of D-luciferin (Thermo Fisher Scientific). All IK tumor-bearing mice were culled when they presented overt signs of pain and stress in accordance with the ethical guidelines. For experiments involving two simultaneous tumors, mice were injected with 2 × 10⁵ Renca Ch+ L+ cells in two sites SC in each flank of the mice or SC and IK.
For CD4+ depletion, mice received three injections of 0.5 mg of anti-CD4 mAb (clone GK1.4, BioXcell) or isotype control antibody (clone MAC4, Rat IgG2A) on days 11, 12, 13 post tumor inoculation. Depletion in Foxp3DTR mice was performed by one injection of 0.5 μg of DT (Sigma Aldrich) on day 9 after tumor inoculation.
For splenocytes transfer experiments, IK tumor-bearing mice were depleted using anti-CD4 mAb and euthanized at day 20 post-tumor inoculation. Spleens were harvested and dissociated in phosphate-buffered saline (PBS). Splenocytes were then transferred intravenously (IV) in IK-tumor-bearing mice on day 10 post tumor inoculation.
Tumors and blood processing
SC or IK tumors were excised from mice and dissociated for 25 min in RPMI 1640 containing 1 mg/mL collagenase type 4 (Worthington Biochemical Corp), 30 units/mL DNase type II and 100 μg/mL hyaluronidase type V (both from Sigma Aldrich) at 37°C with gentle agitation. Blood was isolated through the portal vein immediately after euthanasia of tumor-bearing mice. An Ammonium-Chloride-Potassium (ACK) buffer erythrocyte lysis step was then performed.
Flow cytometry
For flow cytometric analysis, cells were resuspended in buffer (PBS with 2% FCS) in the presence of 2.4G2 (anti-CD16/32, to block Fc receptors) made in-house from tissue culture supernatant.
Cells were stained with anti-mouse CD45.2-FITC or APC-eF780 (clone 104), TCRβ-PerCP-Cy5.5 (clone H57–597), CD25-APC-eF780 or Pe-Cy7 (clone PC61.5), CD4-APC-eF780 or eF450 (clone RM4–5), CD279 (PD-1)-FITC (clone J43), CD274 (PD-L1)-PE (clone M1H5) (all from eBioscience) and CD8-BV711 (clone 53–6.7) (Biosearch). Intracellular staining was performed using Foxp3 transcription factor staining buffer kit (eBioscience) following the manufacturer's instructions. The antibodies anti-mouse Foxp3 APC-coupled (clone FJK-16S) and IFNγ-PE (clone XMG1.2), (both from eBioscience) or isotype controls (Rat IgG2A, clone eBr2A and Rat IgG1, clone eBRG1 both from eBioscience) were used for intracellular staining. For IFNγ staining, prior to intracellular staining, dissociated cells from tumors were stimulated for 3 hours in RPMI complete media with 1 mg/mL of phorbol 12-myristate 13-acetate (PMA), 1 μg/mL ionomycin (Sigma Aldrich), and 1 μl/mL of GolgiPlugTM (BD Bioscience, Sydney, Australia). Cells were analyzed and sorted on BD FACS CantoII (BD Bioscience). Analyses were performed using the software program Gatelogic308 (eBioscience).
Statistical Analysis
Results are expressed as the mean ± standard error of the mean (SEM). The variation in tumor growth experiments were analyzed by two-way ANOVA test. The differences between survival were analyzed using Log-rank (Mantel-Cox) test. Other experiments were analyzed using a Mann–Whitney test, and P < 0.05 considered significant.
Supplemental Material
Supplemental data for this article can be accessed on the publisher's website.
963395_Supplementary_Materials.zip
Download Zip (52.5 KB)Funding
This work was supported by funding from the Cancer Council of Victoria and the National Health and Medical Research Council of Australia (NHMRC). MHK and PKD were supported by Senior Research Fellowships from the NHMRC. MJS and MWLT were supported by a NHMRC Australia Fellowship and a Career Development Award respectively.
References
- Gershon RK, Kondo K. Infectious immunological tolerance. Immunology 1971; 21:903-14; PMID:4943147
- Fontenot JD, Rasmussen JP, Williams LM, Dooley JL, Farr AG, Rudensky AY. Regulatory T cell lineage specification by the forkhead transcription factor foxp3. Immunity 2005; 22:329-41; PMID:15780990; http://dx.doi.org/10.1016/j.immuni.2005.01.016
- Malek TR, Yu A, Vincek V, Scibelli P, Kong L. CD4 regulatory T cells prevent lethal autoimmunity in IL-2Rbeta-deficient mice. Implications for the nonredundant function of IL-2. Immunity 2002; 17:167-78; PMID:12196288; http://dx.doi.org/10.1016/S1074-7613(02)00367-9
- Sakaguchi S, Yamaguchi T, Nomura T, Ono M. Regulatory T cells and immune tolerance. Cell 2008; 133:775-87; PMID:18510923; http://dx.doi.org/10.1016/j.cell.2008.05.009
- Berendt MJ, North RJ. T-cell-mediated suppression of anti-tumor immunity. An explanation for progressive growth of an immunogenic tumor. J Exp Med 1980; 151:69-80; PMID:6444236; http://dx.doi.org/10.1084/jem.151.1.69
- Nishikawa H, Sakaguchi S. Regulatory T cells in tumor immunity. Int J Cancer J Int Du Cancer 2010; 127:759-67; PMID:20518016
- Vesely MD, Kershaw MH, Schreiber RD, Smyth MJ. Natural innate and adaptive immunity to cancer. Ann Rev Immunol 2011; 29:235-71; PMID:21219185; http://dx.doi.org/10.1146/annurev-immunol-031210-101324
- Choi BK, Kim YH, Kang WJ, Lee SK, Kim KH, Shin SM, Yokoyama WM, Kim TY, Kwon BS. Mechanisms involved in synergistic anticancer immunity of anti-4-1BB and anti-CD4 therapy. Cancer Res 2007; 67:8891-9; PMID:17875731; http://dx.doi.org/10.1158/0008-5472.CAN-07-1056
- Golgher D, Jones E, Powrie F, Elliott T, Gallimore A. Depletion of CD25 +regulatory cells uncovers immune responses to shared murine tumor rejection antigens. Eur J Immunol 2002; 32:3267-75; PMID:12555672; http://dx.doi.org/10.1002/1521-4141(200211)32:11%3c3267::AID-IMMU3267%3e3.0.CO;2-1
- Onizuka S, Tawara I, Shimizu J, Sakaguchi S, Fujita T, Nakayama E. Tumor rejection by in vivo administration of anti-CD25 (interleukin-2 receptor alpha) monoclonal antibody. Cancer Res 1999; 59:3128-33; PMID:10397255
- Yamaguchi T, Hirota K, Nagahama K, Ohkawa K, Takahashi T, Nomura T, Sakaguchi S. Control of immune responses by antigen-specific regulatory T cells expressing the folate receptor. Immunity 2007; 27:145-59; PMID:17613255; http://dx.doi.org/10.1016/j.immuni.2007.04.017
- Yu P, Lee Y, Liu W, Krausz T, Chong A, Schreiber H, Schreiber H, Fu YX. Intratumor depletion of CD4+ cells unmasks tumor immunogenicity leading to the rejection of late-stage tumors. J Exp Med 2005; 201:779-91; PMID:15753211; http://dx.doi.org/10.1084/jem.20041684
- Ko K, Yamazaki S, Nakamura K, Nishioka T, Hirota K, Yamaguchi T, Shimizu J, Nomura T, Chiba T, Sakaguchi S. Treatment of advanced tumors with agonistic anti-GITR mAb and its effects on tumor-infiltrating Foxp3+CD25+CD4+ regulatory T cells. J Exp Med 2005; 202:885-91; PMID:16186187; http://dx.doi.org/10.1084/jem.20050940
- Teng MW, Swann JB, von Scheidt B, Sharkey J, Zerafa N, McLaughlin N, Yamaguchi T, Sakaguchi S, Darcy PK, Smyth MJ. Multiple antitumor mechanisms downstream of prophylactic regulatory T-cell depletion. Cancer Res 2010; 70:2665-74; PMID:20332236; http://dx.doi.org/10.1158/0008-5472.CAN-09-1574
- Kim JM, Rasmussen JP, Rudensky AY. Regulatory T cells prevent catastrophic autoimmunity throughout the lifespan of mice. Nat Immunol 2007; 8:191-7; PMID:17136045; http://dx.doi.org/10.1038/ni1428
- Lahl K, Loddenkemper C, Drouin C, Freyer J, Arnason J, Eberl G, Hamann A, Wagner H, Huehn J, Sparwasser T. Selective depletion of Foxp3+ regulatory T cells induces a scurfy-like disease. J Exp Med 2007; 204:57-63; PMID:17200412; http://dx.doi.org/10.1084/jem.20061852
- Teng MW, Ngiow SF, von Scheidt B, McLaughlin N, Sparwasser T, Smyth MJ. Conditional regulatory T-cell depletion releases adaptive immunity preventing carcinogenesis and suppressing established tumor growth. Cancer Res 2010; 70:7800-9; PMID:20924111; http://dx.doi.org/10.1158/0008-5472.CAN-10-1681
- Sandin LC, Eriksson F, Ellmark P, Loskog AS, Totterman TH, Mangsbo SM. Local CTLA4 blockade effectively restrains experimental pancreatic adenocarcinoma growth in vivo. Oncoimmunology 2014; 3:e27614; PMID:24701377; http://dx.doi.org/10.4161/onci.27614
- Colombo MP, Piconese S. Regulatory-T-cell inhibition versus depletion: the right choice in cancer immunotherapy. Nat Rev Cancer 2007; 7:880-7; PMID:17957190; http://dx.doi.org/10.1038/nrc2250
- Devaud C, Westwood JA, John LB, Flynn JK, Paquet-Fifield S, Duong CP, Yong CS, Pegram HJ, Stacker SA, Achen MG et al. Tissues in different anatomical sites can sculpt and vary the tumor microenvironment to affect responses to therapy. Mol Ther: J Am Soc Gene Ther 2014; 22:18-27; PMID:24048441; http://dx.doi.org/10.1038/mt.2013.219
- Viola A, Salio M, Tuosto L, Linkert S, Acuto O, Lanzavecchia A. Quantitative contribution of CD4 and CD8 to T cell antigen receptor serial triggering. J Exp Med 1997; 186:1775-9; PMID:9362538; http://dx.doi.org/10.1084/jem.186.10.1775
- Kennedy R, Celis E. Multiple roles for CD4+ T cells in anti-tumor immune responses. Immunol Rev 2008; 222:129-44; PMID:18363998; http://dx.doi.org/10.1111/j.1600-065X.2008.00616.x
- Maes W, Verschuere T, Van Hoylandt A, Boon L, Van Gool S. Depletion of regulatory T cells in a mouse experimental glioma model through anti-CD25 treatment results in the infiltration of non-immunosuppressive myeloid cells in the brain. Clin Dev Immunol 2013; 2013:952469; PMID:23710206; http://dx.doi.org/10.1155/2013/952469
- Zhou S, Tao H, Zhen Z, Chen H, Chen G, Yang Y. Depletion of CD4+ CD25+ regulatory T cells promotes CCL21-mediated antitumor immunity. PloS One 2013; 8:e73952; PMID:24023916; http://dx.doi.org/10.1371/journal.pone.0073952
- Ertelt JM, Rowe JH, Mysz MA, Singh C, Roychowdhury M, Aguilera MN, Way SS. Foxp3+ regulatory T cells impede the priming of protective CD8+ T cells. J Immunol 2011; 187:2569-77; PMID:21810602; http://dx.doi.org/10.4049/jimmunol.1100374
- Murakami M, Sakamoto A, Bender J, Kappler J, Marrack P. CD25+CD4+ T cells contribute to the control of memory CD8+ T cells. Proc Nat Acad Sci U S A 2002; 99:8832-7; PMID:12084927; http://dx.doi.org/10.1073/pnas.132254399
- Kamphorst AO, Ahmed R. Manipulating the PD-1 pathway to improve immunity. Curr Opin Immunol 2013; 25:381-8; PMID:23582509; http://dx.doi.org/10.1016/j.coi.2013.03.003
- Francisco LM, Sage PT, Sharpe AH. The PD-1 pathway in tolerance and autoimmunity. Immunol Rev 2010; 236:219-42; PMID:20636820; http://dx.doi.org/10.1111/j.1600-065X.2010.00923.x
- Zou W. Immunosuppressive networks in the tumour environment and their therapeutic relevance. Nat Rev Cancer 2005; 5:263-74; PMID:15776005; http://dx.doi.org/10.1038/nrc1586
- Curiel TJ, Coukos G, Zou L, Alvarez X, Cheng P, Mottram P, Evdemon-Hogan M, Conejo-Garcia JR, Zhang L, Burow M et al. Specific recruitment of regulatory T cells in ovarian carcinoma fosters immune privilege and predicts reduced survival. Nat Med 2004; 10:942-9; PMID:15322536; http://dx.doi.org/10.1038/nm1093
- Sica A, Schioppa T, Mantovani A, Allavena P. Tumour-associated macrophages are a distinct M2 polarised population promoting tumour progression: potential targets of anti-cancer therapy. Eur J Cancer 2006; 42:717-27; PMID:16520032; http://dx.doi.org/10.1016/j.ejca.2006.01.003
- Santoni M, Massari F, Amantini C, Nabissi M, Maines F, Burattini L, Berardi R, Santoni G, Montironi R, Tortora G et al. Emerging role of tumor-associated macrophages as therapeutic targets in patients with metastatic renal cell carcinoma. Cancer Immunol, Immunother: CII 2013; 62:1757-68; PMID:24132754; http://dx.doi.org/10.1007/s00262-013-1487-6
- Dannenmann SR, Thielicke J, Stockli M, Matter C, von Boehmer L, Cecconi V, Hermanns T, Hefermehl L, Schraml P, Moch H et al. Tumor-associated macrophages subvert T-cell function and correlate with reduced survival in clear cell renal cell carcinoma. Oncoimmunology 2013; 2:e23562; PMID:23687622; http://dx.doi.org/10.4161/onci.23562
- Remark R, Alifano M, Cremer I, Lupo A, Dieu-Nosjean MC, Riquet M, Crozet L, Ouakrim H, Goc J, Cazes A et al. Characteristics and clinical impacts of the immune environments in colorectal and renal cell carcinoma lung metastases: influence of tumor origin. Clin Cancer Res: Off J Am Assoc Cancer Res 2013; 19:4079-91; PMID:23785047; http://dx.doi.org/10.1158/1078-0432.CCR-12-3847
- Devaud C, John LB, Westwood JA, Darcy PK, Kershaw MH. Immune modulation of the tumor microenvironment for enhancing cancer immunotherapy. Oncoimmunology 2013; 2:e25961; PMID:24083084; http://dx.doi.org/10.4161/onci.25961