
 ?Mathematical formulae have been encoded as MathML and are displayed in this HTML version using MathJax in order to improve their display. Uncheck the box to turn MathJax off. This feature requires Javascript. Click on a formula to zoom.
Abstract
Immune responses play a critical role in various disease conditions including cancer and autoimmune diseases. However, to date, there has not been a rapid, sensitive, comprehensive, and quantitative analysis method to examine T-cell or B-cell immune responses. Here, we report a new approach to characterize T cell receptor (TCR) repertoire by sequencing millions of cDNA of TCR α and β chains in combination with a newly-developed algorithm. Using samples from lung cancer patients treated with cancer peptide vaccines as a model, we demonstrate that detailed information of the V-(D)-J combination along with complementary determining region 3 (CDR3) sequences can be determined. We identified extensive abnormal splicing of TCR transcripts in lung cancer samples, indicating the dysfunctional splicing machinery in T lymphocytes by prior chemotherapy. In addition, we found three potentially novel TCR exons that have not been described previously in the reference genome. This newly developed TCR NGS platform can be applied to better understand immune responses in many disease areas including immune disorders, allergies, and organ transplantations.
Abbreviations:
- APC, antigen presenting cell
- CDCA1, cell division cycle-associated protein 1
- CDR3, complementary determining region 3
- CTLA-4, cytotoxic T-lymphocyte antigen-4
- CTL, cytotoxic T lymphocytes
- ELISPOT, enzyme-linked immunospot
- FDA, Food and Drug Administration
- IFA, incomplete Freund's adjuvant
- IFNγ, γ-interferon
- IRB, institutional review board
- KIF20A, kinesin family member 20A
- LY6K, lymphocyte antigen 6 complex locus K
- MHC, major histocompatibility complex
- NGS, Next Generation Sequencing
- NSCLC, non-small cell lung cancer
- ORF, Open reading frames
- OS, overall survival
- PBL, peripheral blood lymphocyte
- PGM, Personal Genome Machine
- RACE, rapid amplification of cDNA end
- TCR, T cell receptor
Introduction
In the last two decades, a large number of investigations have been directed to the development of cancer immunotherapy, and major cancer immunotherapy strategies include cancer vaccines inducing cytotoxic T cells, antibodies that block immune checkpoints, and adoptive transfer of ex vivo activated engineered T cells.Citation1,2 For example, Provenge (sipuleucel-T), the first therapeutic cancer vaccine, was approved by the US Food and Drug Administration (FDA) in 2010 for metastatic castration-resistant prostate cancer patients.Citation3 Ipilimumab, the monoclonal blocking antibody for cytotoxic T-lymphocyte antigen-4 (CTLA-4) was approved by US. FDA for the treatment of metastatic melanoma as the first immune checkpoint blockage agent in cancer.Citation4
During the course of immunotherapy, it is critically important to monitor the immune responses in cancer patients. Such information is essential to better understand the mechanism of action of the cancer immunotherapy and it also can serve as a predictive biomarker for patients’ responses to the treatment. For example, when patients are treated with short peptide-based cancer vaccines, two classical immunoassays, an enzyme-linked immunospot (ELISPOT) assay and an HLA-multimer assay, are currently used to measure cytotoxic T lymphocytes (CTL) responses. However, both assays require an ex vivo expansion step of the peripheral blood lymphocytes (PBLs) using antigen stimulation, which prevents them to become timely and quantitative measurements of T cell profiling for patients’ immune responses. Therefore, a fast, sensitive, and quantitative method to obtain comprehensive information about the immune cells, especially T lymphocytes, is emergently needed.
TCRs, which are highly variable cell membrane proteins that recognize antigen peptides presented on the major histocompatibility complex (MHC) molecules,Citation5 are known as the signature of each T lymphocyte. A systematic and comprehensive analysis of the TCR transcripts can provide enormous information about the T cell repertoire for a rapid measurement of the T cell response.
The majority (∼95%) of T lymphocytes in human carry TCR consisting of a heterodimer of an α-chain and a β-chain. The diversity of TCRs is generated by a somatic recombination process of variable (V), diversity (D) (for β chain), and joining (J) exons, termed the V(D)J recombination. Random trimming and/or addition of non-template nucleotides at the junction site significantly increase the TCR diversity further. The rearrangement of V, (D), and J segments generates the high variable CDR3, which is critical for defining the specificity of each particular T cell clone for antigen recognition.Citation6 Theoretically, a repertoire of approximately 1018 different TCRs could be generated in human.
With the advent of next generation sequencing (NGS), it has become possible to characterize millions of TCR cDNAs in a single experiment.Citation7–Citation9 In this study, we have applied the Ion Torrent Personal Genome Machine (PGM) technology with the newly developed 400-bp sequencing chemistry to investigate the extensive profiling of TCR cDNAs of peripheral T lymphocytes. We have analyzed samples from non-small cell lung cancer (NSCLC) patients who have been treated with cancer peptide vaccines as a model case.
Results
Establishment of TCR sequencing platform by Ion Torrent PGM
To develop our TCR sequencing platform, we first isolated CD8+ T lymphocytes from the peripheral blood (∼10mL) from one healthy donor (ID 001). cDNA was then synthesized from total RNA isolated from CD8+ T lymphocytes by 5′ rapid amplification of cDNA end (5′RACE) PCR method.Citation8 5′-RACE PCR allowed us to amplify TCR α and β cDNAs using a single primer pair, with the forward primer designed on the common adaptor sequence added to the 5′ end of cDNA and the reverse primer designed on the constant region. “Fusion PCR” was further applied to prepare sequencing amplicons by adding sequencing adapters P1 and A to the 5′ end of V regions and 3′ end of C regions of TCR cDNAs, respectively. Next, deep sequencing of both TCR α and β chains was performed using Ion Torrent PGM coupled with a 400-bp sequencing kit.
Approximately, 500,000–1,000,000 sequencing reads with a mean read length of ∼200 bp were obtained in each run using the Ion 314v2 chips in both α and β chains (one representative run report shown in Fig. S1a). Subsequently, each of the sequencing reads was analyzed by the novel algorithm of “V(D)J decomposition with soft-clipping” developed by our group. We first tested the sequencing quality by calculating the mapping percentages of TRA reads > 120 bp and TRB reads of > 150 bp because the long reads were more likely to contain mappable V segments. As a result, almost all the long reads could be mapped to C and J regions; 96.7% TRA reads of > 120bp and 86.2% TRB reads of > 150 bp were identified to contain V regions (). After the sequencing quality verification, all the sequencing reads, including the shorter reads (TRA < 120 bp and TRB < 150 bp), were analyzed. Overall, 361,798 TRA reads and 272,256 TRB reads were confirmed to include the V(D)J combination.
Figure 1. Mapping patterns of T cell receptor (TCR) cDNA sequences from the CD8+ T lymphocytes of a healthy donor ID001. Deep sequencing of cDNA of TCR α chains (TRA) and β chains (TRB) from ID001 was performed by using Ion Torrent PGM with the 400-bp sequencing kit, and the sequencing reads were analyzed by our novel algorithm of ‘V(D)J decomposition with soft-clipping’. (a) Mapping percentages of constant (C) regions, joint (J) regions, and variable (V) regions in TRA reads > 120bp and TRB reads > 150bp. VdelNum = number of nucleotide deleted in V segment; JdelNum = number of nucleotide deleted in J segment; N = the nucleotides added during VJ rearrangement; N1 = the nucleotides added between VD rearrangement; * in the D indicates the deleted nucleotides during rearrangement; N2 = the nucleotides added between DJ rearrangement. (b) The top 10 TCR V(D)J identified clones of TRA reads (upper panel) and TRB reads (lower panel). (c) The top 10 TCR complementary determining region 3 (CDR3) clones of TRA reads (upper panel) and TRB reads (lower panel). (d) TCR CDR3 length distribution patterns of TRA reads (blue) and TRB reads (red). The x-axis represented the CDR3 length in nucleotide (nt) and the y-axis represented the percentage of each CDR3 length group in all the in-frame CDR3 identified reads without a stop codon.
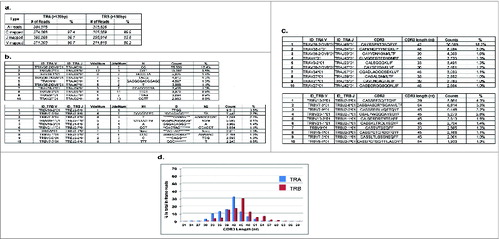
Our mapping algorithm also allowed us to identify the deleted and inserted nucleotides at the rearranged V-(D)-J junctions. For TRA, 17,207 distinct V-N-J combinations were identified in a total of 361,796 mapped reads (TRA VJ inverse Simpson's index = 36.9); in TRB, 28,714 distinct TRB V-N1-D-N2-J combinations were found in a total of 272,256 mapped reads (TRB VDJ inverse Simpson's index = 206.7). The top 10 clones in each group were listed as examples in (upper panel for TRA and lower panel for TRB). Using this information, CDR3 sequences were subsequently determined based on the international ImMunoGeneTics information system (IMGT®) clonotype definitionCitation10,11 using our algorithm. After excluding the out-of-frame sequences as well as the in-frame ones with a stop codon, 10,999 (in 277,680 TRA CDR3 reads; inverse Simpson's index = 27.4) and 15,019 (in 203,144 TRB CDR3 reads; inverse Simpson's index = 145.7) unique CDR3 clonotypes were identified in TRA and TRB, respectively. The top 10 CDR3 clonotypes of each group were listed as examples in (upper panel for TRA and lower panel for TRB).
As another measurement of TCR repertoire diversity or clonality, TCR CDR3 length distribution was also presented.Citation12 A Gaussian CDR3 length distribution pattern was observed for both TRA and TRB reads, suggesting the diverse and well-distributed TCR repertoire populations in healthy donor ID 001 ().
TCR sequencing on peripheral blood lymphocytes from NSCLC patients treated with cancer peptide vaccines
After establishing our TCR sequencing platform, we then applied this platform for TCR repertoire deep sequencing of the PBLs obtained from five NSCLC patients who had been treated with a mixture of three cancer peptide vaccines. These vaccines were derived from three oncoantigens, URLC10 (also known as LY6K, lymphocyte antigen 6 complex locus K), CDCA1 (cell division cycle-associated protein 1), and KIF20A (kinesin family member 20A).Citation13,14 Patients’ clinical characteristics and outcome are listed in . Among these five patients, strong CTL responses were detected in patients #1, #3, and #5 by ELISPOT assay along with the ex vivo peptide stimulation, and these patients showed good clinical outcome with prolonged overall survival (OS; average OS = 909 ± 278 days). On the other hand, patients #2 and #4, who had showed little CTL induction against these peptides, had shorter overall survival (133 ± 40 days; p = 0.033 by Student's t-test).
Table 1. Clinical characteristics, outcomes, and CTL responses of five NSCLC patients
We first performed TRA deep sequencing on a total of 15 PBL samples (multiple samples at different time points from each patient) using the Ion 314v2 chips. Overall, the average number of TRA sequencing reads of > 120 bp was 449,916 (range: 238,726–631,223) and the average percentage of reads that were defined to contain V exons was 58.2% (, left panel). Considering the higher complexity of TCR β chains, TRB sequencing was conducted using larger capacity sequencing chips (Ion 318v2 chips). About 4–9 million sequencing reads were obtained for each run with the mean read length of ∼200bp. One representative run report was shown in supplementary Fig. S1b. The average number of TRB sequencing reads of > 150 bp was 2,841,794 (range: 1,480,111–4,350,316), and the average percentage of the V(D)JC mapped reads was 18.8% (, right panel). Unexpectedly, the sequence reads that were assigned to have TRB V exons from the patients’ samples was much lower than the result from the health donor (ID001).
Table 2. TCR mapping patterns for NSCLC patients' samples
We then quantitatively characterized the distinct V(D)J and CDR3 clones from the mapped reads. In patient #1, the top 10 V(D)J clones showing the largest differences in frequencies between two time points – before treatment (1–1) and after two cycles of vaccination (1–3) – were listed (). Open reading frames (ORFs) were found in most of the V(D)J reads, thus, corresponding CDR3 clones were identified (). In TRA, one clone of V8–6*01, J45*01, CDR3 = ‘CAVSESGGGADGLTF’ was significantly enriched after 2 cycles of vaccination (9.8% in the1–3 sample, 0.1% in the 1–2 sample, and none in the 1–1 sample). Similarly, in TRB, one clone of V7–8*01, J2–4*01, CDR3 = ‘CASSSLQNIQYF’ was significantly enriched after 2 cycles of vaccination (8.1% in the 1–3 sample, 2.0% in the 1–2 sample, and 1.3% in the 1–1 sample).For the other patients, only the top 5 most enriched clones between the start of treatment and the last course of treatment were shown in , and ORFs were observed in most of these enriched V(D)J clones.
Figure 2. Quantitative characterization of the most enriched T cell receptor (TCR) clones after cancer therapeutic vaccine treatment in non-small cell lung cancer patient #1. (a) The top 10 V(D)J clones of TRA reads (left panel) and TRB reads (right panel) showing the biggest differences in frequencies between two time points – before treatment (1–1) and after two cycles of vaccination (1–3). (b) The top 10 complementary determining region 3 (CDR3) clones of TRA reads (left panel) and TRB reads (right panel) showing the biggest differences in frequencies between two time points - before treatment (1–1) and after two cycles of vaccination (1–3). NumVdel = number of nucleotide deleted in V segment; NumJdel = number of nucleotide deleted in J segment; Nseq = the nucleotides added between VJ rearrangement; N1 = the nucleotides added between V-D segments; * in the Dseq indicated the deleted nucleotides; N2 = the nucleotides added between D–J segment.
Figure 3. Quantitative characterization of the most enriched T cell receptor (TCR) clones after cancer therapeutic vaccine treatment in non-small cell lung cancer patients #2, #3, #4, and #5. (a) The top five enriched V(D)J and the complementary determining region 3 (CDR3) clones in patient #2 showing the biggest differences in frequencies between two time points – before treatment (2–1) and after two cycles of vaccination (2–3) for TRA (upper panel) and TRB (lower panel). (b) The top five enriched V(D)J and CDR3 clones in patient #3 showing the biggest differences in frequencies between two time points - before treatment (3–1) and after two cycles of vaccination (3–3) for TRA (upper panel) and TRB (lower panel). (c) The top five enriched V(D)J and CDR3 clones in patient #4 showing the biggest differences in frequencies between two time points – before treatment (4–1) and after one cycle of vaccination (4–2) for TRA (upper panel) and TRB (lower panel). (d) The top five enriched V(D)J and CDR3 clones in patient #5 showing the biggest differences in frequencies between two time points – before treatment (5–1) and after three cycles of vaccination (5–4) for TRA (upper panel) and TRB (lower panel). NumVdel = number of nucleotide deleted in V segment; NumJdel = number of nucleotide deleted in J segment; Nseq = the nucleotides added between V–J segments; N1seq = the nucleotides added between V–D segments; * in the Dseq indicated the deleted nucleotides during rearrangement; N2seq = the nucleotides added between D–J segments.
Furthermore, we have also characterized the TCR clonal diversity by calculating the inverse Simpson's index for these samples (). Compared to the normal donor sample ID001, the majority of the patients’ samples before vaccine treatment revealed lower diversity. Interestingly, in samples from patients #1, #3, and #5, who showed the high CTL induction with better OS, an increase in the diversity was observed after the vaccine treatment, except in the case of the TRA of patient #3. On the other hand, lower diversity was maintained in the samples from patients #2 and #4, who had poor immune responses against vaccine treatment with shorter OS.
Figure 4. The T cell receptor (TCR) clonal diversity in a healthy donor ID001 and five non-small cell lung cancer (NSCLC) patients who had been treated with cancer therapeutic vaccines. The inverse Simpson's indexes of V(D)J clones (upper panel) and the complementary determining region 3 (CDR 3) clones (lower panels) were calculated as a measurement for TCR clonal diversity (O = TRA, ▴= TRB).
Similarly, non-Gaussian distribution patterns of the CDR3 length were observed in all of samples before vaccine treatment, indicating the biased TCR repertoire with lower diversity. For example, in patient #1 before treatment (1–1), one dominant clone of ‘CAVGALPSGGYQKVTF’ (48nt, 56.7% of total in-frame CDR3 reads) was found in TRA and another dominant clone of ‘CSARLVGLKTKNSEQFF’ (51nt, 27.9% of total in-frame CDR3 reads) was found in TRB (). After the vaccine treatment, TCR repertoire diversity increased showing less biased or more normal Gaussian distribution patterns of CDR3 length in patients #1, 3, and 5 ( , , and ). However, this pattern was not observed in patients #2 or 4 ( and ).
Figure 5. The T cell receptor (TCR) complementary determining region 3 (CDR3) length distribution patterns in five non-small cell lung cancer (NSCLC) patients who had been treated with cancer therapeutic vaccines. The x-axis represented the CDR3 length in nucleotide (nt) and the y-axis represented the percentage of each CDR3 length group in all the in-frame CDR3 identified reads without a stop codon (TRA groups in blue and TRB groups in red). TCR CDR3 length distribution patterns in patient #1 (a), patient #2 (b), patient #3 (c), patient #4 (d), and patient #5 (e) were presented.
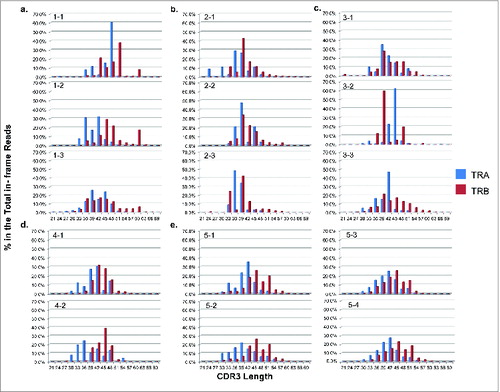
Thus, our algorithm allowed us to detect and monitor every single clonotype (V(D)J or CDR3) quantitatively during treatment. In the patients’ samples, we observed an increased TCR clonotype diversity with a more normal Gaussian distribution of the CDR3 length after vaccine treatment in patients showing better immune response but not in those patients showing poor immune response.
Analysis of TRB unmapped reads
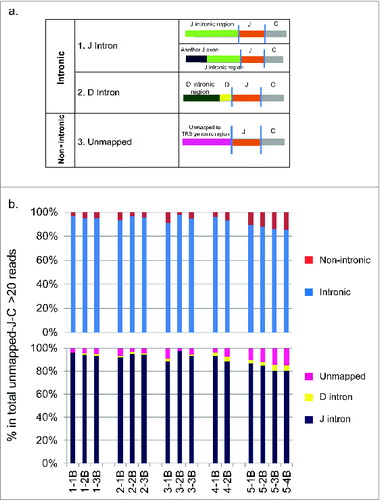
Since the proportion of TRB reads that were found to contain V exons was much lower in the NSCLC patients than in the healthy donor sample, we performed a detailed analysis on the sequence reads containing J and C segments but not V segments. We extracted those reads and termed them as ‘unmapped-J-C reads’. On average, 61.0% of the total TRB sequencing reads were ‘unmapped-J-C reads’ (Supplementary ). Among them, we then selected reads with unmapped part of at least 20bp (known as ‘unmapped-J-C >20bp reads’) and attempted to assign them to the TCR genomic reference sequence. As a result, we were able to classify them into 2 major mapping groups, an intronic group and a non-intronic group (). In the intronic group, the unmapped region contained either an intronic region adjacent to the J segment (subgroup 1: J Intron), some of which contained a 3′ end of a further upstream J segment, or an intronic region adjacent to the D segment (subgr-oup 2: D Intron). In the non-intronic group, the unmapped regions contained sequences mapped to non-TRB regions of human genome reference sequence (subgroup 3: Unmapped). Furthermore, the majority of these “unmapped-J-C” reads contained intronic regions, ranging from 85.3% in sample 5–4B to 97.5% in sample 3–2B (, upper panel), and J intron was the dominant subgroup (, lower panel). In the non-intronic group, subgroup 4 ‘Unmapped’ was the dominant subgroup (, lower panel).
Figure 6. The analysis of unmapped T cell receptor β chains (TRB) cDNA reads from five non-small cell lung cancer (NSCLC) patients who had been treated with cancer therapeutic vaccines. TRB reads containing identified J and C segments and the unmapped part of at least 20bp were extracted, termed as “unmapped-J-C > 20bp reads”, and then attempted to assign to the genomic reference sequences. (a) The classification of TRB unmapped-J–C > 20bp reads. Two major groups (a intronic group and a non-intronic group) and four subgroups (subgroup 1: J Intron, subgroup 2: D Intron, subgroup 3: Other reference, subgroup 4: Unmapped) were identified. (b) The proportions of individual groups in the total TRB unmapped-J-C > 20bp reads (two major groups in the upper panel; four subgroups in the lower panel).
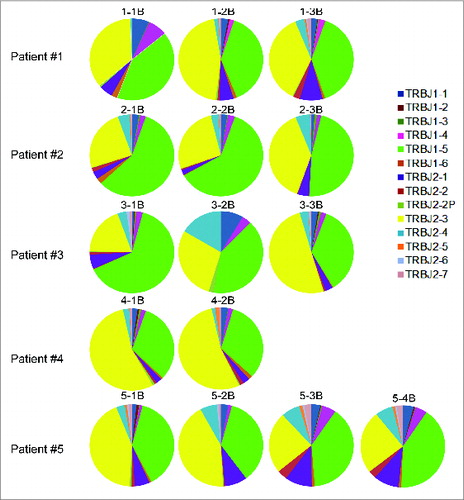
The abundance of intronic sequences, especially J intron, in the total ‘unmapped-V-J’ reads suggested the abnormal splicing machinery in these NSCLC patients’ samples. Interestingly, there was a strong bias in the usage of TRB J1–5 or J2–3 in those ‘unmapped-J-C reads’, which represented > 80% of the reads (). This observation indicated that abnormal splicing preferably targeted introns upstream of TRB J1–5 or J2–3 segments. Although we have confirmed the presence of transcripts with splicing between J-C exons, we are unable to exclude a possibility of abnormal gene rearrangement of TCR V-(D)-J exons.
Figure 7. The biased J segment usage in those unmapped T cell receptor β chains (TRB) cDNA reads from five non-small cell lung cancer (NSCLC) patients who had been treated with cancer therapeutic vaccines. Analysis was performed on the TRB reads containing identified J and C segments but not V segments, known as “unmapped-J–C reads”.
Discovery of potentially novel TCR V exons
We further explored the possibility that there were novel TCR V segments that were currently not deposited in the current reference database and have now validated 3 potentially novel exon candidates for TCR V segments.
The first candidate found in TRA sequences was likely to be a potentially novel exon generated by a 164-bp deletion in the central portion () of a known TRA V1–1 reference. This novel exon of TRA V1–1del was found to be present in multiple samples (T cell cDNA samples of 5–4, 1–3, and also the genomic DNA sample of ID001).
Figure 8. The structures of potentially novel T cell receptor (TCR) V segment exons. (a) A potentially novel TRA V1–1 exon. (b) A potentially novel TRB V7–6 exon. (c) A potentially novel TRB V19 exon.
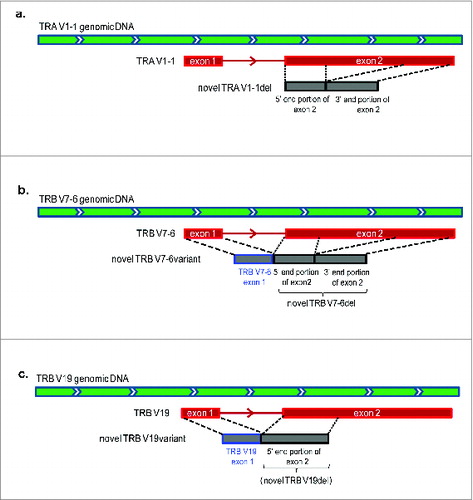
The other 2 potentially novel exons were found in the TRB gene. A potentially novel TRB V7–6del, as similar to the potentially novel TRA V1–1del described above, was generated by a 176-bp deletion in the central portion of TRB V7–6 exon 2 (known as the TRB V7–6 reference), which was found in the sequence reads in a sample of 4–1. We also confirmed the presence of TRB V7–6 exon 1 at the upstream region of potentially novel TRB V7–6del, consisting of the potentially novel TRB V7–6variant (). We found the translational start codon (ATG) at TRB V7–6 exon 1. Interestingly, ORFs of this potentially novel TRB V7–6variant and a previously reported TRB V7–6 reference are different.
We also found another potentially novel exon candidate, TRB V19del, generated by a 215-bp deletion at the 3′ end of TRB V19 exon 2 (known as the TRB V19 reference) in the sequence reads of samples of 1–2 and 1–3. As similar to TRB V7–6variant, we have found the presence of TRB V19 exon 1 at the upstream of TRB V19del () that creates different ORF from the reported V19 reference due to a start codon at TRB V19 exon 1. Since the deletion of 215 nucleotides during the rearrangement was very unlikely, we also considered this truncated form is a potentially non-reported novel exon. All the possible novel exons were validated by Sanger sequencing and the sequences were shown in supplementary Fig. S3.
Discussion
In this study, we have reported the establishment of a new method to comprehensively characterize the human TCR repertoire in a rapid and quantitative manner using the Ion Torrent next generation sequencer PGM, and illustrated the application of this platform for monitoring T cell immunological responses in patients treated with therapeutic cancer vaccines.
To our best knowledge, this is the first study applying the Ion Torrent NGS technology combined with 400-bp sequencing chemistry for the comprehensive TCR repertoire sequencing. The 400-bp sequencing chemistry provides significantly longer single-end reads that can cover the entire TCR V-(D)-J region including the rearranged junction sequences without the assembly of paired-ends sequencing reads. Compared to the previously reported Roche 454 platform for the same purpose,Citation15,16 which generated comparable read length data, our approach provides greater output which allows us to obtain millions of TCR sequences in a single run with the usage of 318 v2 chips.
In this study, we have applied the 5′RACE-PCR method to generate the cDNA library of TCR α or β using the single primer set. This method minimizes the PCR amplification bias when compared with the multiplex PCR amplification method in which the annealing efficiency of different PCR primers may cause uneven amplification.Citation17 In addition, our approach enables us to identify the unexpectedly abundant cDNA clones containing intronic sequences (probably due to aberrant splicing or rearrangement) and also to discover potentially novel exons that are not currently represented in the human genome reference database. One potential weakness of 5′ RACE PCR comes from its starting material, TCR mRNA, because TCR transcription levels may differ in individuals T cells and this may affect the quantitative analysis of the T cell repertoire. However, if higher TCR expression in each cell is associated with the higher affinity to cells expressing the antigen, our approach is able to measure the functional quantitation of T cells.
Almost all the previous TCR deep sequencing studies focused only on TCR β chain profiling due to the fact that only one TCR β-chain protein is expressed in mature T cells because of allelic exclusion.Citation18 However, both TCR α and β chains are required to form the TCR heterodimer for antigen recognition. Thus, we sequence both the TCR α and β repertoire in our study. Our results indicate that there are significant levels of insertion and deletion of nucleotides in the TRA VJ rearranged region, and on average more than 99.5% of the TRA reads are found to have an insertion and/or deletion in the samples we test (data not shown). This high diversity of the TCRα chain has added another layer of complexity that is important for detailed TCR repertoire characterization.
For data analysis, we have developed a novel algorithm of “V(D)J decomposition” in combination with a “remapping” step for unmapped part analysis to effectively analyze the cDNA sequencing data for both TCR α and β repertoires (see Fig. S2). Compared to the widely used online software IMGT/HighV-QUEST,Citation19 our algorithm has a much greater input capacity (up to millions per job) than IMGT/HighV-QUEST (up to 500,000 sequences per job), which is extremely critical for analyzing a high-volume NGS data. Moreover, compared to another publicly available TCR analysis software –MiTCR,Citation20 our algorithm provides similarly concordant CDR3 assignments. In addition to that, our algorithm can provide additional information such as unmapped sequence reads, which has enabled us to discover molecular changes of biological and genetic importance.
By applying this new TCR NGS platform and our novel algorithm, we were able to make some interesting observations. First, we have demonstrated the very high diversity of TCR populations. As expected, the insertion and deletion of nucleotides during recombination has generated hypervariability in both TCR α and β chains. As an example for patient sample 5–4B, there are more than 500 sequence variations in the single VDJ combination (data not shown). Although we cannot completely exclude the possibility of overestimation of the diversity due to sequencing errors, our method is capable of monitoring the expansion of certain T cell populations quantitatively.
In the three patients (patients #1, #3, and #5) showing effective induction of immune responses with the vaccine treatment, we observed a significant increase of the TCR diversity during the course of the treatment, but this tendency was not observed in the two patients showing poor immune response (patients #2 and #4). This phenomenon may be explained by the activation of various T cell populations as the secondary response. When cancer cells are damaged by peptide-specific CTLs, they are likely to be phagocytosed by antigen presenting cells (APCs), which present various cancer antigens on their cell surface and eventually induce the secondary immune responses. This interesting finding of the increased TCR diversity in PBLs after therapeutic cancer vaccine treatment might also serve as a surrogate predictive biomarker for better responses toward the treatment. If so, the TCR diversity score might also be applied to monitoring the immune response in patients who are treated with other immunotherapies, such as antibodies against immune checkpoint molecules.
Secondly, we have observed a relatively large proportion of TRB reads containing intronic regions in the patients’ samples but not in the healthy donor's sample. We cannot exclude the possibility of PCR bias because smaller fragments are more likely to be amplified effectively during PCR, but our Sanger sequencing results of the original cDNAs clearly indicated they were not the PCR artifacts. In these intron-containing cDNA sequences, introns between the J–C segments are correctly spliced out. Hence, the contamination of the genomic DNA is very unlikely. Since those patients have received intensive chemotherapies (2–4 different regimens, supplementary Table S2) before they were enrolled into the cancer vaccine clinical trial, we hypothesize that their T lymphocytes have been severely damaged by the chemotherapy, which in turn caused the impairment in their slicing machinery or the gene rearrangement of TCR V-(D)-J segments. From our data, the intronic sequences of specific introns located upstream of TRB J1–5 or J2–3 exons are likely to be preferentially affected.
Thirdly, we have discovered three potentially novel TCR V exons, one for TRA – a deleted version of TRA V1–1 (potentially novel TRA V1–1del), and two for TRB (potentially novel TRB V19del and potentially novel TRBV7–6del). The presence of these potentially novel exons in multiple samples supports the hypothesis that the immune associated genes are highly diverse among populations and these complex genomic sequences are not fully represented in the current human genomic reference database. A detailed analysis of these unmapped reads is necessary to further address this important question.
However, there are some limitations to this work. Due to the small number of samples tested, we are unable to separate the sub-populations of T cells such as CD8+, CD4+CD25-, and CD4+CD25+Foxp3+T cells. Thus, we cannot yet define the exact TCR profiling of distinct classified T cell populations observed in the cancer vaccine treated patients. However, it is certain that our approach is applicable after separation of the subtypes of T cells and we plan to examine the TCR profiling with different classes of T lymphocytes in future studies. Additionally, although we have found some positive correlation between increased TCR diversity and better clinical outcome in vaccine-treated patients, the significance of this finding is limited by a small number of patients analyzed. Lastly, functional studies are required in the future to validate the biological functions of enriched TCRs from our NGS data.
In summary, we have developed a new high throughput TCR analysis system using the NGS platform coupled with a novel algorithm, which has allowed us to obtain the comprehensive T cell repertoire data. This datum includes not only the CDR3 information of TCR α and β transcripts but also the information on the “unmapped reads”. This methodology enables us to provide a detailed characterization of immune responses in patients who receive various types of cancer immunotherapies. In addition, this approach can also be applied to the analysis of T cell immune responses in other diseases including but not limited to drug-induced skin and liver hypersensitivity, autoimmune diseases, food allergy, and rejections after organ transplantation. Thus, the TCR NGS sequencing platform report on here should provide us with a better understanding of the pathogenesis of various diseases.
Materials and Methods
Therapeutic cancer vaccines and patients
We had previously identified three HLA-A*2402-restricted epitope peptides derived from three cancer-testis antigens that are up-regulated lung cancer, including URLC10, which is also known as lymphocyte antigen 6 complex locus K (LY6K),Citation13 cell division cycle-associated protein 1(CDCA1),Citation14 and kinesin family member 20A (KIF20A). HLA-A*2402-positive advanced NSCLC patients who had failed standard therapy were enrolled in the Phase I study of peptide cancer vaccine therapy (ClinicalTrial.gov identifier: NCT01069575) using peptides derived from these three novel cancer-testis antigens mentioned above.Citation21 Patients were vaccinated subcutaneously once a week with four weeks as one treatment course at Shiga University of Medical Science Hospital. On each vaccination day, 1 or 3 mg each of URLC10, CDCA1, and KIF20A peptides that were mixed with incomplete Freund's adjuvant (IFA) Montanide ISA 51 were administered. All subjects provided written informed consent for the collection of peripheral blood samples, which was approved by the ethical committee of Shiga University of Medical Science Hospital (Approval No.. 21-72/21-163). The protocol of T cell repertoire sequencing using these samples was approved by the Institutional Review Board (IRB) of University of Chicago (Approval No. 13-0214).
Peripheral blood lymphocyte preparation and enzyme-linked immunospot (ELISPOT) assay
Peripheral blood samples from five patients were collected at pre-vaccination as well as after 1, 2, and 3 courses of the vaccination. PBLs were isolated with Ficoll-Paque Plus (GE Healthcare) density gradient solution according to manufacturers’ instructions and frozen at –80°C immediately after isolation. To detect antigen-specific immune response, an ELISPOT assay was performed with the human γ-interferon (IFNγ) ELISPOT kit (Mabtech) as described previously.Citation23-25
CD8+ T lymphocyte preparation from peripheral blood of a healthy donor
Ten (10) mL peripheral blood samples from a healthy donor ID001 was collected and CD8+ T lymphocytes were isolated with Dynabeads® CD8+ kit (Life Technologies) according to manufacturers’ instructions and frozen at -80°C immediately after isolation.
5′RACE (5′ rapid amplification of cDNA end), fusion PCR method, and DNA sequencing
Total RNAs from patients’ PBLs were isolated by RNeasy Plus Mini Kit (QIAGEN) according to the manufacturer's instruction. RACE-ready cDNA was generated with addition of a common adapter at 5′ end of cDNA by using a SMART (Switching Mechanism At 5′ end of RNA Transcript) cDNA library construction kit (Clontech) and Advantage 2 PCR kit (Clontech). To prepare amplicon libraries compatible with Ion Torrent sequencing platform, the “Fusion PCR Method” was applied. Briefly, TCR 5′RACE cDNA was amplified using fusion PCR primers consisting of a sequencing adapter portion and a self-designed universal target-specific portion by Platinum PCR SuperMix High Fidelity system (Life Technologies):
TCR α repertoire:
forward: 5′-CCTCTCTATGGGCAGTCGGTGATTATCAACGCAGAGTGGCCAT-3′;
reverse: 5′-CCATCTCATCCCTGCGTGTCTCCGACTCAGCAGGGTCAGGGTTCTGGATA-3′;
TCR β repertoire:
forward: 5′-CCTCTCTATGGGCAGTCGGTGATTATCAACGCAGAGTGGCCAT-3′;
reverse: 5′-CCATCTCATCCCTGCGTGTCTCCGACT CAGTCTGATGGCTCAAACACAGC-3′.
Primer sequences underlined represent sequencing adaptors (P1 and A) for the Ion Torrent platform. The target-specific portion of the PCR forward primers for TCR α and β repertoire were designed based on the 5′ common adapter of RACE-ready cDNA; the target-specific portion of reverse primers were designed based on the TCR α and β constant regions, respectively.
Amplification was performed as follows: 3 min at 94°C; 40 cycles of 30 s at 94°C, 30 s at 65°C, and 35 s at 68°C. PCR products were purified by Agenecourt AMPure XP reagent (Beckman Coulter) and size-selected at 500–700 bp by using Pippin Prep (Sage Science). Size-selected PCR products were then analyzed by Agilent 2200 TapeStation Nucleic Acid System (Agilent) to determine the molar concentration for dilution required for template preparation. After library preparation, amplicon template was amplified onto the proprietary Ion Sphere Particles by emulsion PCR using Ion PGM Template OT2 400 kit, and then sequenced on the Ion Torrent PGM sequencer by using Ion PGM Sequencing 400 kit and the Ion 314 v2 and 318 v2 chips for TCR α and β samples, respectively.
Algorithm of V (D) J decomposition with soft-clipping
The identification of V, (D), J and C segments in individual sequencing reads was conducted in the following manner. First, each read was mapped to V,J and C exons of TCR α or β reference sequences by Bowtie 2 aligner (Ver. 2.1.0)Citation22; the reference sequences were obtained from IMGT/GENE-DBCitation23 from The International ImMunoGeneTics Information System (IMGT®, www.imgt.org).Citation23 Bowtie 2 aligner allowed the soft-clipped (trimmed) mapping in which it trimmed nucleotides in one or both ends of a read sequence and mapped the trimmed subsequence to a reference sequence. Thus, a read was mapped to reference sequences of individual segments, i.e., V, J and C segments, separately.
Secondly, if a triplet of V, J and C segments was identified properly in a single read in which the V, J and C segments were placed in the right order from 5′ end to 3′ end, a junction sequence between the V and J segments in the read was analyzed. The boundaries of the junction sequence were at the 3′ end of the V segment and the 5′ end of the J segment that may have deletions with respect to exons in the reference sequences due to the somatic rearrangement process. Note that if a set of the three segments was not properly identified in a read, especially in which J and C exons were identified but not a V exon, the read was stored for the following unmapped part analysis. For TCR-α, the junction sequence was recognized as an N segment of a non-templated nucleotide sequence. For TCR-β, the junction sequence may include either of two D exon segments between two N segments; the N segment between V and D segments was known as N1, and the other one between D and J segments was known as N2. Thus, a D segment in the junction sequence was searched by scoring similarities of subsequences of the junction sequences to either of the two D segment references with a sliding window methodCitation10_ENREF_33; the identified D segment sequence often included deletions on one or both sides of the sequence. Once a D segment was identified, N1 and N2 segments were also determined. If a D segment is not assigned to either of the D exons, the junction sequence is recognized as a single N segment.
Lastly, a read in which V, J, and C segments were determined is characterized by identifiers of the reference sequences and deletion numbers of V, (D) and J segments and sequences of N segments.
CDR3 determination
After decomposition of sequencing reads into V, (D), J and C segments, amino acid sequences of CDR3 regions were determined. A CDR3 region is defined as a region starting from the second conserved cysteine encoded in the 3′ portion of the V segment and ending with the conserved phenylalanine (or tryptophan) encoded in the 5′ portion of the J segment. Thus, the nucleotides corresponding to the conserved amino acids were searched in the segmented read. To find the second conserved cysteine, a pair of consecutive codon sequences, i.e., six nucleotides consisting of the conserved second cysteine and an amino acid followed by the second conserved cysteine included in the reference sequence was searched from the 5′ end of the V segment of a read. When the second conserved cysteine was identified within the six nucleotides, the reading frame was fixed and then the conserved phenylalanine (or tryptophan) was searched in the J segment in the similar manner for the second conserved cysteine along with the fixed reading frame, i.e., a pair of consecutive codon sequences for the conserved phenylalanine (or tryptophan) and a following amino acid is searched from the 3′ end of the J segment of the read. The use of six-nucleotide sequence for search increased the specificity. If nucleotide sequences of both of the conserved amino acids were identified within the same reading frame, the amino acid sequence of the CDR3 region was determined and recorded.
Statistical analyses
The inverse Simpson's index was calculated by the following equation:
where K is the total number of clonotypes, ni is the number of sequences belonging to the i-th type, and N is the total number of sequences for which clonotypes are determined.
Unmapped part analysis
In order to further clarify sequence reads in which J and C segments were identified but a V segment was not, we remapped the unmapped parts of those reads to the TCR genomic reference sequence of GRCh38 and then classified them on the basis of the re-mapped regions.
Sanger sequencing to confirm potentially novel exons
Patients’ TCR cDNA or genomic DNA of the healthy donor was first amplified using novel TRA V1–1 primers or novel TRB V19 specific primers by Platinum PCR SuperMix High Fidelity system (Life Technologies). Primer sequences were as follows: novel TRA V1–1 forward primer: 5′-CTTGAGCAGCCCTCTGAAGT-3′, novel TRA V1–1 reverse primer: 5′-CTCACA-GCGCAGAAGTAAGAG-3′, novel TRB V7–6 forward primer: 5′-CTGGTAAAGCTCCCATCCTG-3′, novel TRB V7–6 reverse primer: 5′-GCCCGAAGAACTGCTCAT-3′, novel TRB V19 forward primer: 5′-CGAGCCAAGTCTCTTTTCTCA-3′, novel TRB V19 reverse primer: 5′-TGTGAGTCTGGT-GCCTTGTC-3′. Ten (10) ng DNA was used in the volume of 50 μL reaction and the PCR conditions were as follows: initiation at 94°C for 2 min, 30 cycles of 94°C for 30 s, 58 °C for 30 s, and 68°C for 60 s. PCR products were then run on 1% Agarose gel, selected at the target size (99 bp for novel TRA V1–1del, 230bp for novel TRB V7–6variant, and 209bp for novel TRB V19variant), and purified by using QIAquick Gel Extraction Kit (QIAGEN). Size-selected and gel-purified PCR products were subjected to Sanger sequencing by using the same primers for PCR amplification. The sequencing PCR protocol of BigDye Terminator version 3.1 (Life Technologies) was applied and samples were sequenced using the 3500xl Genetic Analyzer (Life Technologies).
Disclosure of Potential Conflicts of Interest
No potential conflicts of interest were disclosed.
Supplemental Material
Supplemental data for this article can be accessed on the publisher's website.
KONI_A_968467_Supplementary_Figure_caption.zip
Download Zip (10.8 KB)968467_Supplementary_Materials.zip
Download Zip (1.1 MB)Funding
H.F. is supported by a training grant (T32 GM007019) the National Institutes of Health in Clinical Therapeutics. We thank Dr. Paula Friedman for editing our manuscript.
References
- Mellman I, Coukos G, Dranoff G. Cancer immunotherapy comes of age. Nature 2011; 480:480-9; PMID:22193102; http://dx.doi.org/10.1038/nature10673
- Topalian SL, Weiner GJ, Pardoll DM. Cancer immunotherapy comes of age. J Clin Oncol 2011; 29:4828-36; PMID:22042955; http://dx.doi.org/10.1200/JCO.2011.38.0899
- Brower V. Approval of provenge seen as first step for cancer treatment vaccines. J Natl Cancer Inst 2010; 102:1108-10; PMID:20668267; http://dx.doi.org/10.1093/jnci/djq295
- Pardoll DM. The blockade of immune checkpoints in cancer immunotherapy. Nat Rev Cancer 2012; 12:252-64; PMID:22437870; http://dx.doi.org/10.1038/nrc3239
- Krogsgaard M, Davis MM. How T cells 'see' antigen. Nat Immunol 2005; 6:239-45; PMID:15716973; http://dx.doi.org/10.1038/ni1173
- Morris GP, Allen PM. How the TCR balances sensitivity and specificity for the recognition of self and pathogens. Nat Immunol 2012; 13:121-8; PMID:22261968; http://dx.doi.org/10.1038/ni.2190
- Robins HS, Campregher PV, Srivastava SK, Wacher A, Turtle CJ, Kahsai O, Riddell SR, Warren EH, Carlson CS. Comprehensive assessment of T-cell receptor beta-chain diversity in alphabeta T cells. Blood 2009; 114:4099-107; PMID:19706884; http://dx.doi.org/10.1182/blood-2009-04-217604
- Freeman JD, Warren RL, Webb JR, Nelson BH, Holt RA. Profiling the T-cell receptor beta-chain repertoire by massively parallel sequencing. Genome Res 2009; 19:1817-24; PMID:19541912; http://dx.doi.org/10.1101/gr.092924.109
- Robins HS, Srivastava SK, Campregher PV, Turtle CJ, Andriesen J, Riddell SR, Carlson CS, Warren EH. Overlap and effective size of the human CD8+ T cell receptor repertoire. Sci Trans Med 2010; 2:47ra64; PMID:20811043; http://dx.doi.org/10.1126/scitranslmed.3001442
- Yousfi Monod M, Giudicelli V, Chaume D, Lefranc MP. IMGT/JunctionAnalysis: the first tool for the analysis of the immunoglobulin and T cell receptor complex V-J and V-D-J JUNCTIONs. Bioinformatics 2004; 20(Suppl 1):i379-85; PMID:15262823; http://dx.doi.org/10.1093/bioinformatics/bth945
- Giudicelli V, Brochet X, Lefranc MP. IMGT/V-QUEST: IMGT standardized analysis of the immunoglobulin (IG) and T cell receptor (TR) nucleotide sequences. Cold Spring Harb Protoc 2011; 2011:695-715; PMID:21632778; http://dx.doi.org/10.1101/pdb.prot5633
- Schuster FR, Hubner B, Fuhrer M, Eckermann O, Gombert M, Dornmair K, Binder V, Reuther S, Krell P, Keller T et al. Highly skewed T-cell receptor V-beta chain repertoire in the bone marrow is associated with response to immunosuppressive drug therapy in children with very severe aplastic anemia. Blood Cancer J 2011; 1:e8; PMID:22829127; http://dx.doi.org/10.1038/bcj.2011.6
- Ishikawa N, Takano A, Yasui W, Inai K, Nishimura H, Ito H, Miyagi Y, Nakayama H, Fujita M, Hosokawa M et al. Cancer-testis antigen lymphocyte antigen 6 complex locus K is a serologic biomarker and a therapeutic target for lung and esophageal carcinomas. Cancer Res 2007; 67:11601-11; PMID:18089789; http://dx.doi.org/10.1158/0008-5472.CAN-07-3243
- Harao M, Hirata S, Irie A, Senju S, Nakatsura T, Komori H, Ikuta Y, Yokomine K, Imai K, Inoue M et al. HLA-A2-restricted CTL epitopes of a novel lung cancer-associated cancer testis antigen, cell division cycle associated 1, can induce tumor-reactive CTL. Int J Cancer 2008; 123:2616-25; PMID:18770861; http://dx.doi.org/10.1002/ijc.23823
- Li S, Lefranc MP, Miles JJ, Alamyar E, Giudicelli V, Duroux P, Freeman JD, Corbin VD, Scheerlinck JP, Frohman MA et al. IMGT/HighV QUEST paradigm for T cell receptor IMGT clonotype diversity and next generation repertoire immunoprofiling. Nat Commun 2013; 4:2333; PMID:23995877; http://dx.doi.org/10.1038/ncomms3333
- van Heijst JW, Ceberio I, Lipuma LB, Samilo DW, Wasilewski GD, Gonzales AM, Nieves JL, van den Brink MR, Perales MA, Pamer EG. Quantitative assessment of T cell repertoire recovery after hematopoietic stem cell transplantation. Nat Med 2013; 19:372-7; PMID:23435170; http://dx.doi.org/10.1038/nm.3100
- Carlson CS, Emerson RO, Sherwood AM, Desmarais C, Chung MW, Parsons JM, Steen MS, LaMadrid-Herrmannsfeldt MA, Williamson DW, Livingston RJ et al. Using synthetic templates to design an unbiased multiplex PCR assay. Nat Commun 2013; 4:2680; PMID:24157944; http://dx.doi.org/10.1038/ncomms3680
- Brady BL, Steinel NC, Bassing CH. Antigen receptor allelic exclusion: an update and reappraisal. J Immunol 2010; 185:3801-8; PMID:20858891; http://dx.doi.org/10.4049/jimmunol.1001158
- Alamyar E, Duroux P, Lefranc MP, Giudicelli V. IMGT((R)) tools for the nucleotide analysis of immunoglobulin (IG) and T cell receptor (TR) V-(D)-J repertoires, polymorphisms, and IG mutations: IMGT/V-QUEST and IMGT/HighV-QUEST for NGS. Methods Mol Biol 2012; 882:569-604; PMID:22665256; http://dx.doi.org/10.1007/978-1-61779-842-9_32
- Bolotin DA, Shugay M, Mamedov IZ, Putintseva EV, Turchaninova MA, Zvyagin IV, Britanova OV, Chudakov DM. MiTCR: software for T-cell receptor sequencing data analysis. Nat Methods 2013; 10:813-4; PMID:23892897; http://dx.doi.org/10.1038/nmeth.2555
- Daigo Y, Takano A, Teramoto K, Chung S, Nakamura Y. A systematic approach to the development of novel therapeutics for lung cancer using genomic analyses. Clin Pharmacol Ther 2013; 94:218-23; PMID:23657161; http://dx.doi.org/10.1038/clpt.2013.90
- Langmead B, Salzberg SL. Fast gapped-read alignment with Bowtie 2. Nat Methods 2012; 9:357-9; PMID:22388286; http://dx.doi.org/10.1038/nmeth.1923
- Giudicelli V, Chaume D, Lefranc MP. IMGT/GENE-DB: a comprehensive database for human and mouse immunoglobulin and T cell receptor genes. Nucl Acids Res 2005; 33:D256-61; PMID:15608191; http://dx.doi.org/10.1093/nar/gki010